
Compare the top Grafana alternatives, including free and paid tools, with pros, cons, use cases, and guidance on choosing the right option.

Ka Ling Wu
Co-Founder & CEO, Upsolve AI
10 min

Disclosure: This article is published by Upsolve AI. Where our product is mentioned alongside competitors, we aim to provide balanced coverage based on publicly available information. We encourage readers to evaluate all options independently.
Grafana is a strong choice for engineers monitoring infrastructure and time-series metrics. However, it can feel like overkill when the goal is simply to build, share, and maintain dashboards with minimal friction.
Many teams run into the same challenges. Grafana has a steep learning curve, setup can be complex, and dashboards often take longer to become usable in real workflows than expected. The review shown below reflects that experience clearly. Grafana is powerful, but not always easy to work with on a day-to-day basis.
If you are looking for something more straightforward, such as tools with a cleaner interface, faster setup, or drag-and-drop dashboard building, choosing the right Grafana alternative depends on how you actually use dashboards.
In this guide, you will learn:
When it makes sense to move beyond Grafana
10 alternatives and what each is best for
How to choose based on your use case (monitoring, BI, or embedded dashboards)
By the end, you will have a clear understanding of which alternatives fit your team’s needs and which ones can save you time and complexity.
What Is Grafana? (And Why People Look for Alternatives)
Grafana is a popular open-source platform used mainly for building dashboards and visualizing metrics. It’s loved by developers and technical teams worldwide.
People typically use Grafana to:
Track real-time metrics and KPIs.
Visualize complex data from various sources.
Set alerts and monitor system performance.
However, Grafana has some big drawbacks that frustrate users, especially those who aren’t deeply technical.
Here’s why teams often look for Grafana alternatives:
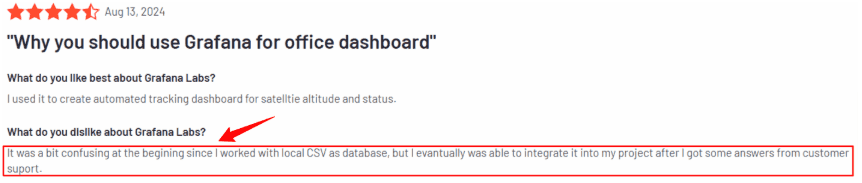
1. Steep Learning Curve
Grafana can be tricky for beginners. If you’re new to data visualization, setting up dashboards, configuring data sources, and using plugins might feel overwhelming and time-consuming.
Here's what users say:
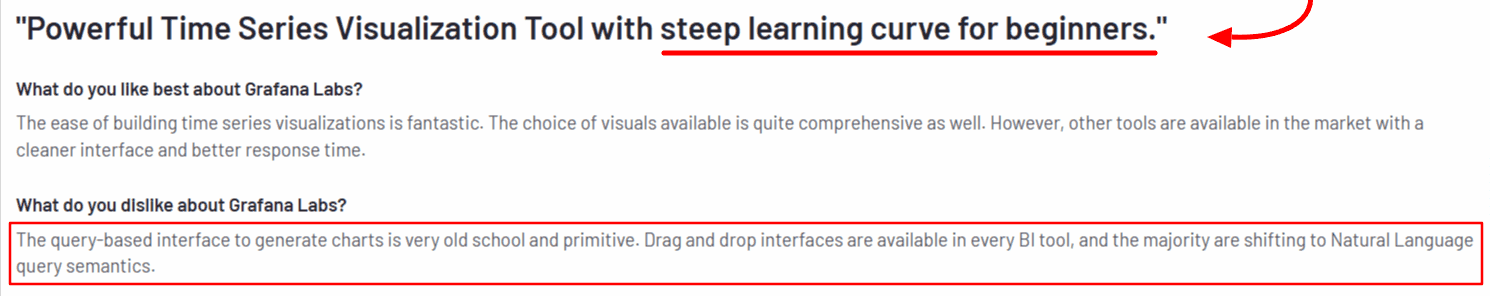
2. Limited User-Friendly Features
While Grafana offers powerful tools, it’s not the most intuitive for casual users.
Non-technical users may struggle with its interface, making it less accessible for teams without technical experts.
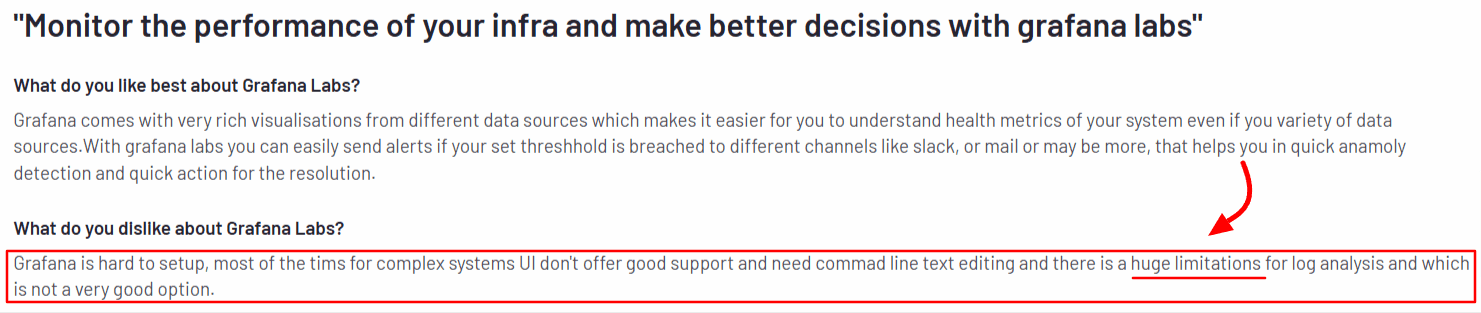
3. Basic Alerting Capabilities
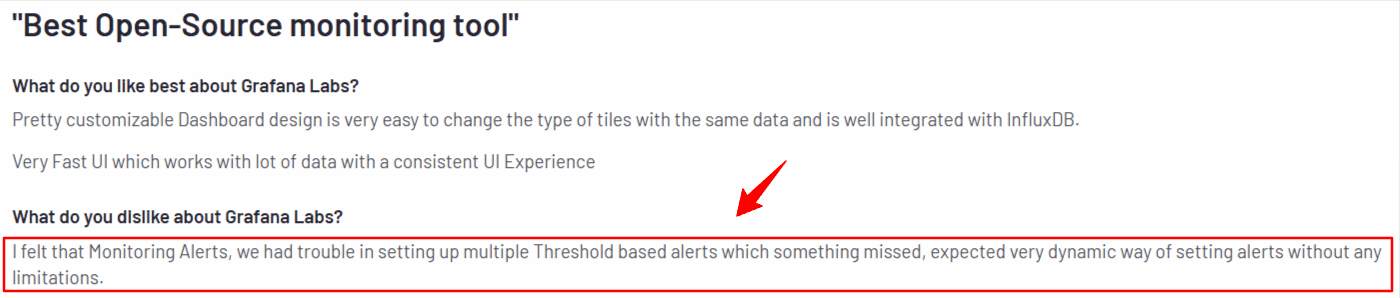
Grafana’s alerting system works well but is quite basic.
You can’t customize notifications as much as you’d like, and advanced workflows often need extra tools or integrations.
4. Performance Issues with Large Data Sets
When dealing with large or complex datasets, Grafana dashboards can slow down, making it hard to analyze real-time data efficiently.
5. Limited Advanced Visualizations
Grafana cannot help with unique or complex chart types. It focuses on standard visualizations, and adding more options often requires plugins or custom coding.
Top 10 Grafana Alternatives Ranked by Use Case
Before you dive into the full breakdown, here’s the quick comparison you need.
We compared the Top 10 Grafana alternatives side-by-side with features, best use cases, and how they help you. So you can spot the right fit fast without wasting hours.
Rank | Tool Name | Open Source | Hosting Type | Best For | Standout Feature |
|---|---|---|---|---|---|
1 | Tableau | ❌ | Cloud / On-Prem | Visual analytics & storytelling | Drag-and-drop advanced visuals |
2 | Power BI | ❌ | Cloud / Desktop | Beginners & MS Office users | Excel-like interface, easy setup |
3 | Kibana | ✅ | Self-hosted | Elasticsearch & log analytics | Seamless Elasticsearch integration |
4 | Datadog | ❌ | Cloud | Full-stack monitoring | Unified infra + app monitoring |
5 | Splunk | ❌ | Cloud / On-Prem | Large-scale data operations | Real-time search & incident alerts |
6 | Looker | ❌ | Cloud | Google Cloud & embedded use cases | Embedded analytics + LookML modeling |
7 | Prometheus | ✅ | Self-hosted | Infrastructure time-series metrics | Pull-based monitoring model |
8 | Zabbix | ✅ | Self-hosted | Server & network monitoring | Strong alerting & SNMP support |
9 | Metabase | ✅ | Cloud / Self-hosted | Small teams & startups | Simple interface for fast insights |
10 | Upsolve AI | ❌ | Cloud / On-Prem | Customer-facing dashboards | AI-powered dashboard builder |
Now, let’s check each Grafana competitor one by one to see which has better features:
1. Tableau – Popular Drag-and-Drop Visualization Tool
Tableau is among the most popular analytics platforms, known for transforming complex data into easy-to-understand visuals.
It helps teams quickly build interactive dashboards, collaborate on insights, and share visual stories without requiring deep technical knowledge.
Key Features of Tableau
Drag-and-Drop Builder: Quickly create visuals using simple drag-and-drop tools and pre-built dashboard templates.
Real-Time Syncing: Connects live with cloud databases and multiple data sources for updated, accurate metrics.
Flexible Deployment: Available via cloud or on-premise; dashboards accessible through desktop, mobile, and web.
Interactive Sharing: Easily share secure dashboards with interactive exploration features for smoother team collaboration.
Pros of Tableau
Stunning visuals that are much more advanced than Grafana’s standard charts.
Flexible deployment options to match business needs.
Scales easily for large teams and datasets.
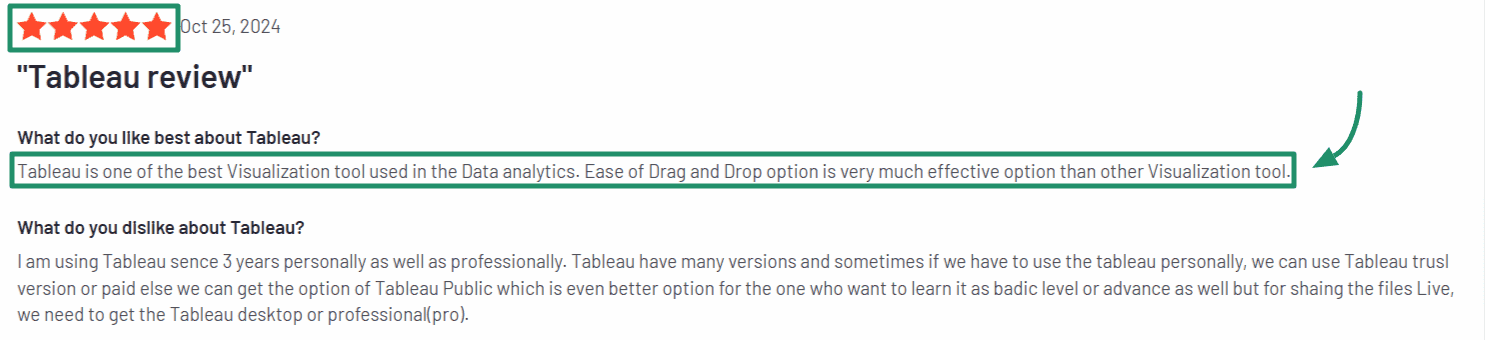
Cons of Tableau
Higher cost compared to Grafana and some other competitors.
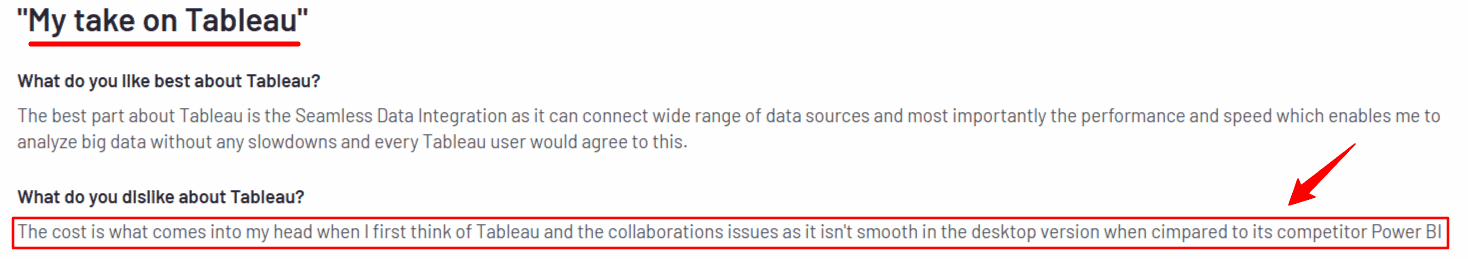
Alt tag: Tableau user review mentioning pricing concerns and collaboration limitations
It may feel overwhelming for users without prior analytics experience.
Tableau Pricing
Tableau provides clear and scalable pricing options depending on your organization's size and needs:
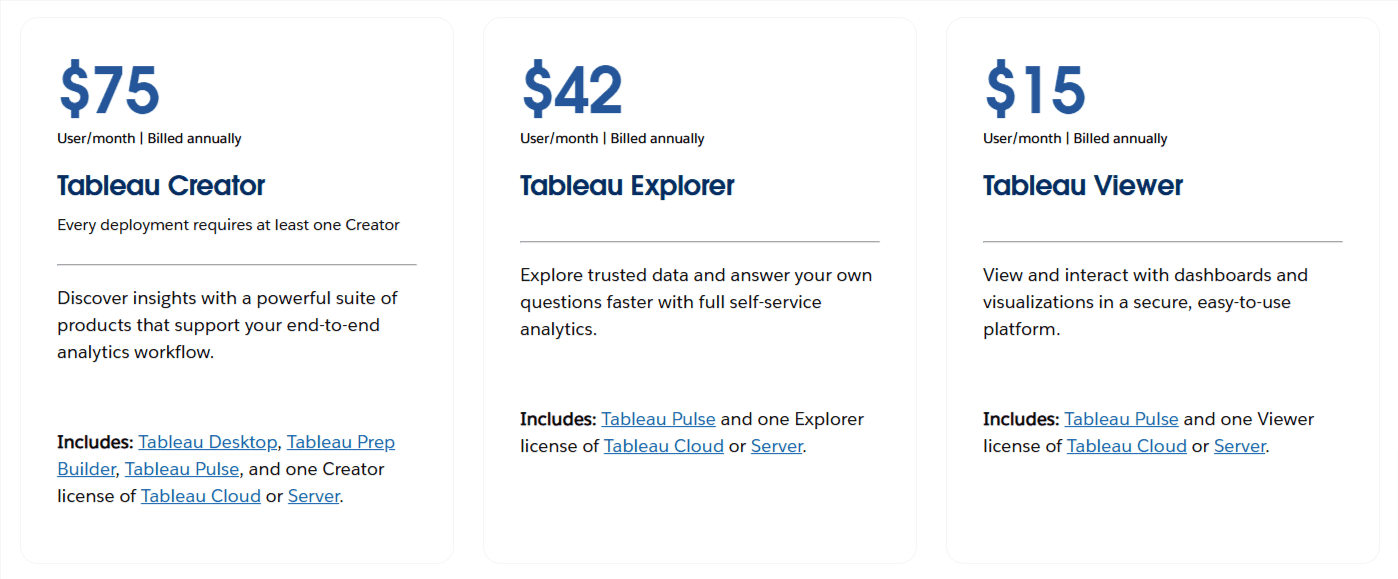
Creator: $75/user/month, full feature access.
Explorer: $42/user/month, essential analytics capabilities.
Viewer: $15/user/month, view-only dashboards, and share insights.
Enterprise: Custom pricing, advanced features for large organizations.
If you need a detailed overview of Tableau embedded analytics pricing, read here in detail.
So, Tableau looks powerful, but is it better than Grafana for your specific needs? Here's a quick comparison:
Feature | Grafana | Tableau |
Dashboard Speed | Slower, manual dashboard creation | Fast, intuitive drag-and-drop setup |
Setup Time | Complex and technical | Quick setup, easy for beginners |
Pricing | Free core, extras cost more | Starts at $15/user per month |
AI Features | None | Built-in AI capabilities (Einstein) |
Ease of Use | Steep learning curve | User-friendly, minimal training |
Best Features | Plugins, monitoring integrations | Advanced visuals, easy collaboration |
✅ Overall Rating: 4.6/5
Also Read: We Tested 5 Tableau Alternatives for Embedded Analytics
2. Power BI – Microsoft’s User-Friendly BI Tool
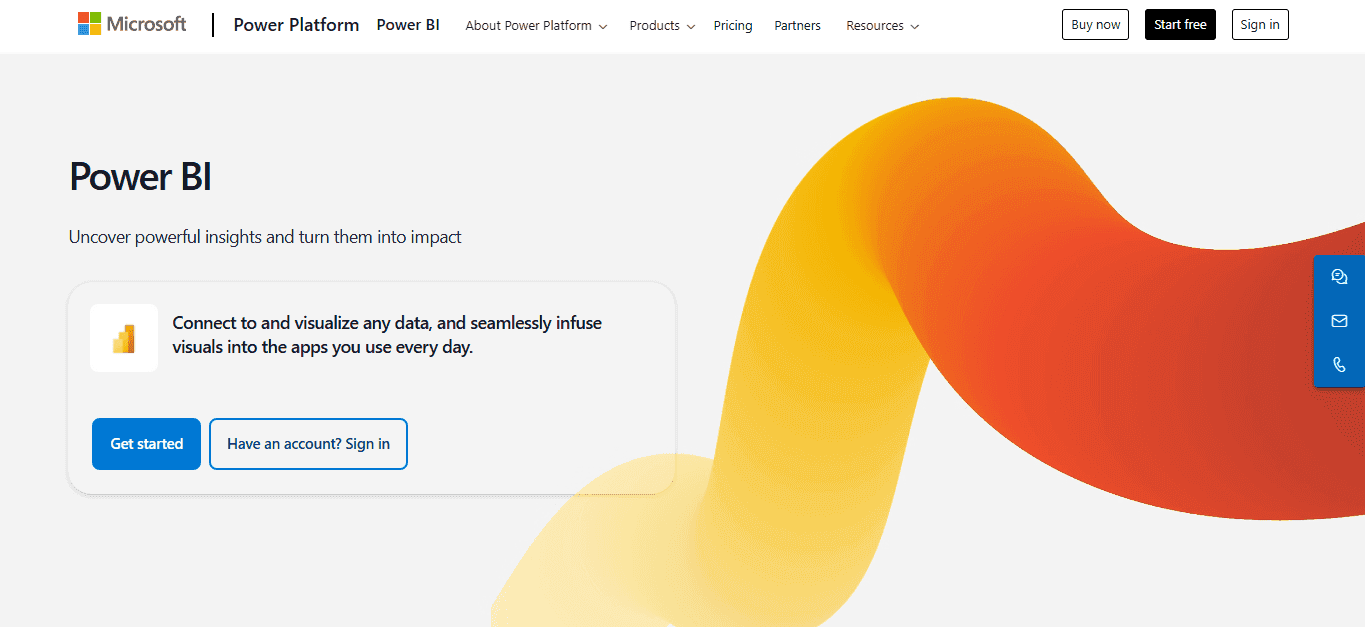
Power BI is Microsoft’s flagship business intelligence tool, built for smooth integration with Excel, Azure, and other Microsoft products.
Compared to Grafana’s technical setup, Power BI offers a more user-friendly experience, ideal for small to medium-sized teams seeking affordability and ease.
Key Features of Power BI
Seamless Microsoft Integration: Effortlessly connects with Excel, Azure, and Microsoft 365 tools to streamline workflows.
Advanced Data Modeling: Powerful calculations and analysis with intuitive modeling using Microsoft's DAX.
Real-Time Dashboards: Easy-to-navigate dashboards offering live, visually engaging insights for quick business decisions.
Intuitive Data Transformation: Simplified tools for data filtering and shaping, making analytics easier even for beginners.
Pros of Power BI
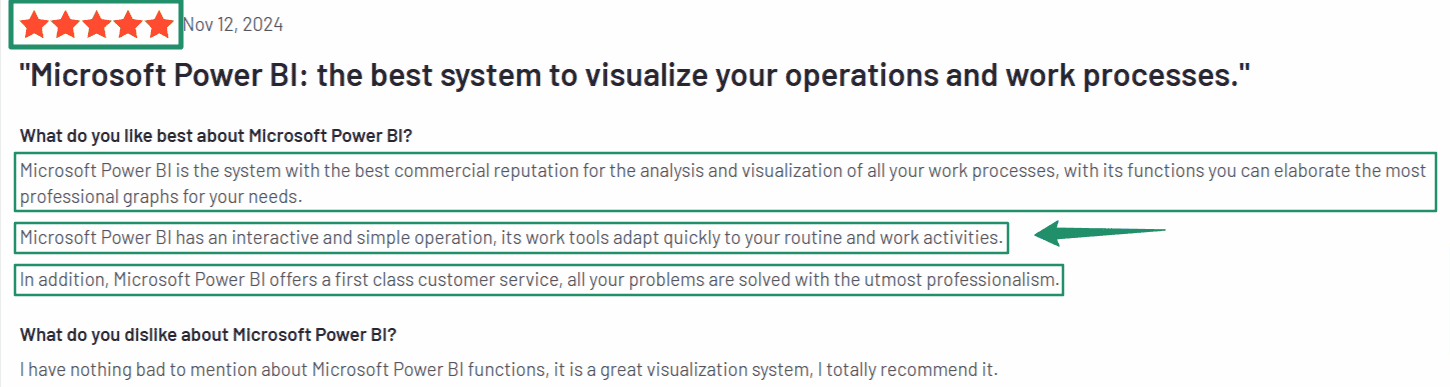
Alt tag: Microsoft Power BI user review praising ease of use and visualization capabilities
Flawless integration with Microsoft products for smoother workflows.
Affordable for small businesses with a powerful free version.
Flexible data modeling capabilities for advanced users.
Cons of Power BI
DAX and setup may be challenging for beginners.
Premium features require higher-tier plans.

Power BI Pricing
Power BI offers flexible pricing depending on the scale and features your team needs:
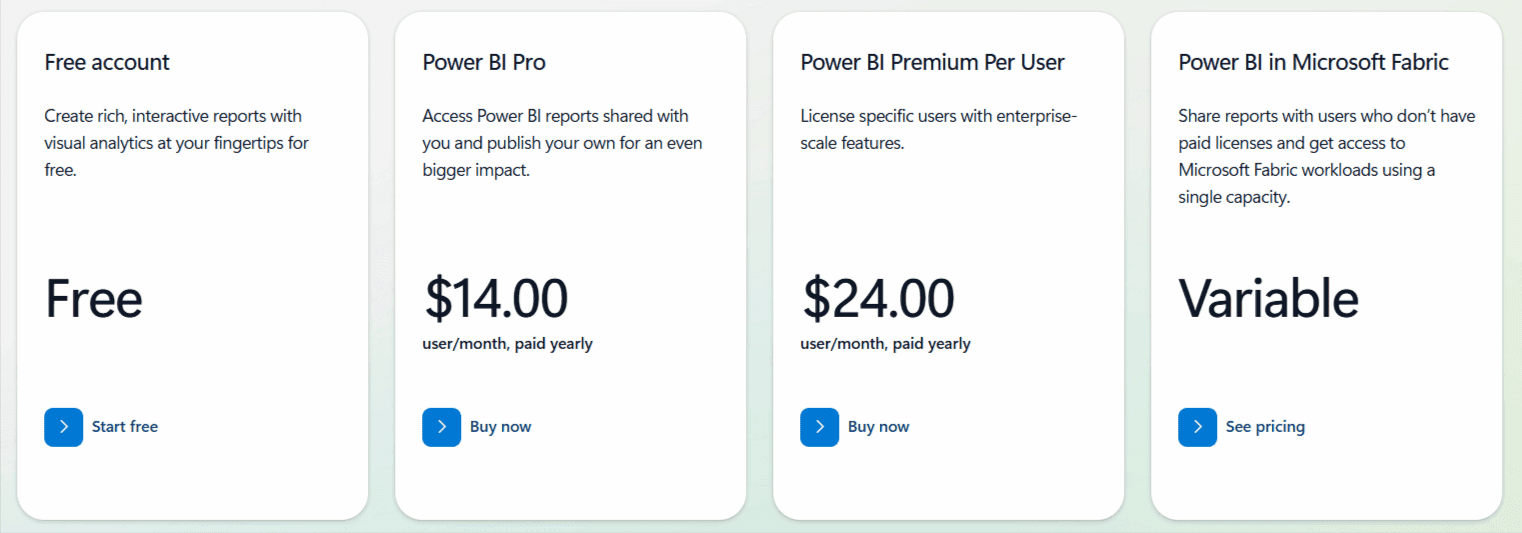
Free Account: $0 – Create interactive reports with built-in visual analytics.
Power BI Pro: $14/user/month (paid yearly) – Share and publish reports for team collaboration.
Power BI Premium (Per User): $24/user/month (paid yearly) – Includes enterprise-scale features.
Power BI in Microsoft Fabric: Variable pricing – Designed for broader sharing and access to Microsoft Fabric workloads.
Power BI’s combination of ease of use, seamless Microsoft integration, and updated plans makes it a practical Grafana alternative for businesses of all sizes.
So, Power BI looks practical, but is it really better than Grafana? Let’s quickly compare:
Feature | Grafana | Power BI |
Dashboard Speed | Moderate; manual dashboard creation | Fast and intuitive dashboard setup |
Setup Time | Technical, complex configuration | Quick, beginner-friendly setup |
Pricing | Free core; extras cost more | Starts free, Pro from $14/user/month |
AI Features | None | Built-in AI-driven analytics (Power Query) |
Ease of Use | Steep learning curve | Simple and intuitive user interface |
Best Features | Plugins, specialized monitoring | Excel integration, advanced data modeling |
✅ Overall Rating: 4.5/5
Also Read: Top 7 Power BI Competitors For Better Dashboard/Analytics
3. Kibana – Log Analytics & Visualization for Elasticsearch
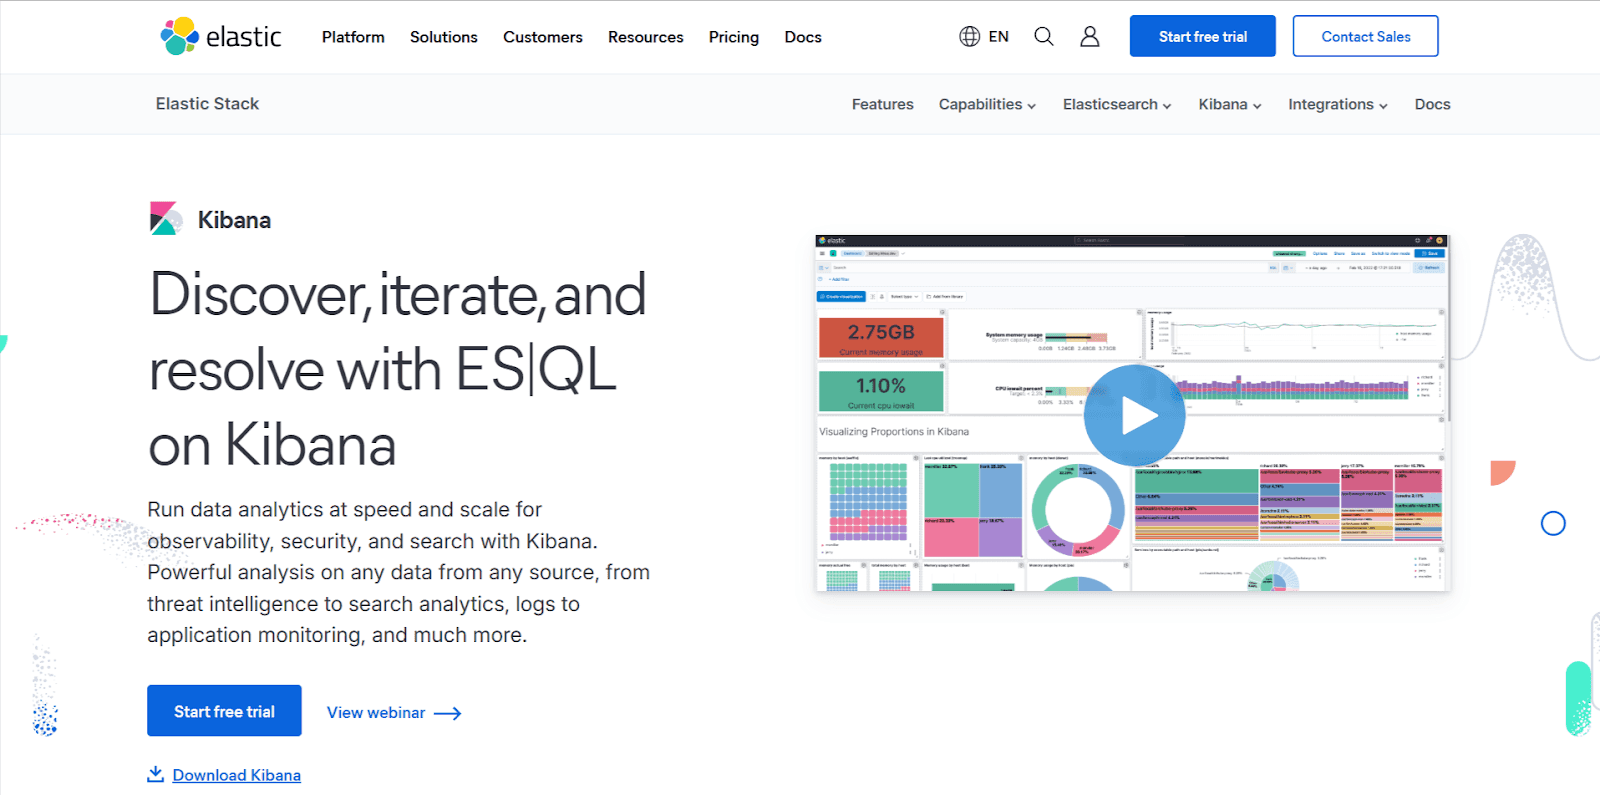
Kibana is a leading open-source alternative to Grafana, designed to work tightly with Elasticsearch.
It helps teams explore, monitor, and visualize logs and metrics in real time, making it perfect for system troubleshooting and log analysis.
Key Features of Kibana
Tight Elasticsearch Integration: Works directly with Elasticsearch to query, analyze, and visualize log data.
Custom Dashboards: Create dashboards showing trends, system metrics, and performance data in real time.
Live Monitoring: Track log activity and system health with real-time data updates and interactive visuals.
Query Support: Use Lucene syntax to filter and drill into your Elasticsearch data deeply.
Multiple Chart Options: Visualize data using heatmaps, pie charts, histograms, and more for deeper insights.
Pros of Kibana
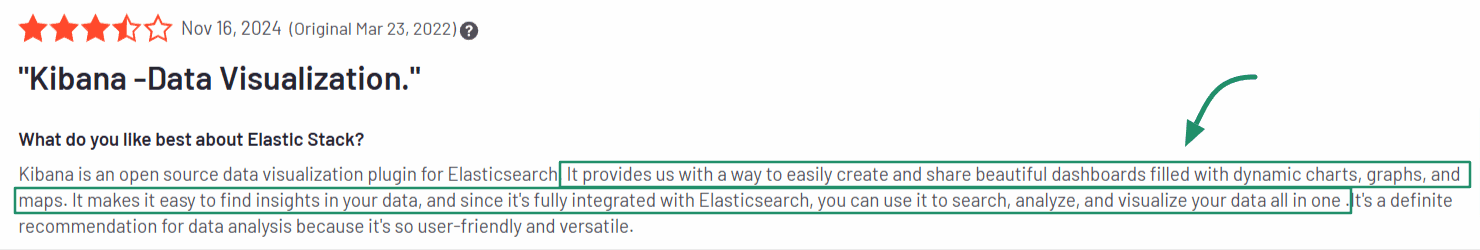
Fully integrated with Elasticsearch for seamless data management.
Free and open-source, making it accessible to all users.
Great for real-time monitoring and data exploration.
Cons of Kibana
The interface may feel technical and less intuitive for non-developers.
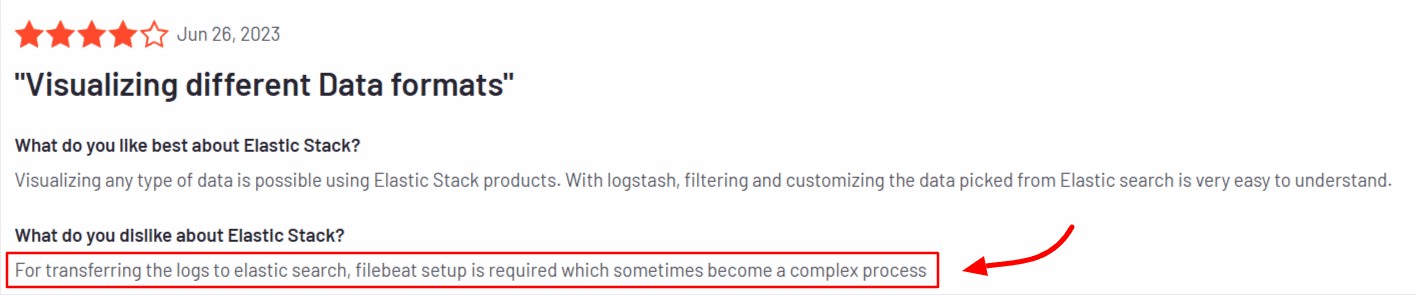
Limited standalone capabilities outside of the Elastic Stack.
Kibana Pricing
Kibana is free and open-source. However, Elastic offers paid plans with additional features and support depending on the scale and needs of your Elastic Stack setup.
So, Kibana feels powerful,but is it better than Grafana? Let’s quickly compare:
Feature | Grafana | Kibana |
Dashboard Speed | Customizable with plugins and widgets | Fast and focused on Elasticsearch logs |
Setup Time | Moderate setup, broad integration | Quick if you're using Elastic Stack |
Pricing | Free core; paid add-ons | Free, with optional Elastic pricing |
AI Features | None | None |
Ease of Use | Beginner-friendly interface | More technical, geared toward developers |
Best Features | Plugins, wide data source support | Deep log analysis, real-time monitoring |
✅ Overall Rating: 4.3/5
4. Datadog – Cloud-Based Monitoring & Analytics
Datadog is a cloud-based analytics and monitoring tool built for teams needing real-time visibility into infrastructure, applications, and services.
And, it’s a solid Grafana replacement for monitoring modern cloud-native infrastructure and apps at scale.
It combines robust dashboards, seamless integrations, and powerful alerting features, simplifying comprehensive performance monitoring across your entire tech stack.
Key Features of Datadog
Comprehensive Monitoring: Centralized tracking of infrastructure, apps, and user experiences.
Real-Time Dashboards: Interactive visualizations for immediate insights into metrics and logs.
500+ Integrations: Seamlessly connects with AWS, Azure, Kubernetes, and hundreds of other tools.
Advanced Alerts: Automatically detect anomalies and threshold breaches for fast incident response.
Unified Troubleshooting: Combine logs, metrics, and traces for quick root-cause analysis.
Pros of Datadog
Excellent all-in-one monitoring solution for complex systems.
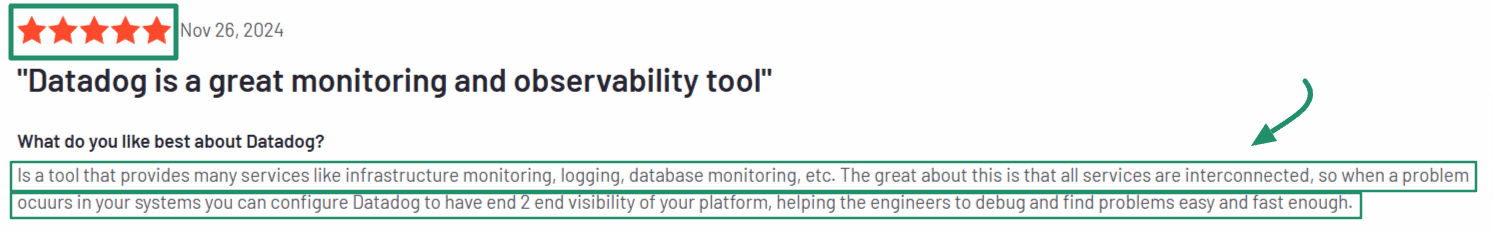
Integrates seamlessly with major platforms and services.
Customizable dashboards tailored to specific needs.
Cons of Datadog
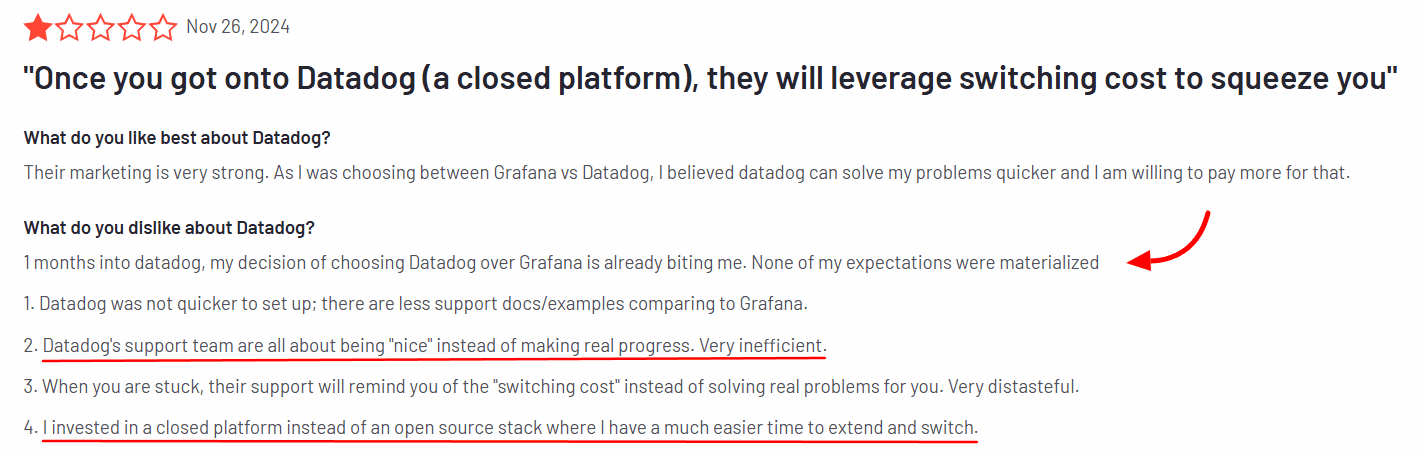
Alt tag: Datadog user review criticizing high switching costs and support experience
Pricing can add up quickly for businesses with large infrastructures.
Beginners may find the interface overwhelming initially.
Datadog Pricing
Datadog offers flexible pricing tiers based on scale and features:
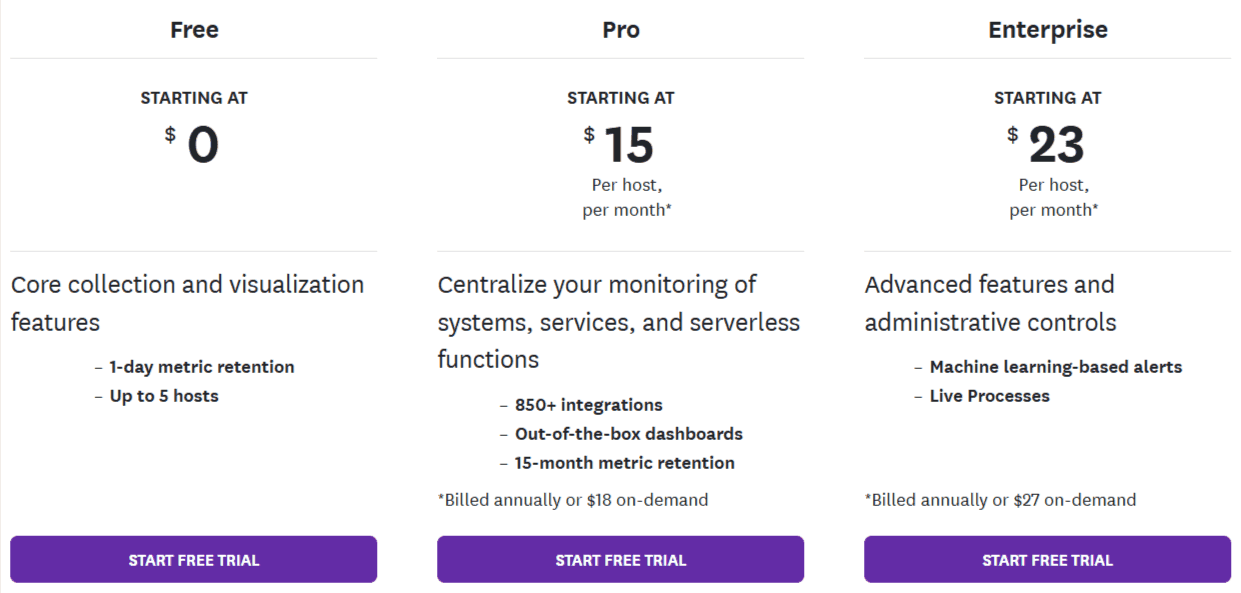
Free Plan: $0
Core metrics collection, 1-day retention, up to 5 hosts.Pro Plan: Starts at $15/host/month (billed annually)
Includes 850+ integrations, out-of-the-box dashboards, and 15-month metric retention.
(On-demand: $18/host/month)Enterprise Plan: Starts at $23/host/month (billed annually)
Advanced features include machine learning alerts, live processes, and administrative controls.
(On-demand: $27/host/month)
So, Datadog looks powerful, but is it really better than Grafana? Let’s quickly compare:
Feature | Grafana | Datadog |
Dashboard Speed | Moderate; setup requires configuration | Fast, interactive dashboards |
Setup Time | Complex, technical setup required | Quick, user-friendly guided setup |
Pricing | Free basic, advanced paid features | Free, Pro from $15/host/month |
AI Features | None | AI-driven anomaly detection and alerts |
Ease of Use | Technical, requires learning | Easy, intuitive for various skill levels |
Best Features | Plugins, wide integration support | Unified monitoring, logs, alerts, traces |
✅ Overall Rating: 4.4/5
5. Splunk – Real-Time Data Monitoring & Analysis
Splunk is a powerful analytics tool designed to monitor, search, and analyze large volumes of data in real time.
While Grafana focuses mainly on visualizations, Splunk provides advanced search capabilities, robust alerts, and detailed analytics, perfect for troubleshooting complex systems.
Key Features of Splunk
Real-Time Data Collection: Collects and analyzes data continuously to detect issues early.
Advanced Search: Quickly and precisely search through large datasets using Splunk’s intuitive tools.
Dynamic Dashboards: Easily create custom dashboards to identify trends and critical data patterns.
Custom Alerts: Configure alerts based on thresholds, allowing quick responses to minimize system downtime.
Pros of Splunk
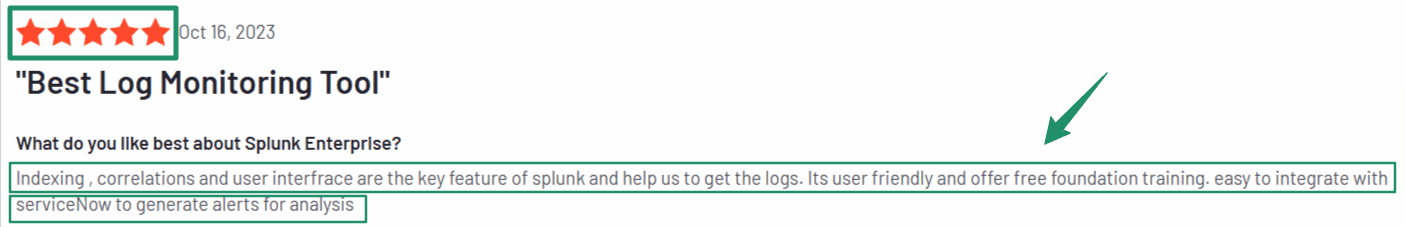
Excellent for managing and monitoring large datasets in real-time.
Highly scalable, ideal for growing businesses or enterprise needs.
Robust search capabilities to quickly find and analyze data.
Cons of Splunk
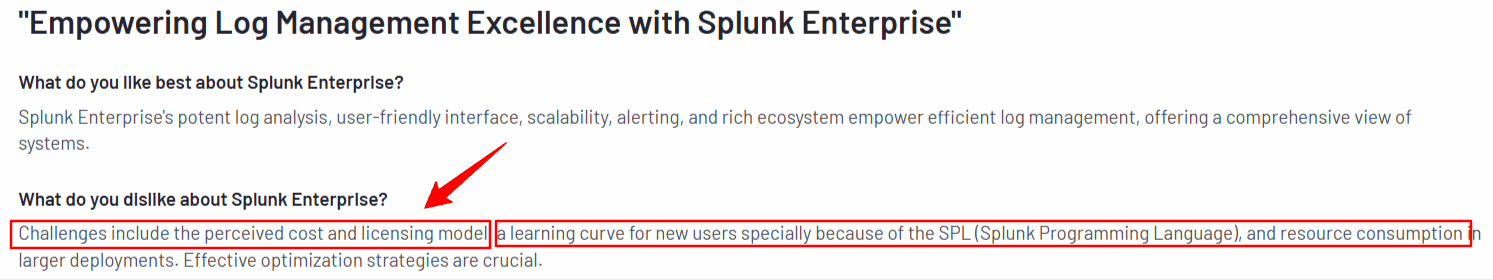
Pricing can be high for smaller teams or startups.
The interface has a learning curve, especially for non-technical users.
Requires significant resources to manage effectively in larger deployments.
Splunk Pricing
Splunk’s pricing varies depending on your data usage and specific business requirements, offering options from small-scale to enterprise-level needs.
While pricier than some alternatives, its advanced features, scalability, and powerful analytics justify the cost for complex systems.
So, Splunk looks powerful, but is it really better than Grafana? Let’s quickly compare:
Feature | Grafana | Splunk |
Dashboard Speed | Manual, moderate setup | Fast, dynamic, customizable dashboards |
Setup Time | Technical, can be complex | Easier, intuitive setup |
Pricing | Free core, advanced features paid | Higher, usage-based pricing |
AI Features | None | AI-driven analytics, advanced alerts |
Ease of Use | Developer-focused, technical | Intuitive for IT/security teams |
Best Features | Plugins, time-series visualizations | Advanced real-time search and analytics |
✅ Overall Rating: 4.3/5
6. Looker – Advanced Analytics & Embedded BI
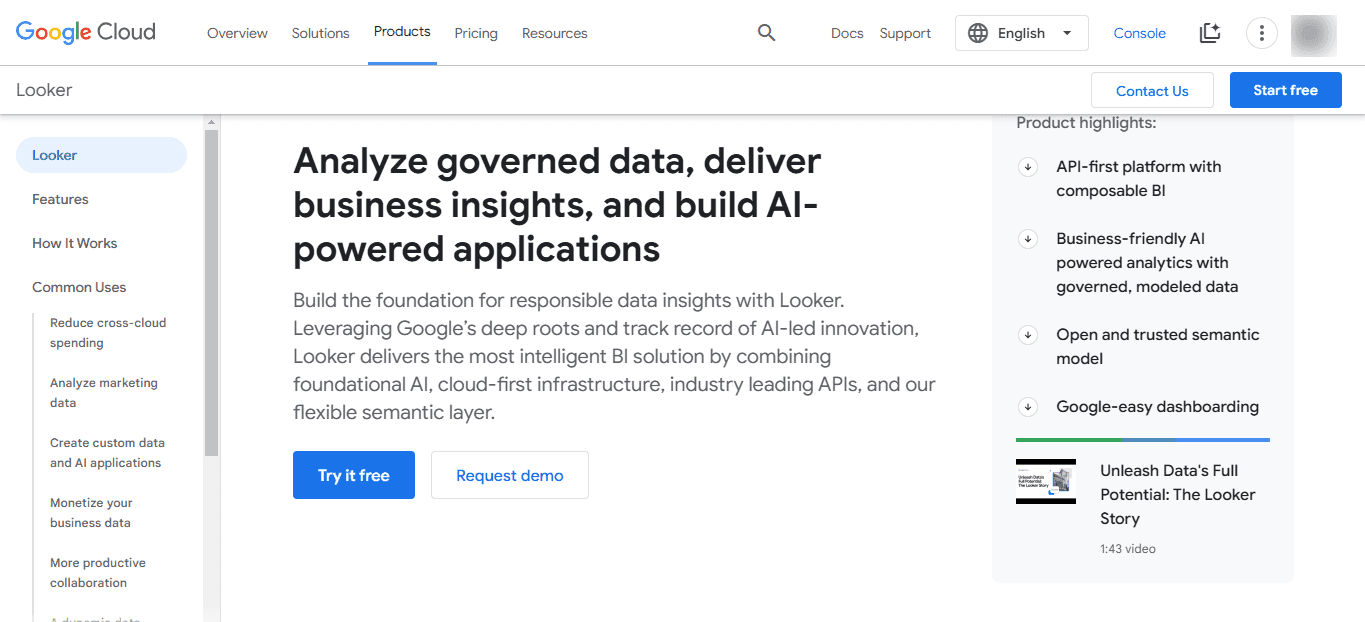
Looker, a Google Cloud product, is an analytics tool designed for deep data exploration, visualization, and embedded analytics.
Ideal for businesses already using Google Cloud, Looker provides highly flexible, customized reporting, seamless integrations, and robust embedded analytics for apps.
Key Features of Looker
Deep Data Exploration: Powerful, intuitive tools for detailed data analysis and compelling visualizations.
Google Cloud Integration: Effortlessly integrates with Google Cloud, streamlining data workflows for existing users.
Embedded Analytics: Easily embed actionable analytics directly into your apps for seamless user experiences.
Real-Time Data (LookML): Analyze and access live data using LookML, Looker’s flexible, custom analytics modeling language.
Pros of Looker
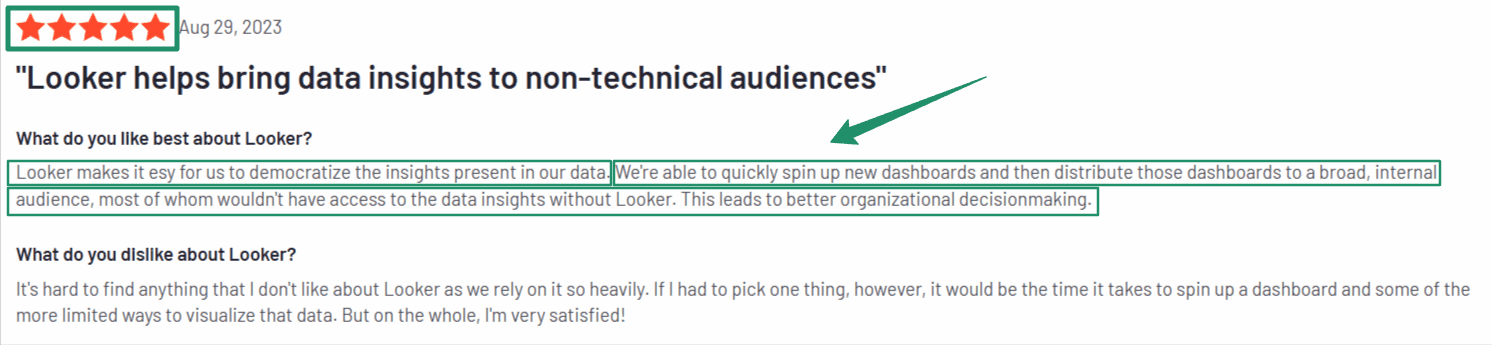
Exceptional for data exploration and deep insights.
Real-time data access through LookML.
A natural fit for businesses using Google Cloud products.
Cons of Looker
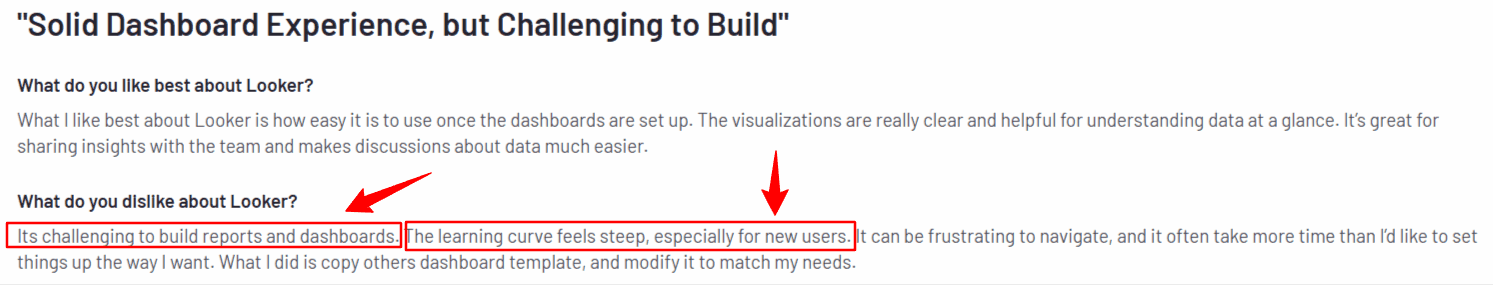
Higher cost, which might be a hurdle for small teams.
LookML has a steeper learning curve for new users.
Limited offline capabilities, as it’s built for cloud environments.
Looker Pricing
Looker offers customized pricing based on your specific business requirements and usage.
Though pricing can be higher, its advanced features, powerful embedded analytics, and flexibility offer significant value for the right businesses.
So, Looker seems strong, but is it really better than Grafana? Let’s quickly compare:
Feature | Grafana | Looker |
Dashboard Speed | Manual setup, moderate speed | Fast, real-time, and embedded dashboards |
Setup Time | Complex initial setup | Quick setup, intuitive interface |
Pricing | Free basic, premium add-ons | Custom pricing, typically higher |
AI Features | None | Advanced analytics (LookML) |
Ease of Use | Technical; suited for developers | Easy, user-friendly interface |
Best Features | Plugins, time-series monitoring | Embedded analytics, Google integrations |
✅ Overall Rating: 4.4/5
Also Read: Looker Embedded Analytics: Is It Worth It In 2025?
7. Prometheus – Open-Source Monitoring & Metrics Tool
Prometheus is a popular open-source monitoring system primarily used for collecting and storing time-series data.
It's perfect for teams needing detailed infrastructure monitoring, providing powerful querying capabilities, alerting, and strong integration with Kubernetes and other containerized environments.
Key Features of Prometheus
Time-Series Monitoring: Efficiently captures, stores, and analyzes time-series data from applications and infrastructure.
Flexible Querying: Uses PromQL, a powerful query language, for quick and detailed data retrieval.
Real-Time Alerting: Easily set custom alerts based on metric thresholds to proactively resolve issues.
Kubernetes Integration: Seamlessly integrates with Kubernetes, Docker, and other container technologies for detailed container monitoring.
Pros of Prometheus
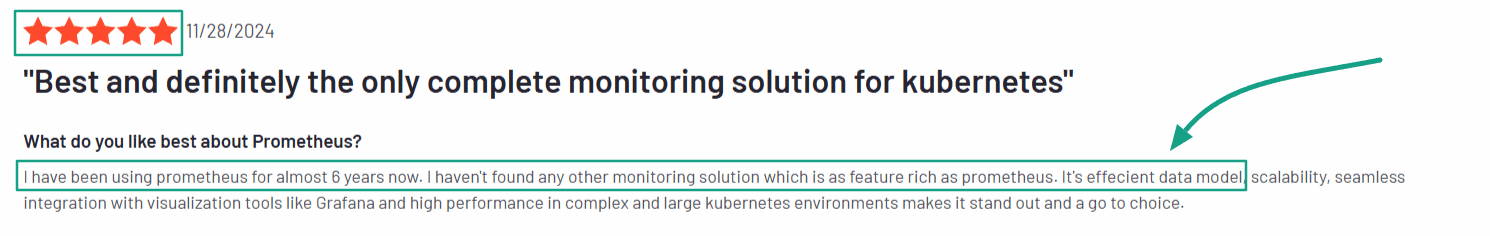
Alt tag: Prometheus user review praising scalability and Kubernetes monitoring performance
Completely free, open-source monitoring solution.
Excellent integration with Kubernetes and container platforms.
Robust querying capabilities for detailed metrics analysis.
Cons of Prometheus
Alt tag: Prometheus user review mentioning challenges with alert management and integrations
Requires technical skills for setup and maintenance.
Primarily built for metrics, lacks built-in log management.
Prometheus Pricing
Prometheus is completely free and open-source, making it ideal for businesses seeking cost-effective monitoring without licensing costs.
So, Prometheus is powerful and open-source, but is it really better than Grafana? Let’s quickly compare:
Feature | Grafana | Prometheus |
Dashboard Speed | Moderate; manual setup | Quick, powerful time-series querying |
Setup Time | Technical setup, broad integrations | Requires tech expertise for initial setup |
Pricing | Free core, premium add-ons | Completely free, open-source |
AI Features | None | None |
Ease of Use | User-friendly, requires moderate setup | Technical, geared toward developers |
Best Features | Visualization plugins, multiple data sources | Detailed metrics, Kubernetes integration |
✅ Overall Rating: 4.2/5
8. Zabbix – Open-Source Infrastructure Monitoring Tool
Zabbix is an open-source monitoring tool built to track servers, networks, and hardware infrastructure in real-time.
It’s widely used by IT teams that need a customizable, self-hosted solution for performance tracking, alerting, and system health monitoring.
Key Features of Zabbix
Real-Time Monitoring: Continuously monitors server health, network devices, and IT infrastructure metrics.
Flexible Alerts: Set up detailed alerts with custom thresholds for different hosts and services.
SNMP & IPMI Support: Supports network and hardware monitoring protocols for deeper visibility.
Auto Discovery: Automatically detects devices and services for faster onboarding and setup.
Pros of Zabbix
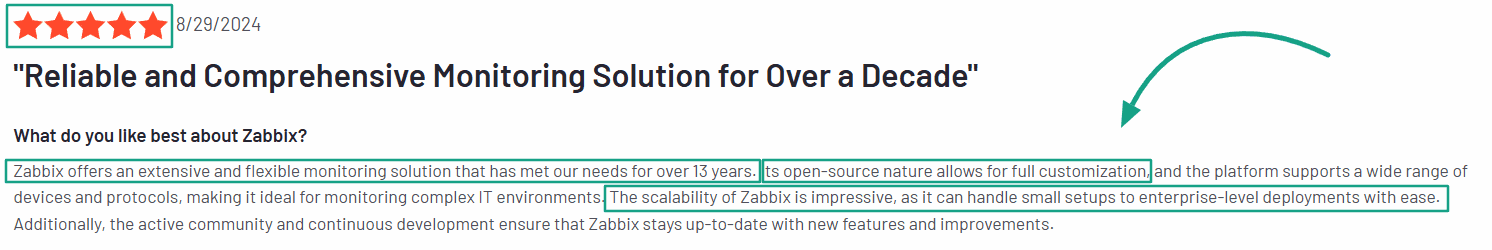
Alt tag: Zabbix user review highlighting long-term reliability, scalability, and open-source flexibility
Completely free and open-source for unlimited usage.
Ideal for infrastructure and network monitoring at scale.
Strong alerting and notification system with customization.
Cons of Zabbix

Alt tag: Zabbix user review noting complex setup and outdated user interface
UI feels outdated and harder to navigate than modern tools.
Requires technical skills to configure and maintain properly.
Zabbix Pricing
Zabbix is 100% free and open-source to deploy and use. Optional commercial support is available through paid Zabbix support packages for enterprise users.
So, Zabbix is great for infrastructure, but is it really better than Grafana? Let’s quickly compare:
Feature | Grafana | Zabbix |
Dashboard Speed | Fast, but depends on source integrations | Efficient for infrastructure monitoring |
Setup Time | Moderate with plugins | Requires technical setup and configuration |
Pricing | Free core; paid features optional | Fully free and open-source |
AI Features | None | None |
Ease of Use | Easier UI for dashboard creation | Technical, less modern interface |
Best Features | Dashboard visuals and integrations | SNMP/IPMI support, real-time infra alerts |
✅ Overall Rating: 4.1/5
9. Metabase – Simple, Open-Source BI Tool for Teams
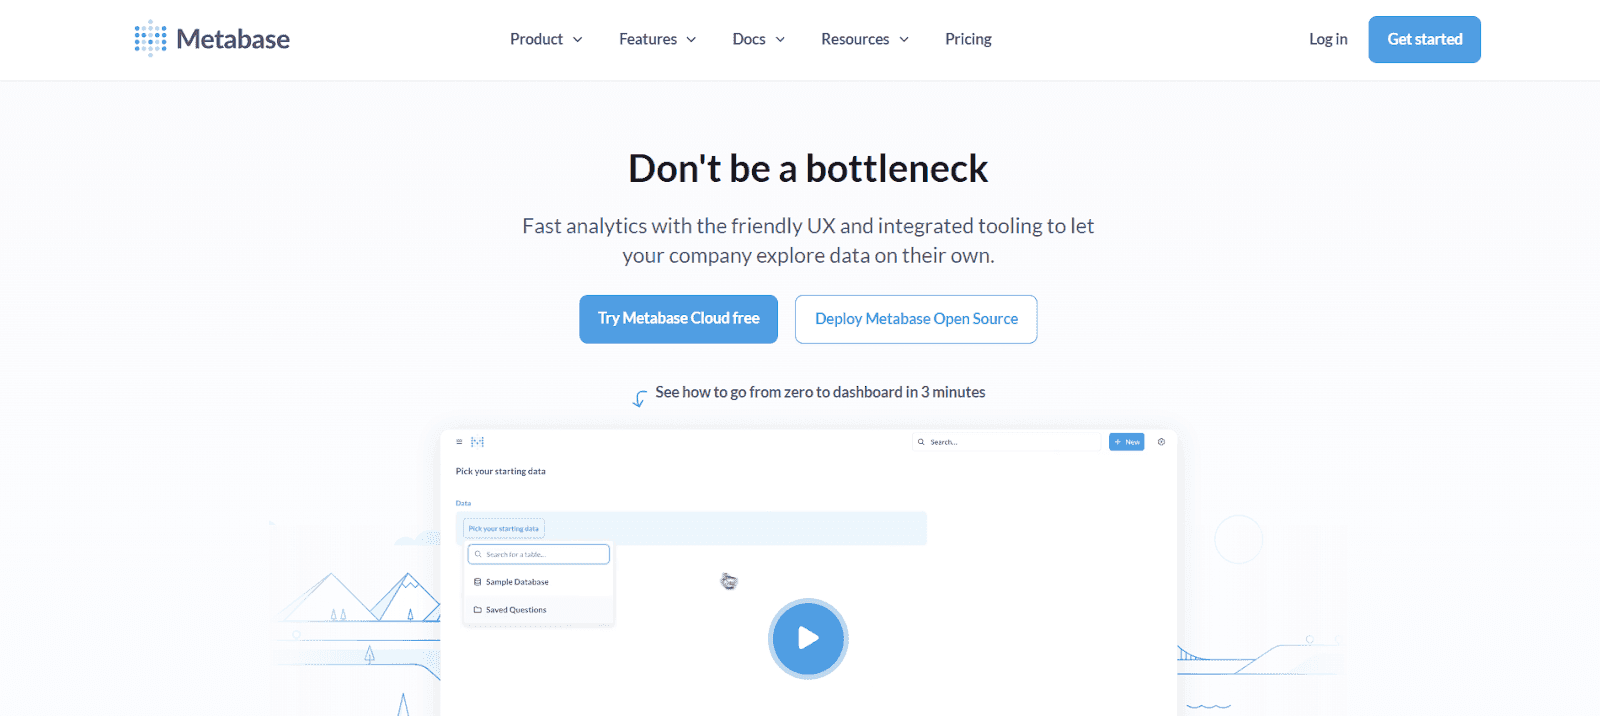
Metabase is an open-source business intelligence tool designed to help teams explore data and build dashboards without needing to write code.
It’s a strong choice for startups and growing businesses looking for fast, no-fuss analytics that work out of the box.
Key Features of Metabase
No-Code Queries: Create charts and dashboards using simple point-and-click interfaces, no SQL required.
Instant Sharing: Share reports and dashboards easily with teams via links or scheduled emails.
Database Integration: Connects with PostgreSQL, MySQL, MongoDB, and other popular databases quickly.
Embedded Analytics: Embed dashboards into products or apps without complex configuration.
Pros of Metabase
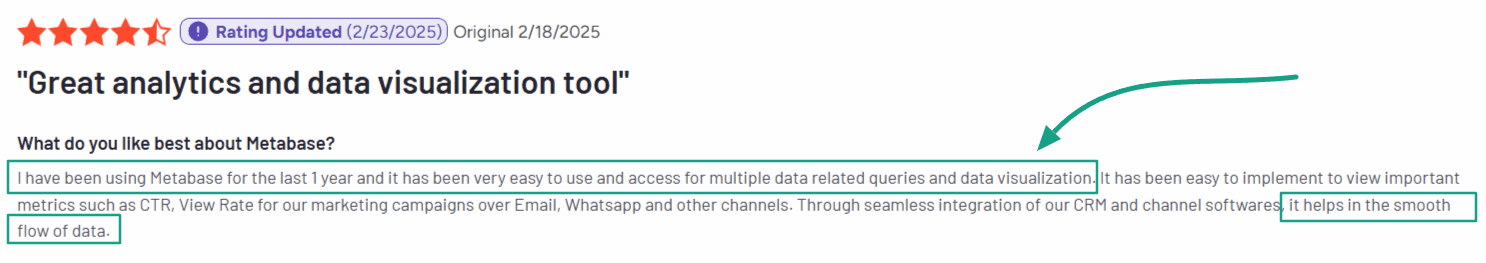
Alt tag: Metabase user review highlighting ease of use and smooth data visualization
Free and open-source with an easy-to-use interface.
Great for non-technical teams to explore data quickly.
Clean visuals and fast dashboard sharing.
Cons of Metabase
Alt tag: Metabase user review mentioning slow dashboard load times with many charts
Limited advanced features without Pro/Enterprise version.
Self-hosting requires manual maintenance and updates.
Metabase Pricing
Metabase offers both free and paid plans depending on your deployment needs:
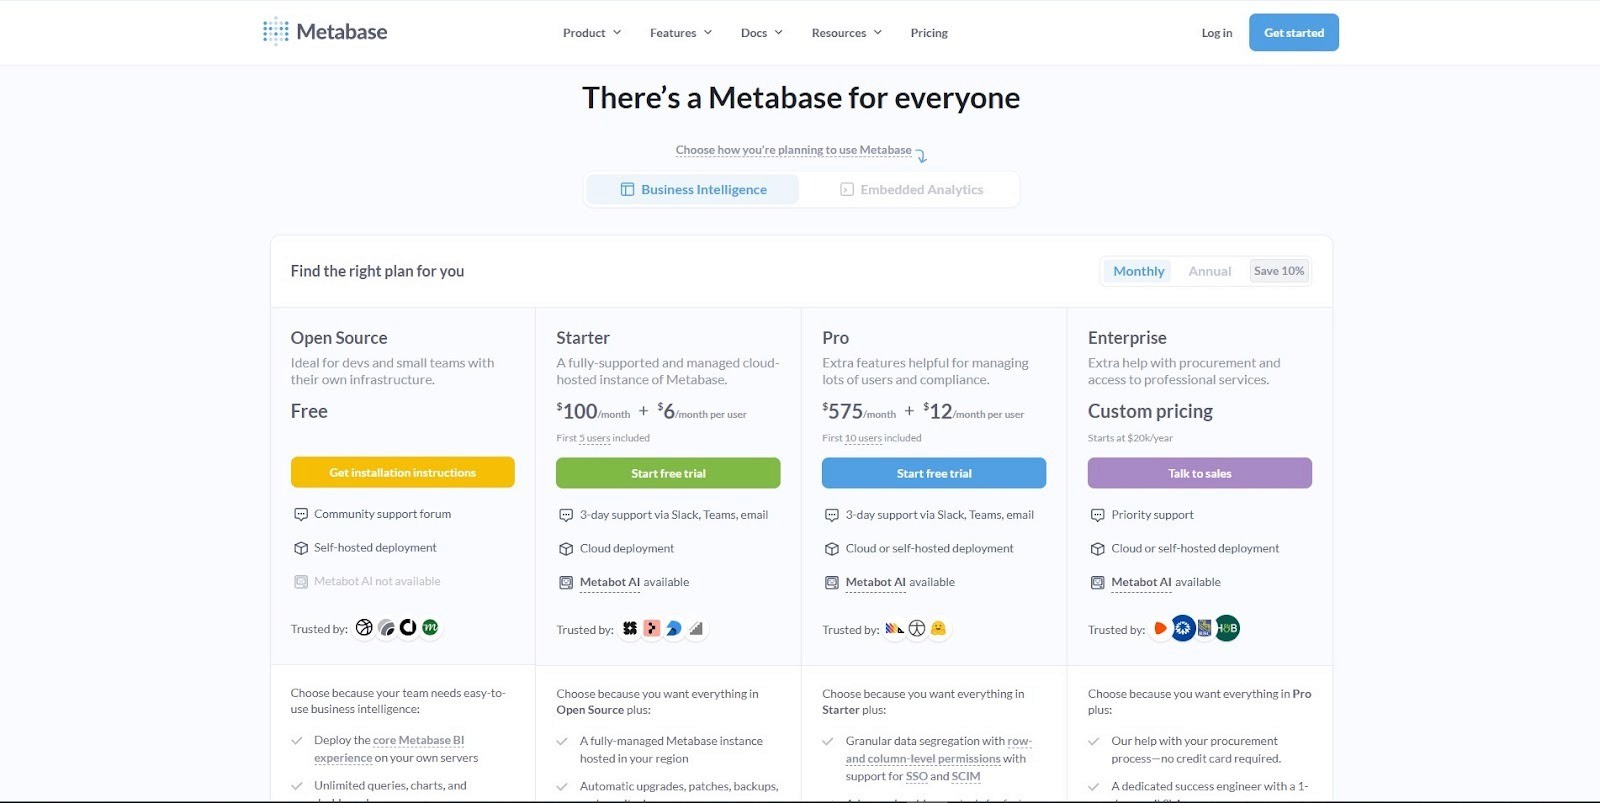
Open Source Plan: $0 – Free to self-host with core features and integrations.
Starter Plan: Starts at $100/month (includes 5 users) plus $6 per additional user – Cloud hosting with automatic updates, backups, email support, and basic embedding.
Pro Plan: Starts at $575/month (includes 10 users) plus $12 per additional user – Includes SSO, advanced permissions, white-labeling, usage analytics, and other governance features.
Enterprise Plan: Custom pricing (starts around $20k/year) – Includes priority support, advanced deployment options, and enterprise-grade services.
So, Metabase is simple and clean, but is it really better than Grafana? Let’s quickly compare:
Feature | Grafana | Metabase |
Dashboard Speed | Fast with manual setup | Quick, no-code dashboard creation |
Setup Time | Requires technical configuration | Fast setup, easy onboarding |
Pricing | Free core, with paid tiers | Free open-source; Starter plan starts at $100/mo |
AI Features | None | Limited, focused on simplicity |
Ease of Use | Technical UI, better for developers | Beginner-friendly, point-and-click |
Best Features | Monitoring dashboards, plugins | No-code queries, embedded dashboards |
✅ Overall Rating: 4.2/5
Also Read: 5 Tested Metabase Alternatives For Embeddable Analytics
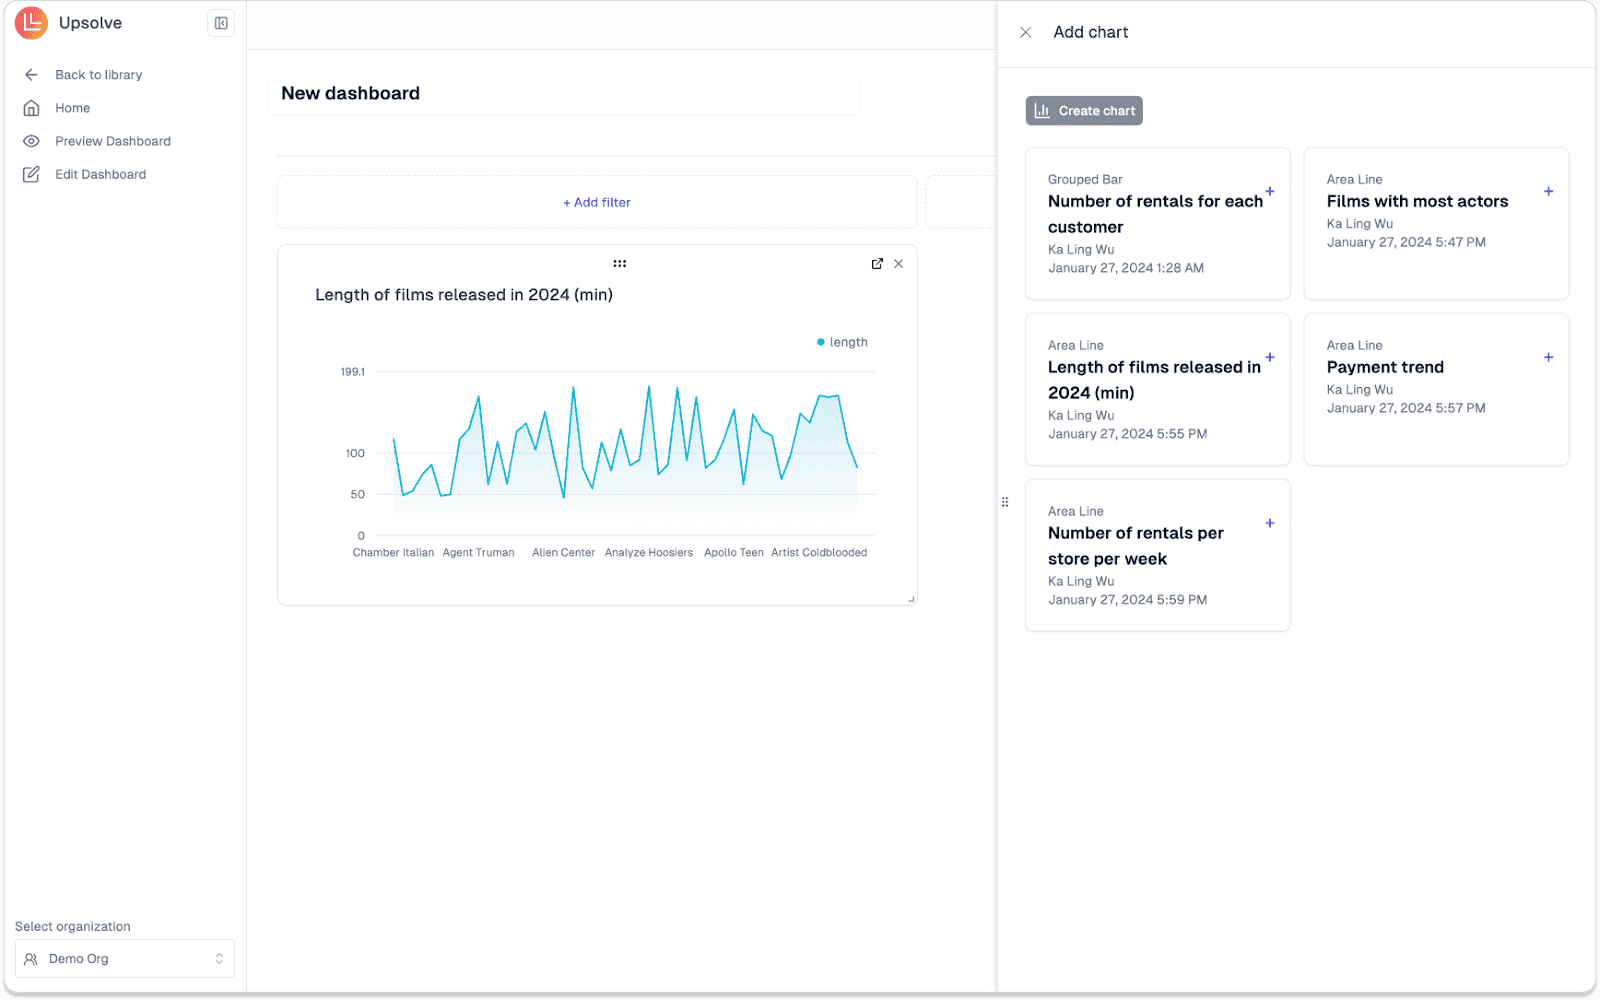
10. Upsolve.ai – AI-powered Dashboard Builder
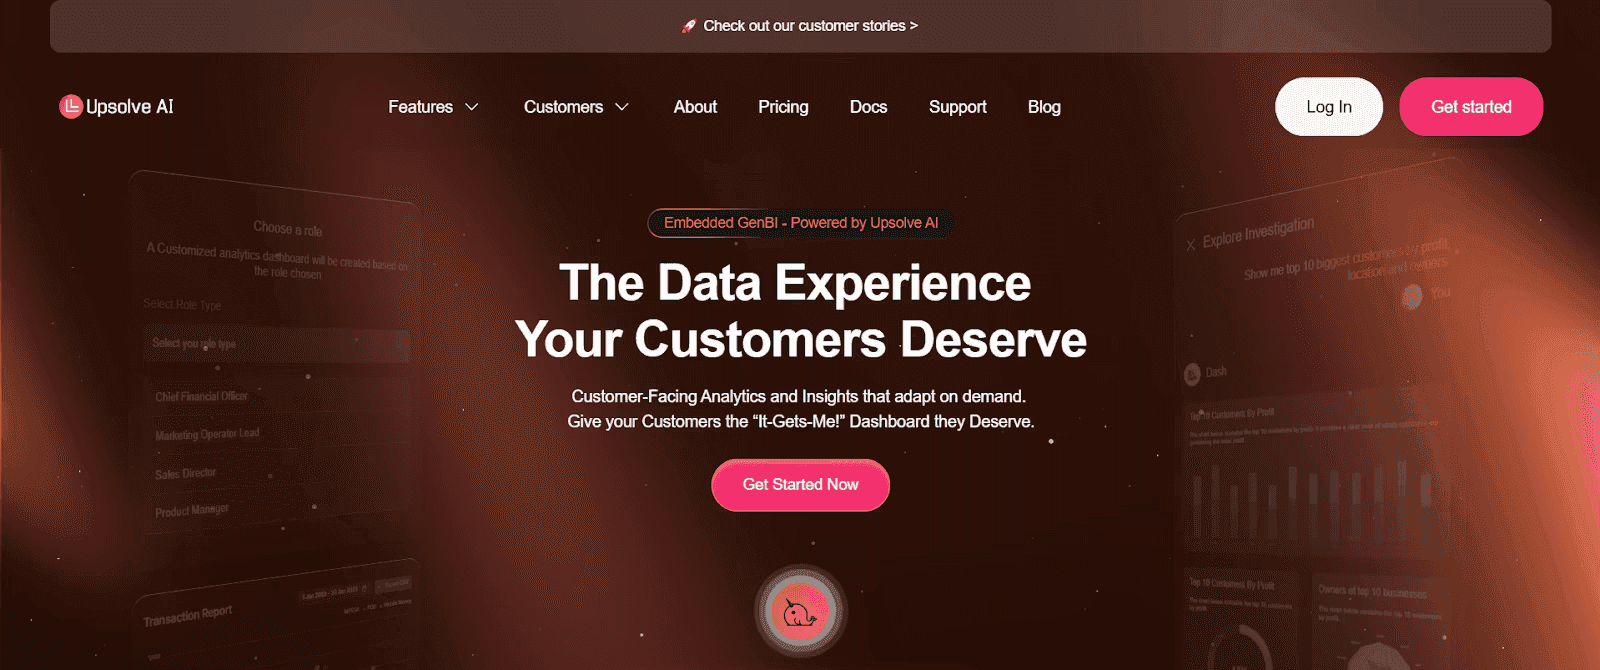
Upsolve AI is a two-sided agentic analytics platform. Business users work through an Agentic Dashboard, asking questions in plain language and describing the charts they want for the agent to build, while data teams use Agent Studio to encode the metric definitions and business rules that keep answers accurate.
For SaaS products, those agent-driven dashboards embed directly into your app, so customers get analytics in context rather than through a separate monitoring tool. Role-based access and row-level security scope each user to the data they should see.
One trade-off worth naming: Upsolve is built for agentic, customer-facing analytics, not for the infrastructure and observability monitoring that is Grafana's core strength.
Key Features of Upsolve.ai
AI Dashboard Builder: Instantly generates visualizations based on simple questions.
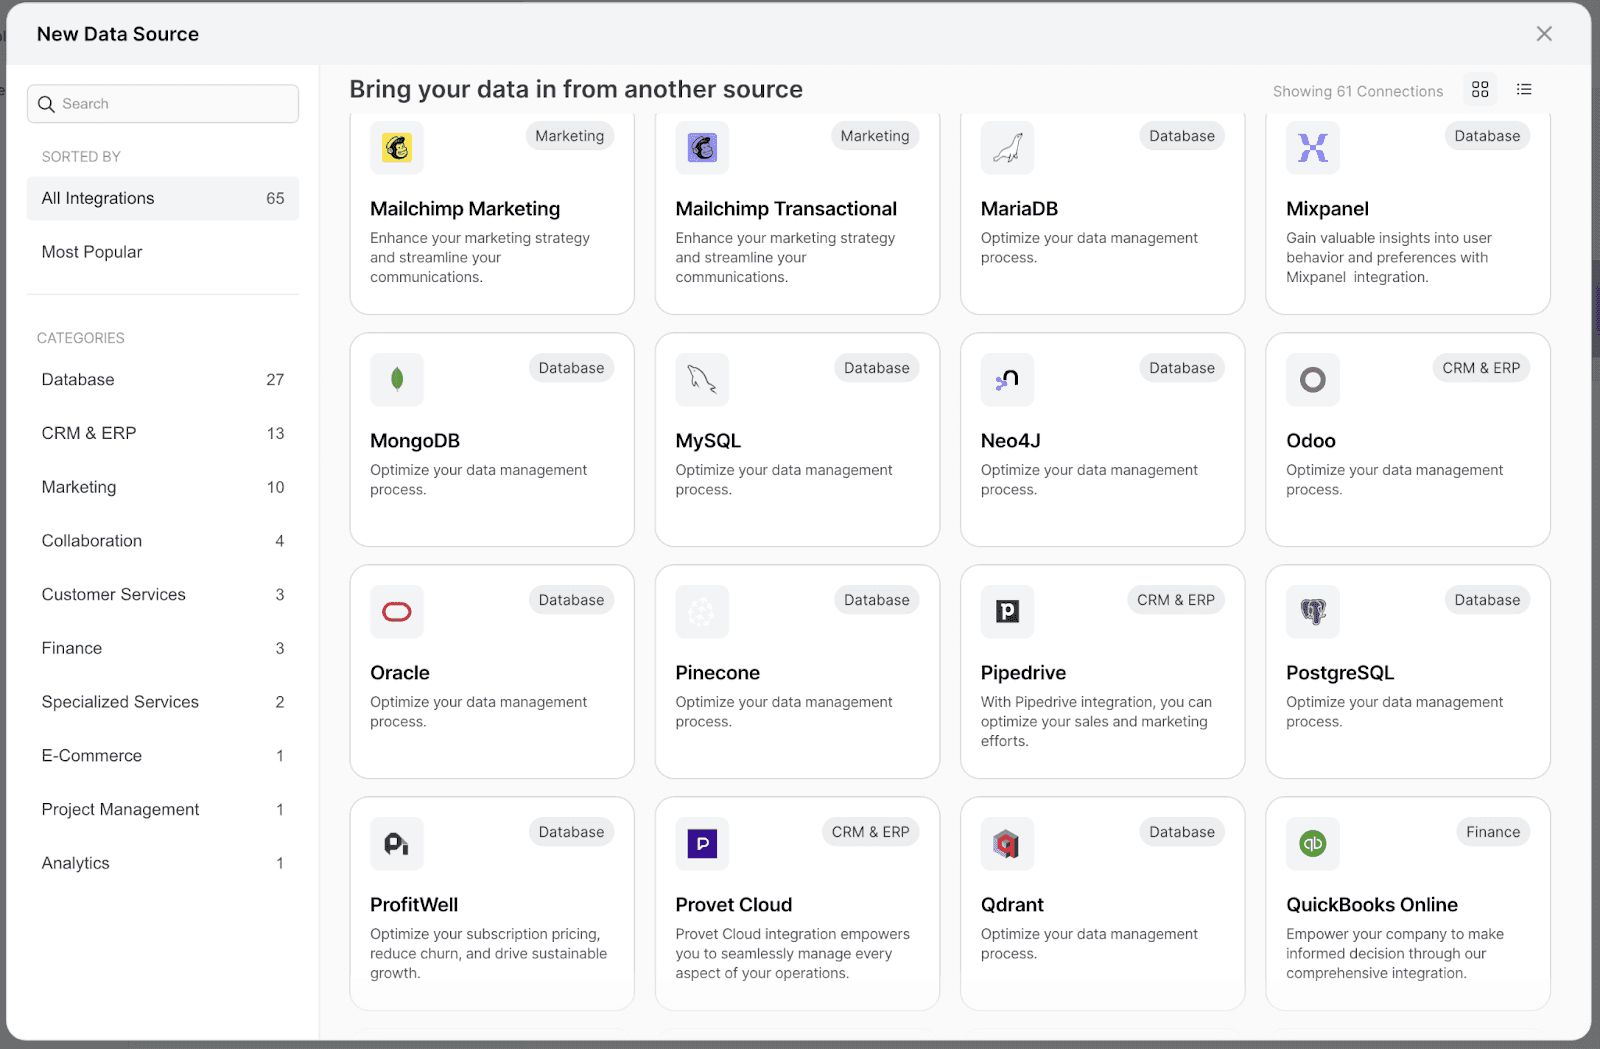
Easy Data Integration: Quickly connects to databases like MySQL, PostgreSQL, and Snowflake.
User-Friendly Customization: Users customize dashboards effortlessly without needing technical help.
Fast Performance: Dashboards load quickly even with large datasets.
Pros of Upsolve AI

Simple, fast setup without coding.
Dashboards match your brand easily.
Reliable performance with big datasets.
AI makes dashboard creation effortless.
Cons of Upsolve AI
Advanced integrations initially require setup help.
The smallest teams may want to start on the free tier before moving to a paid plan ($500/month).
Upsolve AI Pricing
Upsolve AI offers a free plan plus three paid tiers; embedding and multi-tenant analytics start on the Team plan ($2,000/mo).
Free ($0): 2,000 one-time credits (~200 questions); all Pro features, to test-drive
Pro ($500/mo): 2,000 credits/month; 50+ data connections, unlimited agents, full observability
Team ($2,000/mo): 10,000 credits/month; adds embedding, RBAC/row-level security, multi-tenant, and semantic-layer generation
Enterprise (custom): on-prem/VPC, SAML SSO, HIPAA, SOC 2, and BYOM
Annual billing is 20% off.
If you want an embedded, customer-facing dashboard tool with a faster setup than Grafana, Upsolve AI is worth evaluating.
So, we know what Upsolve AI can do better, but is it really better than Grafana? Let’s quickly compare:
Feature | Grafana | Upsolve.ai |
Dashboard Speed | Slower, manual dashboard creation | Instant dashboards using AI |
Setup Time | Complex and technical | Fast, no-code setup |
Pricing | Free core, extras cost more | Free tier + paid plans from $500/mo (Team $2,000/mo for embedding); usage-based credits |
AI Features | None | Built-in AI for charts and reports |
Ease of Use | Steep learning curve | Beginner-friendly, plug-and-play |
Best Features | Plugins and time-series monitoring | Embedding, customization, AI tools |
✅ Overall Rating: 4.8/5
So, that wraps up our list of the 10 best Grafana alternatives you can consider.
How to Pick the Right Grafana Alternative?
Choosing the right Grafana alternative isn’t just about picking what’s popular. It’s about finding the one that actually fits your team, your data, and your goals.
Here’s what you need to look for, or risk wasting time and money:
Ease of Use:
If it’s not intuitive, your team won’t use it. Look for something even non-tech users can figure out fast.Integration Capabilities:
Your data lives everywhere, MySQL, PostgreSQL, cloud apps. Your dashboard tool should connect without needing a developer every time.Scalability:
A good setup today should still work when you have 10x the users and 100x the data. Don't pick something you’ll outgrow in a year.Customizability:
Your dashboards should fit your business, not the other way around. Look for drag-and-drop freedom and deep visual tweaks.Cost-Effectiveness:
Big promises mean nothing if the price tag doesn’t match your real-world needs. Make sure what you pay for moves the needle.
Bottom line:
If you skip these checks, you’re not choosing a Grafana alternative, you’re choosing your next set of problems.
What’s the Best Grafana Alternative for You?
Choosing the best data visualization tool isn’t about picking what’s popular. It’s about finding what actually fits your team and gets you results.
Here’s a quick breakdown:
Use Upsolve.ai if you want to build dashboards fast with AI, perfect for customer-facing analytics.
Pick Power BI if you’re a beginner and want something easy and budget-friendly.
Go with Tableau if you need deep analysis and visual storytelling that makes your data pop.
Choose Looker if your team is already on Google Cloud and needs embedded analytics at scale.
Bottom line:
The right tool doesn’t just make your dashboards prettier. It makes your decisions faster and your team smarter.
FAQs:
1. What’s the best free Grafana alternative?
If you’re looking for free, start with Prometheus, Kibana, or Metabase (self-hosted). They’re open-source, powerful, and cover most basic needs.
2. Which tool is easiest to set up for non-technical users?
Upsolve.ai, Power BI, and Metabase Cloud are great for teams without engineers. They offer drag-and-drop dashboards and don’t need custom code.
3. Do any alternatives support real-time metrics and alerts?
Yes. Datadog, Splunk, and Prometheus all support real-time data monitoring with built-in alerting and anomaly detection features.
4. What’s the best alternative for embedding dashboards into a SaaS app?
Go with Upsolve.ai, Looker, or Metabase Pro. They let you embed dashboards directly into your product with full control over design and access.
5. Which is better for system monitoring, Grafana or its alternatives?
Grafana works great with Prometheus, but Datadog, Zabbix, and Splunk offer more complete monitoring with less setup pain.

Try Upsolve for Embedded Dashboards & AI Insights
Embed dashboards and AI insights directly into your product, with no heavy engineering required.
Fast setup
Built for SaaS products
30‑day free trial


