
Learn how to build an AI analytics dashboard in minutes without code, using real examples, step-by-step setup, and a tool designed for fast deployment.

Ka Ling Wu
Co-Founder & CEO, Upsolve AI
10 min

Disclosure: This article is published by Upsolve AI. Where our product is mentioned alongside competitors, we aim to provide balanced coverage based on publicly available information. We encourage readers to evaluate all options independently.
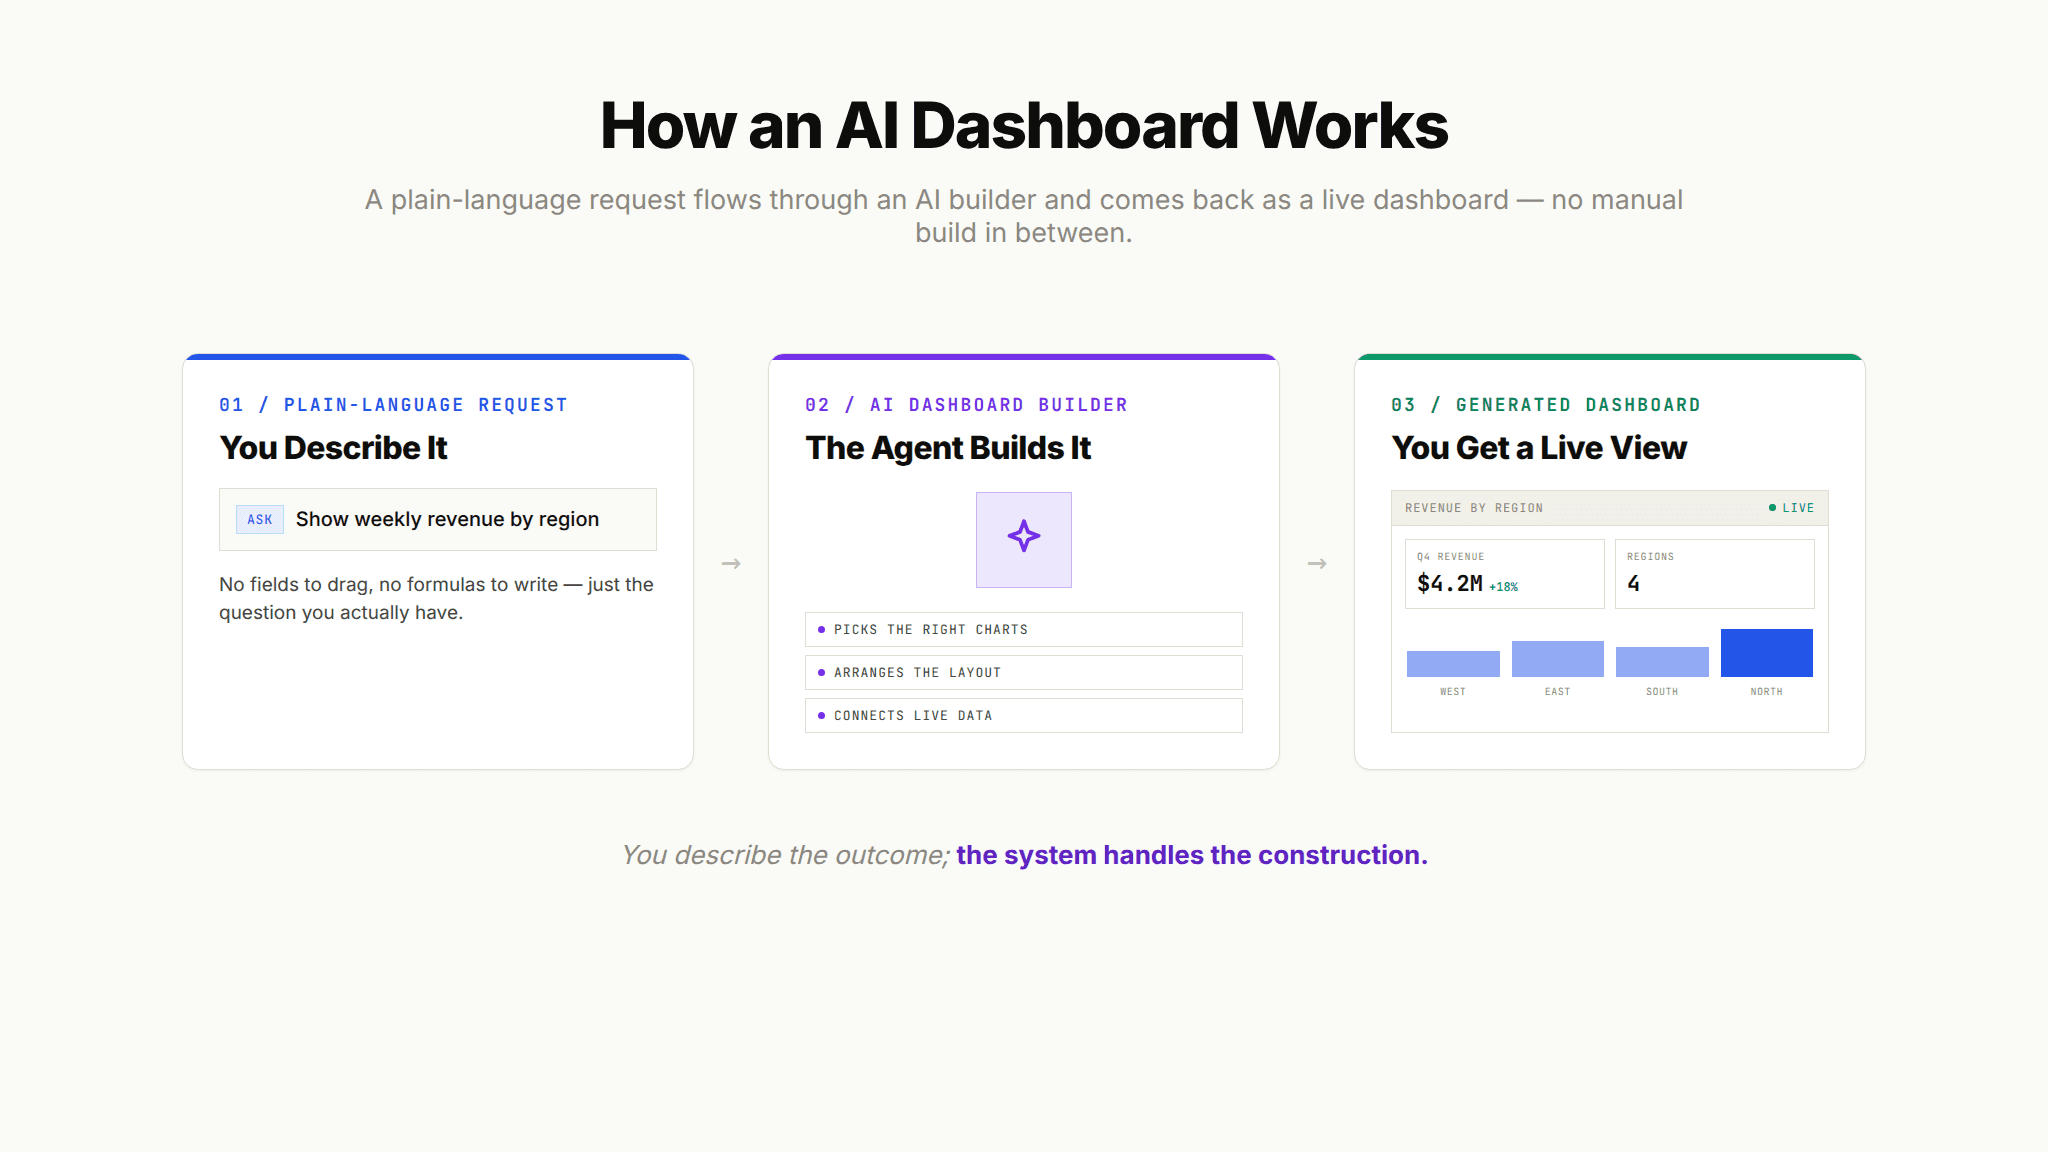
To build an AI dashboard without writing code, you connect your data source, let the tool generate a first layout for you, then describe the views you want in plain language and refine from there. That last part is what separates a modern AI dashboard from a traditional one: instead of dragging fields onto a canvas, you tell the system what you want to see and it builds the charts, arranges the layout, and keeps everything current as new data lands.
This guide walks through the practical steps, the tools that make it possible, and the one distinction that matters most today: the difference between a dashboard that AI helped you assemble once and an agent-driven dashboard that keeps answering the questions you did not think to pre-build.
Key Takeaways |
|---|
|
What Is an AI Dashboard?
An AI dashboard is a data dashboard that uses artificial intelligence to generate, populate, and update its visualizations, often from natural language input rather than manual configuration. Instead of building each chart by hand, you describe what you want to measure, and the system proposes the layout, selects the right chart types, and connects to your live data so the numbers stay current.
That definition covers a wide range of products, and the range matters. On one end, "AI" means a copilot bolted onto a traditional BI tool that helps you write a formula faster. On the other, it means an autonomous agent that assembles an entire dashboard from a sentence and then answers follow-up questions about it. Both get marketed as an AI dashboard. They are not the same thing, and the gap between them determines whether your dashboard stays useful after week one.
For clarity, this article is about full dashboards: the layout, the data connections, the refresh behavior, and the deployment. It is not a deep dive into how AI generates individual charts. If you want the chart-level mechanics, our guide to AI data visualization techniques covers how models turn a question into a specific visual. Here, we stay at the dashboard level.
AI Dashboard vs Traditional Dashboard
A traditional dashboard is a finished artifact. Someone gathered requirements, chose the metrics, built the charts, and shipped it. It shows what it was designed to show, and nothing else. When a new question comes up, the dashboard cannot answer it; a person has to go build the answer.
An AI dashboard shifts the work. The person describes the outcome, and the system handles the construction. The most capable versions go further: they let anyone ask a new question against the same data and get a fresh view without filing a request. This is why the category is growing so quickly, and why "AI dashboard generator" and "AI dashboard builder" have become common searches. People are looking for the shortcut past the manual build.
Why Traditional Dashboards Hit a Wall
Before you build anything, it helps to understand why the old approach frustrates so many teams. The numbers here are not flattering, and they explain the demand for something better.
Adoption is the first problem. Research from BARC has consistently found that BI and analytics adoption rates sit around 25% on average, a figure that has barely moved in years. In practice, that means a company can spend six figures on licenses and still have most of its people ignoring the dashboards entirely.
Complexity is the second. A Dresner Advisory survey found that nearly 70% of users stick to less than 10% of a BI tool's functionality, usually out of confusion or fear of getting it wrong. The tools promise self-service, but the interface asks for skills most business users never acquire.
The core issue: Traditional dashboards answer questions someone anticipated in advance. They fail at the questions nobody planned for, which are usually the questions that actually drive a decision.
Then there is the follow-up problem, and this is the one that matters most. Real analysis is a conversation. You see a number, you ask why, you get an answer, and that answer raises a new question. Static dashboards cannot hold that conversation. As one analysis of the "dashboard delusion" put it, every follow-up means starting over or filing a new request, and analytics teams spend 40 to 60% of their time handling these ad-hoc requests. You wait three days, realize the answer leads to more questions, submit another request, and wait again.
The result is predictable. Dashboards proliferate, most go stale, and a large share end up in the dashboard graveyard, built, launched, and then quietly abandoned. AI dashboards are compelling precisely because they attack these three failures directly: they lower the skill barrier, they handle the follow-up, and they reduce the manual build work that clogs the queue.
What You Need Before You Build
You do not need an engineering team to build an AI dashboard, but you do need a few things in place. Think of this as your checklist before you start.
A Connected Data Source
Your dashboard is only as good as the data behind it. Most no-code AI dashboard tools connect directly to a warehouse (Snowflake, BigQuery, Databricks, Redshift), a database, a spreadsheet, or an uploaded CSV for lighter use cases. The cleaner and more organized this source, the better your results. AI does not fix messy data; it visualizes whatever it finds, accurately or not.
A No-Code AI Dashboard Tool
This is the builder itself. The market splits roughly into three groups, which we cover in detail below: AI-native builders that generate a dashboard from a prompt, traditional BI platforms that have added AI copilots, and agent-driven platforms built around a context layer. Your choice shapes everything else, so it is worth understanding the categories before committing.
Clear Metric Definitions
Here is the step most people skip, and it is the one that causes the most pain later. If your organization has never agreed on what "revenue" or "active user" or "churn" actually means, an AI tool will guess, and different people will get different numbers. As one enterprise analysis noted, undefined data definitions create a "Tower of Babel" effect where every user builds their own logic. Nailing down these definitions before you build is the single highest-leverage thing you can do.
Pro tip: Write down your ten most-requested metrics and their exact definitions before you touch a dashboard tool. This becomes the backbone of every accurate AI dashboard you build later.
How to Build an AI Dashboard Without Code: Step by Step
With your data connected and your metrics defined, the build itself is straightforward. Here is the process that works across most modern AI dashboard builders.
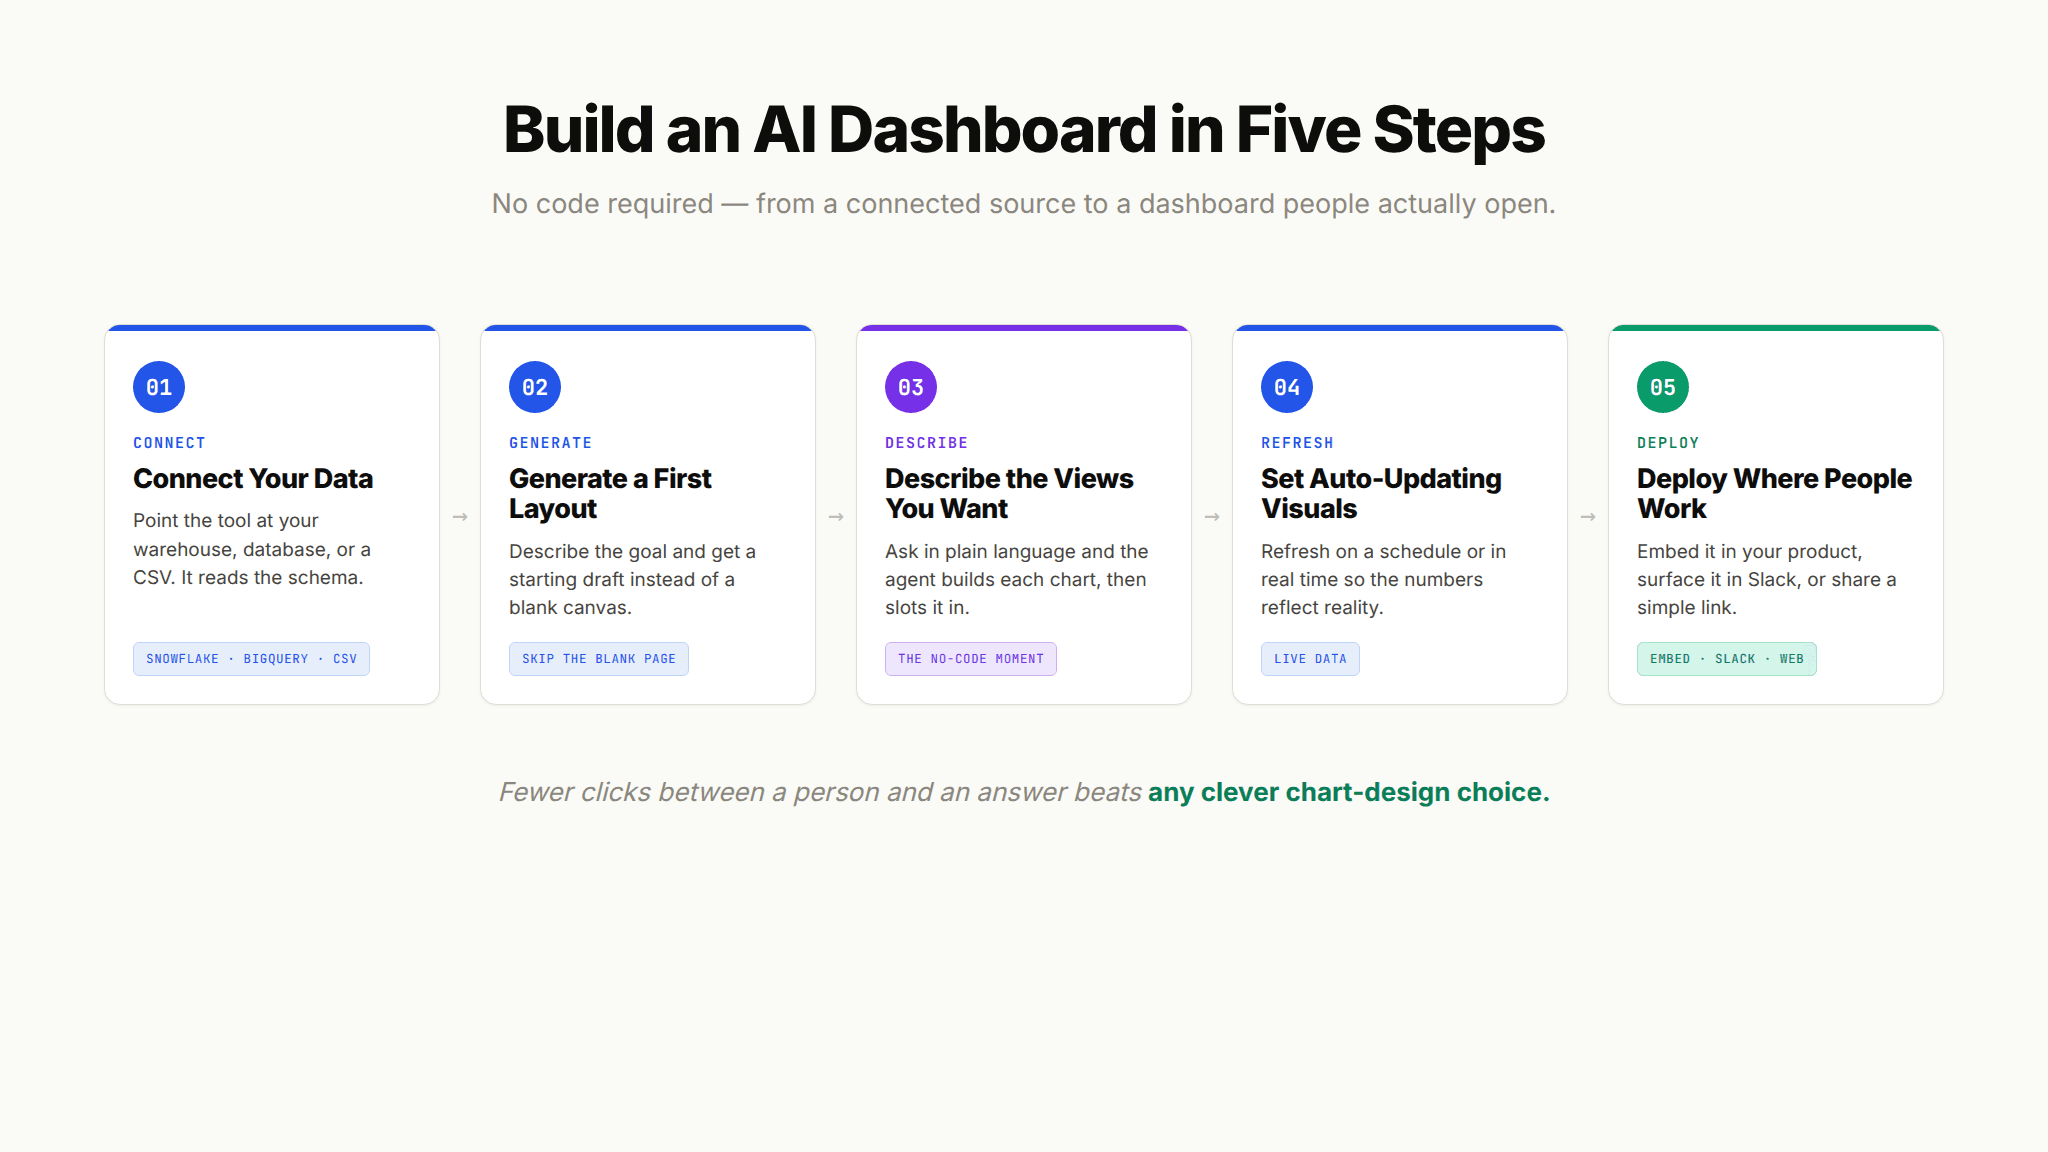
Step 1: Connect Your Data
Point the tool at your source. Most no-code platforms offer native connectors, so this is usually a matter of authenticating and selecting the tables or datasets you care about. The tool reads your schema, the structure of your tables and how they relate, so it knows what data exists.
Step 2: Let AI Generate a First Layout
Rather than starting from a blank canvas, describe what the dashboard is for. Something like "a weekly sales overview for regional managers" is enough for a capable AI dashboard generator to propose a starting layout with relevant metrics, sensible chart types, and a logical arrangement. This first draft is rarely perfect, but it saves you from the hardest part of any dashboard project: the blank page.
Step 3: Describe the Views You Want
This is where the "without code" promise becomes real. Instead of manually configuring each visual, you tell the system what you want in plain language. "Show me revenue by product line for the last four quarters." "Add a chart comparing new versus returning customers by month." The agent builds each view and slots it into the layout. This is the experience people mean when they talk about being able to talk to your data and get a working dashboard back.
Step 4: Set Up Auto-Updating Visualizations
A dashboard that shows last month's numbers is worse than no dashboard, because it invites wrong decisions. Configure your visualizations to refresh on a schedule or in real time, depending on the decision they support. Modern tools handle this connection to live data automatically once you set the cadence, so the dashboard reflects reality without anyone exporting a new file.
Step 5: Deploy Where People Actually Work
The best dashboard nobody opens is still a failure. One recurring lesson from BI research is that dashboards fail when they are separate from where work actually happens. Deploy your AI dashboard where your team already spends time: embedded in your product, surfaced in Slack or Microsoft Teams, or accessible through a web link that requires no training to use. Reducing the number of clicks between a person and an answer does more for adoption than any chart-design choice.
Pro tip: When a new AI dashboard goes live, retire the manual report or spreadsheet it replaces. If the old version stays available, people default to what is familiar, and your dashboard quietly joins the graveyard.
Traditional vs Agent-Driven Dashboards
Everything above works with a wide range of tools. But there is a meaningful line running through the category, and understanding it will save you from buying something that solves last year's problem. The line is between AI-assisted dashboards and agent-driven dashboards.
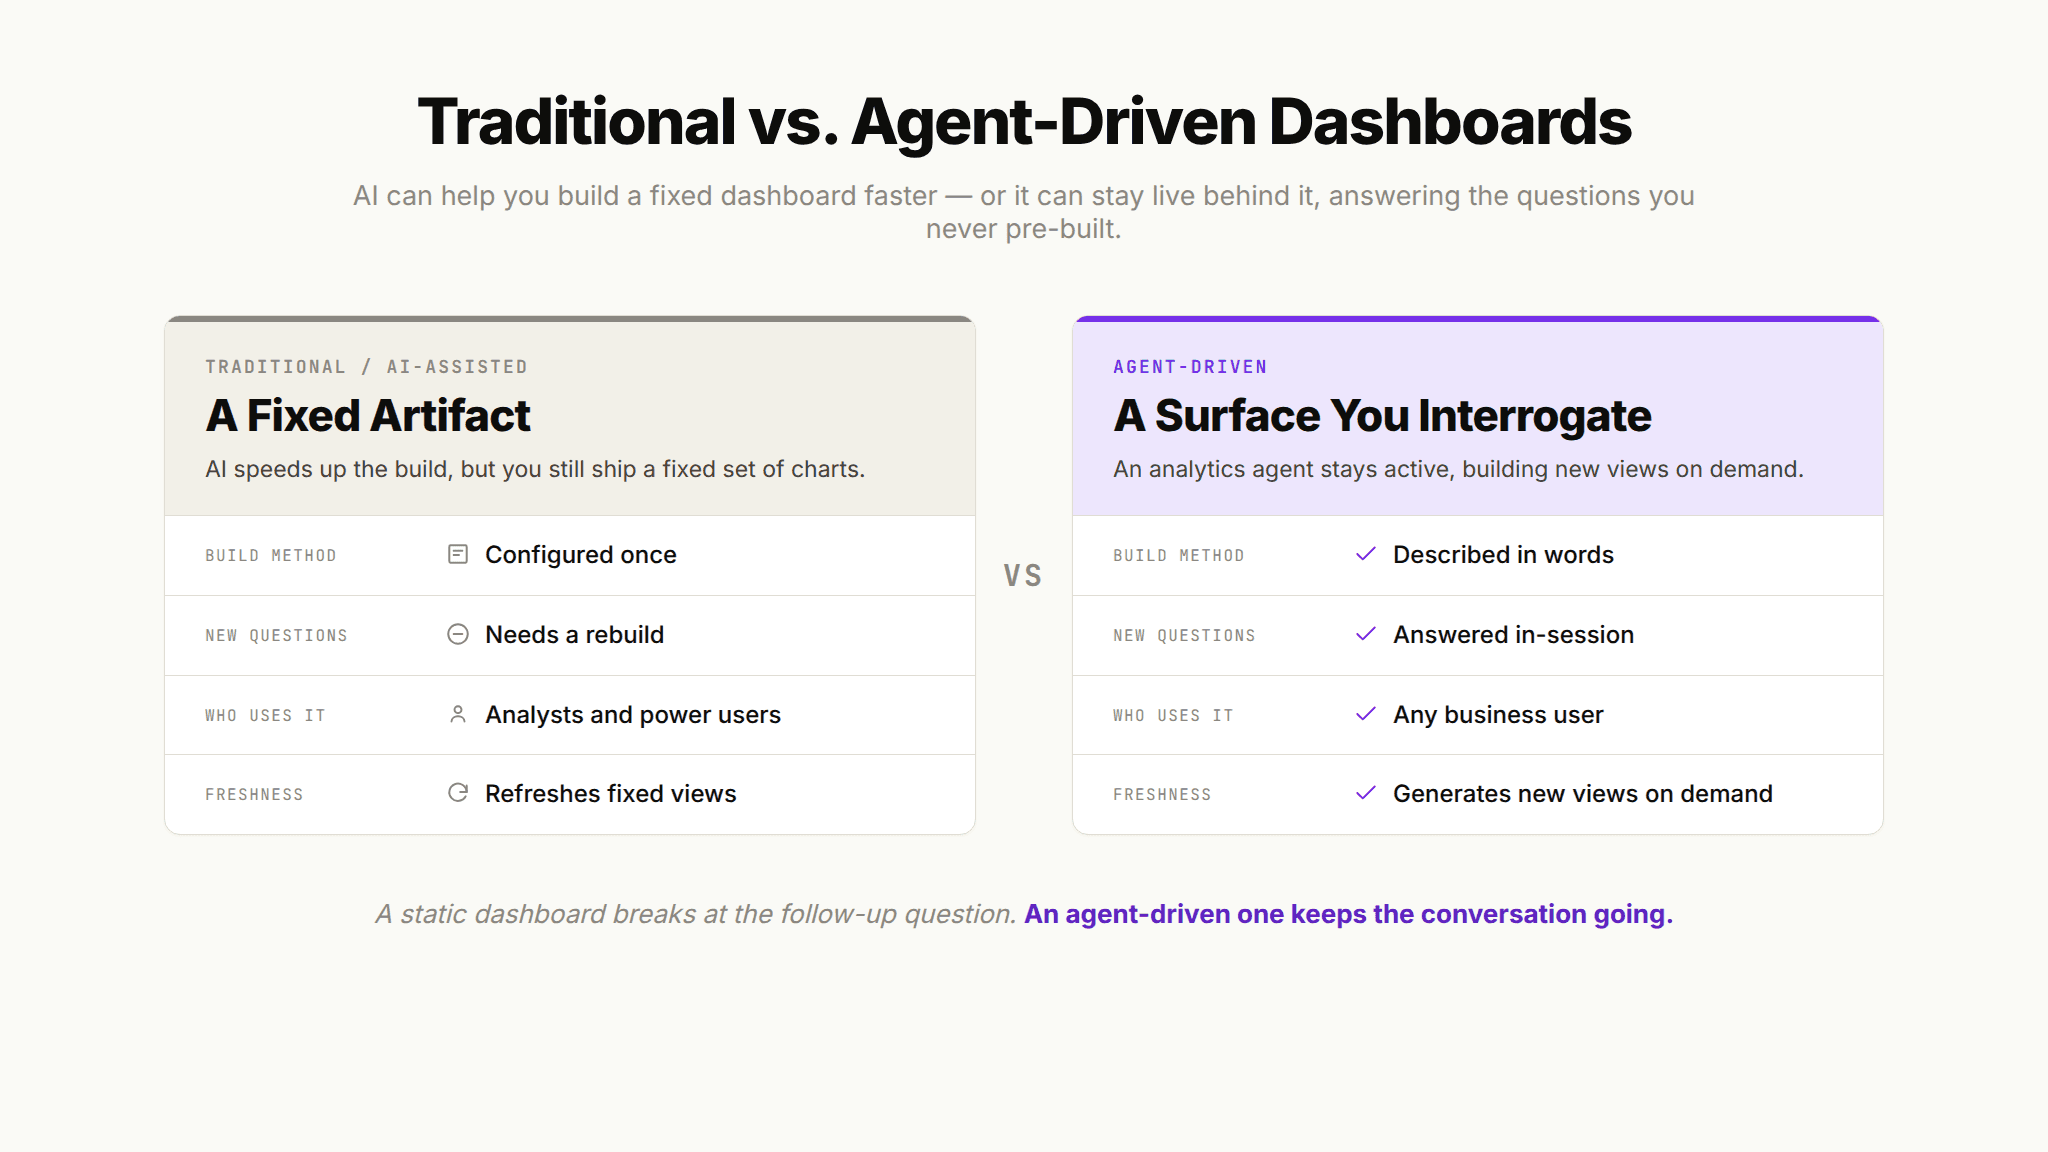
An AI-assisted dashboard uses AI to speed up the build. You still end up with a fixed set of charts; AI just helped you make them faster. An agent-driven dashboard is different. It keeps an analytics agent active behind the dashboard so that when a user asks a question the dashboard was not designed to answer, the agent generates the answer on the spot. The dashboard stops being a static artifact and becomes a surface you can interrogate.
Dimension | Traditional / AI-Assisted Dashboard | Agent-Driven Dashboard |
|---|---|---|
How it is built | Charts configured once, by hand or with AI help | User describes what they want; agent builds it |
Handling new questions | Requires a new build or a request | Agent answers follow-ups in the same session |
Who can use it | Analysts and trained power users | Any business user, in plain language |
Freshness | Refreshes the pre-built views | Refreshes and generates new views on demand |
Failure mode | Goes stale, ends up unused | Depends on the quality of its context |
This shift is not hypothetical. The major platforms are all moving this direction: Databricks has been rolling out natural-language dashboard authoring and agentic analytics where agents help users build and explore end to end, and Google's Looker now ships Dashboard Agents that embed conversational experiences directly into dashboards. The end product everyone is chasing is the same: a dashboard where users describe the charts they want and the agent builds them.
If you want the full picture of how this agent-driven model reshapes analytics beyond dashboards, our guide on how agent-driven dashboards differ from traditional ones walks through the broader paradigm shift.
Why the Context Layer Decides Everything
Here is the catch that most "build an AI dashboard" guides skip. An agent-driven dashboard is only as trustworthy as the context the agent can draw on. Give an agent access to your raw tables and nothing else, and it will produce confident, well-formatted, wrong answers, because it does not know that "revenue" at your company means recognized revenue, not bookings, or that one of your tables was deprecated last year.
This is the finding behind a growing body of work on why AI analytics fails in production. As a16z argued in its analysis of the space, data and analytics agents are essentially useless without the right context. OpenAI reached a similar conclusion building its own internal data agent, noting that high-quality answers depend on rich, accurate context. The lesson generalizes: the model is rarely the bottleneck. The missing institutional knowledge is.
Key insight: A dashboard you can talk to is only as trustworthy as the context behind it. Without your metric definitions and business rules, an agent will format a wrong answer beautifully and hand it to you with total confidence.
Upsolve frames this as a three-layer context architecture that any reliable analytics agent needs. Structure covers what data exists, the schemas, tables, and how they connect. Meaning covers what the data means at your specific company, the metric definitions and business rules. Trust covers which answers have been validated. An agent-driven dashboard that only has Structure will look impressive in a demo and break with real users. This is worth keeping in mind when you evaluate any tool that promises a dashboard you can simply talk to.

AI Dashboard Tools: The Categories to Know
There are dozens of AI dashboard builders, and the list changes monthly. Rather than rank them, which would be stale by the time you read it, it is more useful to understand the categories. Most tools fall into one of three, and independent reviewers group the market along similar lines.
1. AI-Native Dashboard Generators
These tools generate a dashboard from a prompt. You do not design it by hand; you describe it and refine. They are fast to start with and appealing for teams without a dedicated analyst. The trade-off is that governance and context depth vary widely, so accuracy on nuanced business questions depends heavily on the specific product.
2. Traditional BI With AI Added
The established platforms have layered AI on top of mature BI suites. Microsoft's Power BI Copilot translates plain-language requests into measures and summaries, Tableau added conversational agents and metric monitoring, and Looker embeds Gemini across its stack. These are strong when you already run governed dashboards and want AI to accelerate existing workflows. The setup is heavier, and the AI is generally better at summarizing existing dashboards than answering genuinely new questions.
3. Agent-Driven Platforms Built on a Context Layer
This newer category treats the analytics agent, and the context it needs, as the core product rather than a feature. Warehouse-native options like Databricks Genie work well when all your data already lives in one place. Context-infrastructure platforms take a multi-source approach: Upsolve is one option here, positioning its Agent Studio around encoding institutional knowledge across the three context layers so business users can describe the dashboards they want and get trustworthy answers back. Cube, ThoughtSpot's Spotter, and Hex sit in this broader space as well, each with different strengths around semantic modeling, embedded deployment, and workflow.
No category is universally best. A small team that wants a quick dashboard from a prompt has different needs than an enterprise standardizing on governed metrics, which has different needs again from a product team embedding analytics for customers. Match the tool to the problem, and weigh how seriously each one treats context, because that is what determines whether the dashboard survives contact with real users.
What Sends an AI Dashboard to the Graveyard
Even with the right tool, a handful of failure patterns show up again and again. Steering around them is most of the battle.
Building for the Data You Have, Not the Decision You Need
The most common and most damaging pattern is building a dashboard because you have data, not because someone needs to make a decision. It usually goes like this: a new data source appears, someone says "we should visualize this," and a dashboard emerges that shows numbers nobody acts on.
How to avoid it: Start every dashboard by naming the specific decision it supports and who makes it. If you cannot name the decision, do not build the dashboard.
Leaving Your Core Metrics Undefined
When finance, sales, and executives each carry their own definition of a core metric, the dashboard becomes a battleground rather than a source of truth. AI makes this worse, not better, because it will confidently generate whichever definition it infers from the raw tables.
How to avoid it: Agree on definitions before you build, and document them alongside the dashboard so anyone can verify how a number was calculated.
Treating the Dashboard as a Project, Not a Product
A dashboard launched and forgotten drifts out of relevance within a quarter, because business priorities shift while the dashboard stays frozen. This is a big reason so many static dashboards end up abandoned.
How to avoid it: Treat the dashboard as a living product. Agent-driven dashboards help here, since users can ask new questions without a rebuild, but even then, review usage and prune what nobody opens.
Ignoring Who Is Allowed to See What
A dashboard that lets anyone ask anything can expose data people should not see. In regulated industries, that is not a nuisance, it is a compliance risk.
How to avoid it: Choose tools that enforce your existing permissions on every generated view, so the agent operates within your security model rather than around it.
Building AI Dashboards for Your Customers
So far this has been about internal dashboards. But a large and growing use case is customer-facing: SaaS products embedding an AI dashboard so their users can analyze their own data inside the product.
The building blocks are the same, but the stakes are higher. Your customers are not trained analysts, the data is multi-tenant so each customer must see only their own, and a wrong number damages your product's credibility, not just an internal meeting. This is where the context and Trust layers become non-negotiable, and where the deployment model (embedded SDK, white-label interface) matters as much as the dashboard itself.
Bottom line: For customer-facing dashboards, the question is not "can it draw a chart?" It is "can it enforce which customer sees which data, and can it be trusted to answer correctly every time?"
If embedding analytics for your customers is your actual goal, the shift from static embedded charts to embedded agents deserves its own treatment. Our guide on how to embed dashboards for your customers covers the architecture and the customer-experience considerations in depth.
For the broader landscape of how AI is changing every stage of the analytics workflow, from data prep to dashboards to agent-driven analysis, our complete guide to AI for data analysis is the place to start.
The Harder Part Comes After Launch
Building an AI dashboard without code is genuinely achievable today, and for many teams a quick no-code generator or an AI copilot on their existing BI tool is enough to get started. The harder question is what happens after launch, when real users start asking questions you did not pre-build.
That is the problem the agent-driven, context-first approach is designed to solve. If you want to see how an agentic dashboard handles the follow-up questions and the metric definitions that trip up traditional tools, explore how Upsolve's Agent Studio approaches context infrastructure or start by uploading a CSV and asking your data a question directly.
Frequently Asked Questions
What is an AI dashboard?
An AI dashboard is a data dashboard that uses artificial intelligence to generate, populate, and update its visualizations, often from plain-language input instead of manual configuration. The most advanced versions let users ask new questions and get fresh views on demand, rather than only showing pre-built charts.
Can I build an AI dashboard without any coding?
Yes. Most modern AI dashboard builders are fully no-code. You connect a data source, describe what you want in natural language, and the tool generates the charts and layout. No-code and low-code adoption has become mainstream, with around 77% of enterprises now using these tools, largely because they remove the technical barrier.
How much does an AI dashboard tool cost?
Pricing ranges widely, from free tiers on some AI-native generators to per-seat or usage-based pricing on enterprise platforms, and custom pricing for agent-driven and embedded solutions. The bigger cost driver is usually setup and data preparation, not the license itself, so factor in the work of connecting sources and defining metrics.
What is the difference between an AI dashboard and an agent-driven dashboard?
An AI dashboard uses AI to help build fixed visualizations faster. An agent-driven dashboard keeps an analytics agent active behind the scenes, so users can ask questions the dashboard was never designed for and get answers generated on the spot. The agent-driven model handles follow-up questions in the same session, which is where traditional dashboards break down.
Why do so many dashboards go unused?
Because they answer only the questions someone anticipated in advance, and they cannot handle the follow-ups that drive real decisions. Research shows only about 45% of people with BI access actually use the tools, and many built dashboards are never opened again after launch. Agent-driven approaches address this by making the dashboard interactive rather than static.
Do AI dashboards give accurate answers?
They can, but accuracy depends far more on context than on the AI model. Without knowing your metric definitions, table lineage, and which answers are validated, an agent produces confident but unreliable results. This is why the context an agent can draw on, not the model behind it, is the most important thing to evaluate in any AI dashboard tool.

Try Upsolve for Embedded Dashboards & AI Insights
Embed dashboards and AI insights directly into your product, with no heavy engineering required.
Fast setup
Built for SaaS products
30‑day free trial


