
Compare Looker and Power BI across features, pricing, scalability, ease of use, and use cases to decide which BI tool fits your business needs.

Ka Ling Wu
Co-Founder & CEO, Upsolve AI
10 min

Disclosure: This article is published by Upsolve AI. Where our product is mentioned alongside competitors, we aim to provide balanced coverage based on publicly available information. We encourage readers to evaluate all options independently.
Business Intelligence (BI) tools exist to turn raw data into decisions people can act on, and the demand for answers in real time has only grown.
Looker and Power BI are two of the most widely deployed options, but they were built for different buyers and they show it. Looker asks a data team to model the business first. Power BI hands a business user a canvas and gets out of the way.
This comparison covers features, pricing, ease of use, and the trade-offs each one carries, so you can tell which fits the team you actually have.
Looker vs Power BI: Quick Comparison Table
To help you quickly understand the key differences between Looker and Power BI, here’s a side-by-side comparison of their core features, pricing, and ideal use cases.
Aspect | Looker | Power BI |
|---|---|---|
Pricing | Platform fee plus per-user licensing, published by edition on Google Cloud | Free tier; Pro at $14 per user/month, Premium Per User at $24 per user/month, both paid yearly |
Ease of Use | Report consumption is straightforward; building models requires SQL and LookML | Drag-and-drop authoring accessible to non-technical users |
Features | Governed data modeling via LookML, strong API support, embedded analytics | Broad visualization library, AI-assisted insights, native Microsoft integration |
Integrations | Strongest against cloud warehouses (BigQuery, Snowflake, Redshift); connects to on-premise databases via JDBC | Deepest with Microsoft products (Excel, Azure, SQL Server); wide connector range beyond them |
Best For | Teams with SQL expertise that want consistent, governed definitions across the business | Organizations already standardized on Microsoft, and teams that need reporting fast |
Looker suits teams willing to invest in a modeling layer for consistency. Power BI suits teams that want reporting running this week.
What Is Looker?
Looker is a cloud-based business intelligence (BI) platform acquired by Google Cloud in 2020.
It enables businesses to explore, analyze, and share data efficiently, helping them make better, data-driven decisions.
Built for organizations that need scalable, real-time analytics, Looker leans on advanced data modeling to keep definitions consistent across teams.
Unlike other BI tools, Looker uses LookML, a proprietary modeling language that allows analysts to define data relationships and calculations before visualization.
This structured approach ensures reliable and standardized reporting across teams.
Pros of Looker:
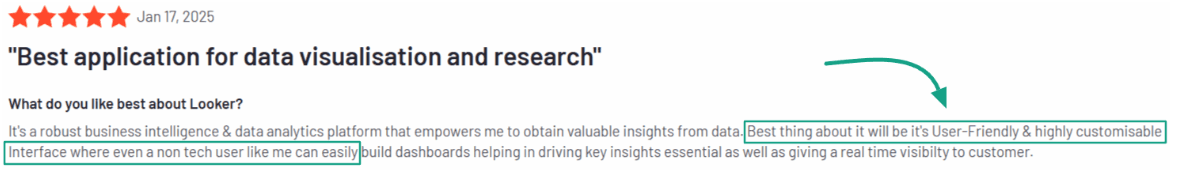
The consumption experience is clean. Once models are built, browsing reports and dashboards is straightforward for non-technical users.
Dashboards are interactive and customizable, and can be tailored per team or per role.
Connects to a wide range of data sources, with the strongest performance against cloud warehouses.
Cons of Looker:
Steep learning curve, particularly LookML. Building and maintaining models is a job for someone comfortable with SQL, not a business user.
Performance depends heavily on the underlying warehouse. Looker pushes queries down to your database, so slow results usually trace back to warehouse tuning rather than Looker itself.
What Is Power BI?
Power BI is a business intelligence (BI) tool developed by Microsoft that allows businesses to analyze, visualize, and share data through interactive dashboards and reports.
Its drag-and-drop interface makes data analysis accessible to technical and non-technical users alike.
As part of the Microsoft ecosystem, it integrates seamlessly with Excel, Azure, and SQL Server, making it a preferred choice for businesses.
It also supports cloud and on-premise deployment, making it flexible for organizations to store and process their data.
Pros of Power BI:
Pricing starts free, with published per-user rates that are straightforward to budget against.
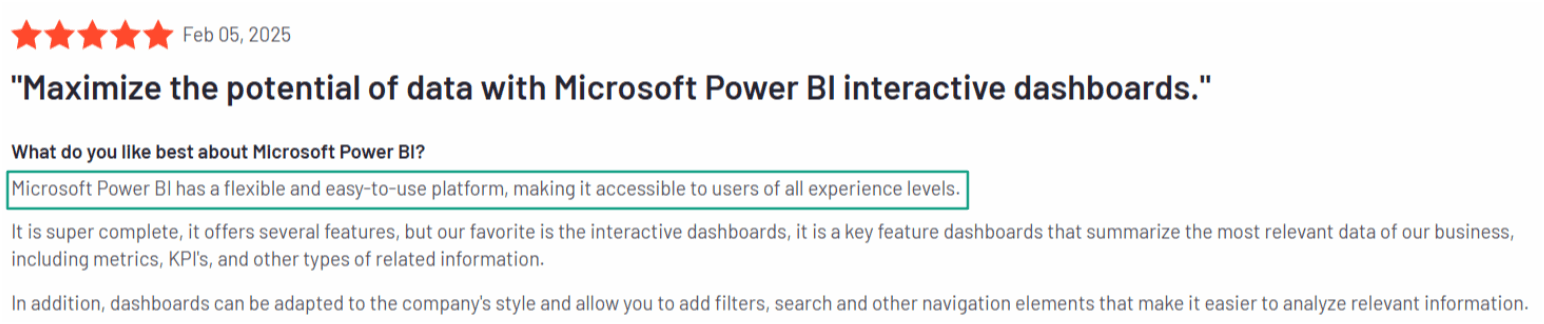
The drag-and-drop interface makes report building quick, even without technical training.
Strong visualization capabilities across a wide range of chart types.
Native integration with other Microsoft products, which removes setup friction for teams already using them.
Cons of Power BI:

Limited customization in visuals compared to other BI tools.
Performance issues when handling extremely large datasets.
Looker vs Power BI: Detailed Feature Comparison
When choosing between Looker and Power BI, it's essential to compare their key features. While both are powerful BI tools, they differ in ease of use, data integration, customization, pricing, and scalability.
Below, we break down these differences to help you make the right choice.
1. Ease of Use
Looker splits cleanly in two. Reading and exploring existing reports is approachable for anyone. Building the models underneath requires SQL and LookML, which puts authoring in the hands of a data team.
Power BI collapses that distinction. The drag-and-drop interface lets the same person who reads the report also build it, with no modeling language in between.
Verdict: Power BI gets a non-technical user productive faster. Looker trades that for definitions that stay consistent no matter who asks the question.
2. Data Integration & Connectivity
Looker performs best against cloud warehouses such as BigQuery, Snowflake, and Redshift. It connects to on-premise databases over JDBC, though Looker itself is hosted, so network and latency planning matters.
Power BI offers extensive data source connectivity across cloud, on-premise, and Microsoft SQL Server, and is the natural fit for organizations already inside Microsoft's ecosystem.
Verdict: Power BI covers more source types out of the box. Looker is the stronger choice when your data already lives in a cloud warehouse.
3. Customization & Flexibility
Looker puts customization in the model layer. LookML lets you define a metric once and have it behave consistently everywhere, at the cost of needing someone to write and maintain it.
Power BI puts customization in the visual layer. You get considerable control over how a report looks and behaves, and much less over how the underlying data is defined.
Verdict: Looker if you need one definition of a metric across the whole company. Power BI if you need a specific report to look and work a particular way.
4. Pricing & Licensing
Looker pricing has two components: a platform fee to run your Looker instance, and per-user licensing that varies by user type. Google Cloud offers three platform editions: Standard (for organizations under 50 users), Enterprise (adds security features for wider internal deployment), and Embed (for external-facing analytics at scale). Each includes one production instance, 10 Standard Users, and 2 Developer Users, with per-edition API call limits. Current figures are published on Google Cloud's Looker pricing page.
You can read here about the detailed Looker pricing breakdown.
Power BI publishes list pricing directly. A free account is available. Power BI Pro is $14 per user/month, paid yearly, and covers publishing and sharing reports; it is also included in Microsoft 365 E5 and Office 365 E5. Power BI Premium Per User is $24 per user/month, paid yearly, adding larger model sizes and more frequent refreshes. Power BI Embedded is variable and quoted separately for customer-facing deployments.
Verdict: Power BI has the lower and more predictable entry cost, and you can model it before contacting anyone. Looker's platform-plus-user structure means total cost depends on your edition and user mix, so budget for a pricing conversation.
5. Scalability & Performance
Looker delegates query execution to your warehouse, so it scales with whatever sits underneath it. Large deployments perform well, but getting there usually requires someone who can tune both the models and the warehouse.
Power BI handles small and mid-sized datasets comfortably. Very large models can hit performance limits on lower tiers, which is part of what Premium and Fabric capacity are sold to address.
Verdict: Looker's ceiling is your warehouse's ceiling, which is an advantage if that warehouse is already well-tuned. Power BI's ceiling is tied to licensing tier, so scale is a budget question more than an architecture one.
Both Looker and Power BI have their advantages and limitations, but the right choice depends entirely on your needs and intended use.
Now, let’s explore the scenarios where Looker or Power BI would be the better fit.
When to Choose Looker or Power BI?
Both Looker and Power BI serve different business needs, so choosing the right tool depends on your priorities. Here’s when you should pick each:
Choose Looker if:
Your business needs advanced data modeling with LookML for structured and scalable analytics.
You work with cloud-based databases like BigQuery, Snowflake, or Redshift.
Your team has SQL expertise and prefers a developer-friendly approach to BI.
You need a highly customizable, API-driven BI tool for embedding analytics into applications.
Choose Power BI if:
You want an affordable, user-friendly BI tool with a drag-and-drop interface.
Your organization relies on Microsoft products like Excel, Azure, and SQL Server.
You need quick insights with strong data visualization tools.
You prefer an on-premise or hybrid solution rather than a fully cloud-based tool.
Both platforms have real strengths and real limits. Looker asks for technical investment before it pays off. Power BI is most powerful inside Microsoft's ecosystem and less so outside it.
Those limits look different now that analytics evaluations increasingly include agent capabilities sitting on top of the reporting layer, and the criteria for judging those are not the criteria for judging a dashboard tool. If that is part of your process, this guide to what to look for in an analytics agent platform covers the dimensions that apply.
Where Agentic Analytics Fits
Looker and Power BI solve the same problem in different ways: someone models the data, someone builds the report, someone else reads it. Looker asks a data team to encode that logic in LookML first. Power BI lets a business user drag it together in an afternoon. Either way, a person is in the loop at every step.
Upsolve AI builds context infrastructure for analytics agents, which is a different problem entirely. Here is the shape of it. Connect any AI tool to your warehouse and it will produce valid SQL immediately. It will also join on the deprecated orders table, read "last quarter" as calendar rather than fiscal, and quietly include the internal test accounts. The query runs. The number is wrong. Nobody catches it until two reports disagree in front of the board.
That failure is not about model quality. It is about knowledge the model has no way to reach: which table finance actually trusts, how your company defines an active customer, which exception applied to last year's Q3. That knowledge sits in analysts' heads, in Slack, and in a LookML file that stopped matching reality when someone renamed a column upstream.
Agent Studio is where a data team encodes that knowledge in a form an agent can use: metric definitions, validated query patterns, business rules, and guardrails on what the agent may answer. The Agentic Dashboard is the front end, where someone in finance or sales asks a question in plain language, or describes the dashboard they want built, instead of waiting on the reporting queue.
That knowledge is organized into three layers:
Structure: what data exists and how it connects.
Meaning: what a term like revenue means at your company specifically, not in general.
Trust: which answers have been checked by someone who would know.
LookML is a strong answer to the Meaning layer, and one of the better ones in the category. Agents break down in production when Structure or Trust is missing, and Trust is the layer almost nobody builds.
Pricing: free tier, Pro from $500/month, Team at $2,000/month, which adds embedding, role-based access control, multi-tenant support, and semantic layer generation. Enterprise is custom. Annual billing is 20% off. Compliance controls for regulated environments are available.
None of this replaces Looker or Power BI on a like-for-like basis, and it is not ranked against them here. If you need a modeling layer and a report builder, the comparison above is the relevant one. If your recurring problem is that answers take days and still get questioned when they arrive, that is a different purchase.
If Tableau is also in your evaluation, we compare it against Looker in Tableau vs Looker.
Looker vs Power BI: Which Should You Choose?
Both are capable platforms, and the right answer depends on what your team already has.
Looker suits organizations with SQL expertise that want a governed modeling layer, particularly those already running on BigQuery, Snowflake, or Redshift. The LookML investment is real, and it pays off in consistency across teams.
Power BI suits organizations already inside the Microsoft ecosystem, where integration with Excel, Azure, and SQL Server removes friction that would otherwise cost engineering time. It also has the lower entry price and the shallower learning curve.
If neither feels right, the reason is often that the bottleneck is not the reporting tool. It is that every question requires someone who knows the data to be available, and that person has a queue. No modeling layer fixes that on its own.

Try Upsolve for Embedded Dashboards & AI Insights
Embed dashboards and AI insights directly into your product, with no heavy engineering required.
Fast setup
Built for SaaS products
30‑day free trial


