
Compare Tableau and Looker across features, pricing, scalability, user experience, and use cases to decide which BI platform fits your business needs.

Ka Ling Wu
Co-Founder & CEO, Upsolve AI
10 min

Are you stuck deciding between Tableau and Looker for your business?
Trust me, you’re not alone. It can be quite a tricky decision.
Both platforms are powerful players in the world of analytics, but they’re built for different needs.
🌟 Tableau: A go-to for anyone needing powerful data visualization. It’s user-friendly, intuitive, and great for businesses that need quick, stunning visual reports with a simple drag-and-drop interface.
🌟 Looker: A platform designed with data exploration and deep modeling in mind.. It’s perfect for businesses with tech-savvy teams who need to dive deep into data relationships.
So why should you read this blog?
Here’s what you’re going to find:
Key Features: I’ll walk you through the core features of both Tableau and Looker, so you can understand which tool might fit your needs better.
User Reviews: Real insights from users on the pros and cons of each platform—because real feedback matters.
Scalability and Integration: You’ll get the lowdown on how each platform handles large datasets and integrates with your existing tech stack.
Pricing: A straightforward breakdown of the costs.
Ideal Use Cases: When should you pick Tableau over Looker and vice versa?
By the end of this blog, you’ll have all the info you need to make the best choice for your business.
Before diving into their detailed comparison, here’s a quick table comparing Looker and Tableau for your reference.
Tableau vs Looker: Full Comparison Table

What Is Tableau?
Tableau is a powerful data visualization and analytics platform that helps you turn raw data into interactive, easy-to-understand dashboards and reports.
Whether you're working with sales, customer data, or operational metrics, Tableau makes it easy for anyone to understand complex data at a glance.
Key Features Of Using Tableau
Drag-and-Drop Interface: Its intuitive design lets you create visualizations without coding—just drag fields into the workspace to build charts or maps effortlessly.
Real-Time Data Updates: This ensures you always have the latest insights by connecting to multiple data sources and updating visualizations instantly.
Interactive Visual Analytics: You can click on specific parts of charts or dashboards to drill deeper into your data and uncover hidden insights with ease.
Collaboration Tools: This allows you to share dashboards seamlessly with your team, ensuring everyone works with the same up-to-date information for better decisions.
Flexible Deployment Options: You can choose Tableau Cloud for easy accessibility or Tableau Server for on-premises management, giving you the flexibility to suit your needs.
Ideal Use Cases For Tableau
Tableau is particularly useful for businesses that need to present data visually and make it accessible to all team members.
Some ideal use cases include:
Sales and Marketing Teams: You can rely on it to track metrics like customer trends and campaign performance.
Retail and E-Commerce: Use it to visualize sales trends, monitor inventory, and optimize supply chains. This tool simplifies handling large operational data.
Finance and Operations: You can turn complex financial data into actionable insights with its dynamic reporting.
In short, Tableau is an excellent choice if you need a tool that simplifies data visualization and makes it accessible to all, no matter the technical expertise.
It's a great fit for teams looking to make data-driven decisions faster and more effectively.
Tableau Pricing Breakdown
Tableau has three major categories of plans with several pricing sub-plans:
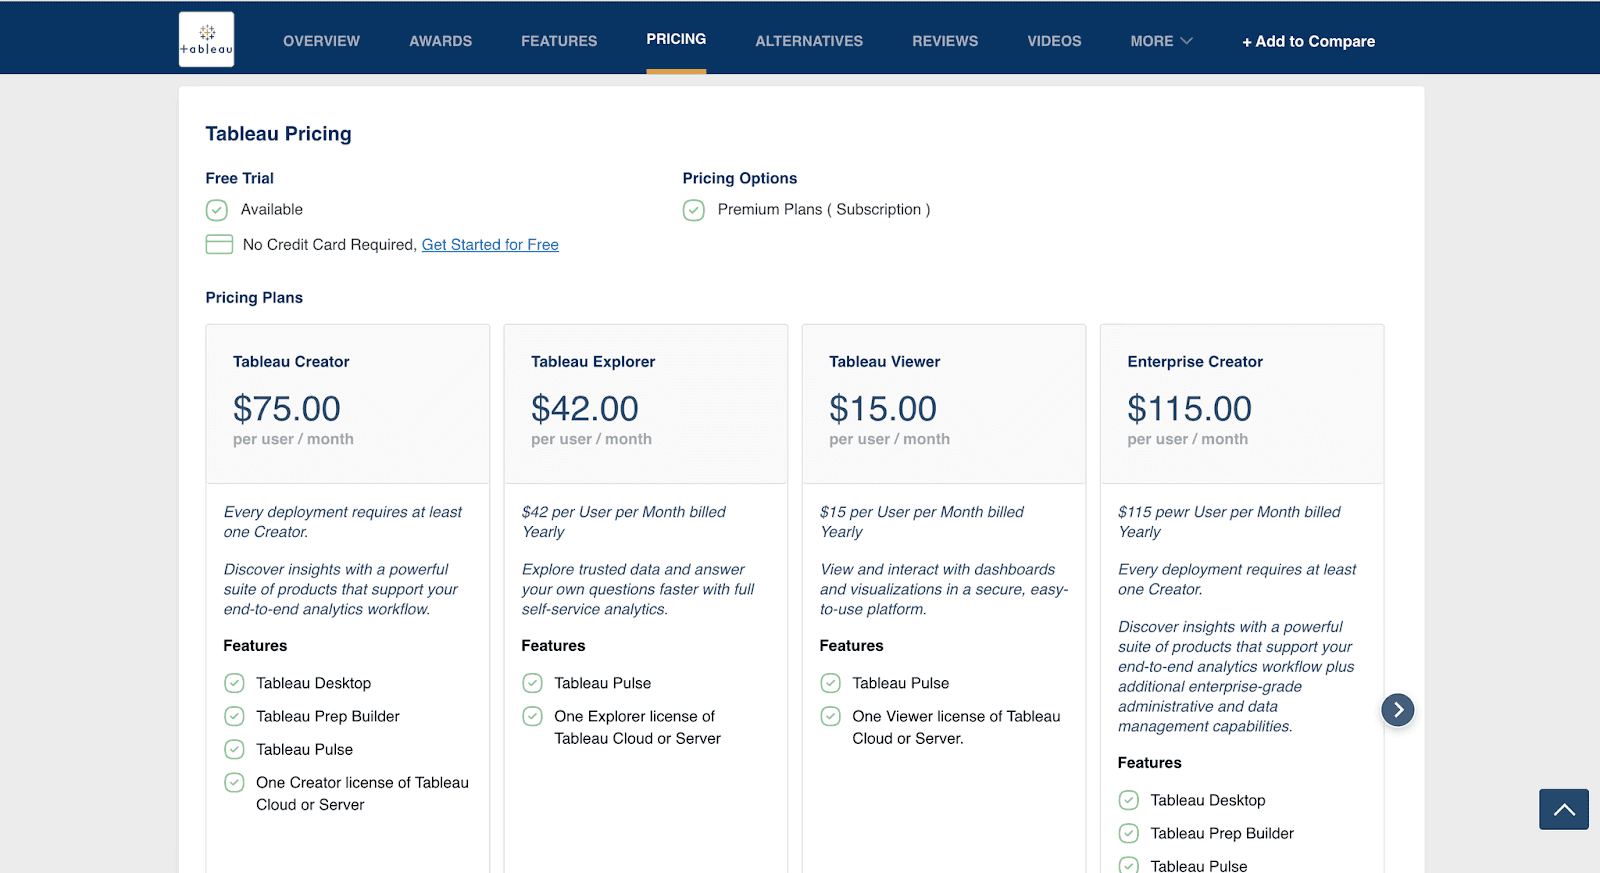
Tableau Plans
Tableau Creator
Designed for users who create and manage data visualizations and dashboards.
Includes Tableau Desktop, Tableau Prep Builder, and a Creator license for Tableau Cloud or Tableau Server.
$70 per user per month, billed annually.
Tableau Explorer
Suited for users who explore and analyze data without the need for full content creation capabilities.
Includes Access to Tableau Cloud or Tableau Server with capabilities to interact with and modify existing dashboards.
$42 per user per month, billed annually.
Tableau Viewer
Intended for users who primarily view and interact with dashboards and visualizations.
Includes access to published content with interactive features.
$15 per user per month, billed annually.
Enterprise Plans
For organizations requiring advanced features, Tableau offers Enterprise editions:
Enterprise Creator
Provides all features from the Tableau Creator plan plus advanced data management.
$115 per user per month, billed annually.
Enterprise Explorer
Expands on the Tableau Explorer plan with enhanced management tools.
$70 per user per month, billed annually.
Enterprise Viewer
Similar to Tableau Viewer but with added enterprise-level features.
$35 per user per month, billed annually.
Tableau +
Ideal for large enterprises seeking maximum analytics depth, customized reporting, and powerful, organization-wide data management.
Includes all standard Tableau features plus cutting-edge AI insights, customizable data alerts, AI-powered analytics, and exclusive Tableau Pulse capabilities.
You have to contact sales for pricing.
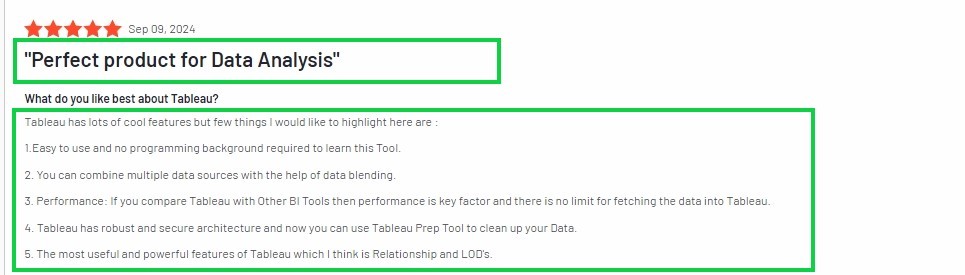
User Reviews: Pros And Cons Of Using Tableau
From my own experience using it, here are the pros and cons of Tableau alongside insights from G2 and Reddit.
Pros
User-Friendly Interface: Users appreciated the intuitive drag-and-drop functionality, making it easy for beginners and non-technical users to create complex visualizations.
Powerful Visualizations: Users said Tableau turns data into stunning, interactive dashboards, simplifying data insights.
Seamless Data Integration: Users reported it easily connects to various data sources, enabling smooth data blending from multiple platforms.
Fast Performance: Users highlighted Tableau’s speed and ability to handle large datasets without slowdowns, providing real-time insights.
Strong Support & Community: Users appreciated the extensive online resources and support, making troubleshooting and learning more accessible.
Cons
Limited for Complex Analysis: Users reported that Tableau becomes cumbersome when working with complex data. It’s great for visualization but lacks advanced analytical capabilities.
Intuitive but Not Always Efficient: Users said certain tasks feel hacky or unintuitive. Simple actions can require workarounds or additional steps.
No Default Support for Common Chart Types: Users highlighted missing features like Pareto charts or Sankey diagrams, which require complex hacks to implement.
Poor Handling of Time Data: Users complained about issues with timestamp truncation and bugs related to date filters, which haven't been resolved for years.
Slow Performance: Users found Tableau Online to be slow, especially with large datasets or dashboards requiring pre-aggregation, which can make it frustrating to use.
Lack of Easy Customization: Users said there are missing features like checkboxes for boolean variables and limited ways to manipulate data dynamically within dashboards.
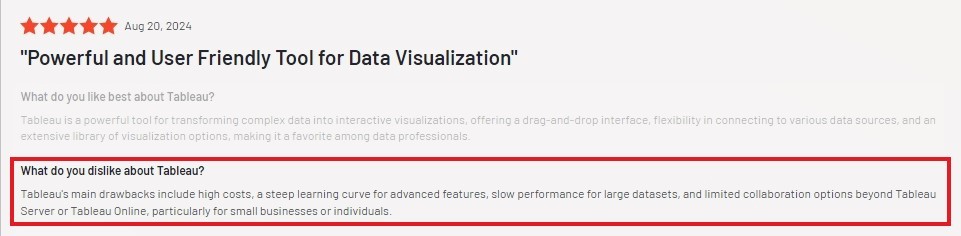
Overall…
✔️ Tableau shines in delivering interactive visualizations and user-friendly dashboards, making it an excellent tool for presenting data to non-technical users with seamless data integration and real-time updates.
❌ However, users point out its steep learning curve for advanced features, slow performance with larger datasets, and relatively high costs, making it less ideal for complex analyses or budget-conscious teams.
What is Looker?
Looker is a business intelligence (BI) platform designed to help you explore, analyze, and visualize your data.
It focuses on data modeling, allowing you to create a unified view of your data across different systems.
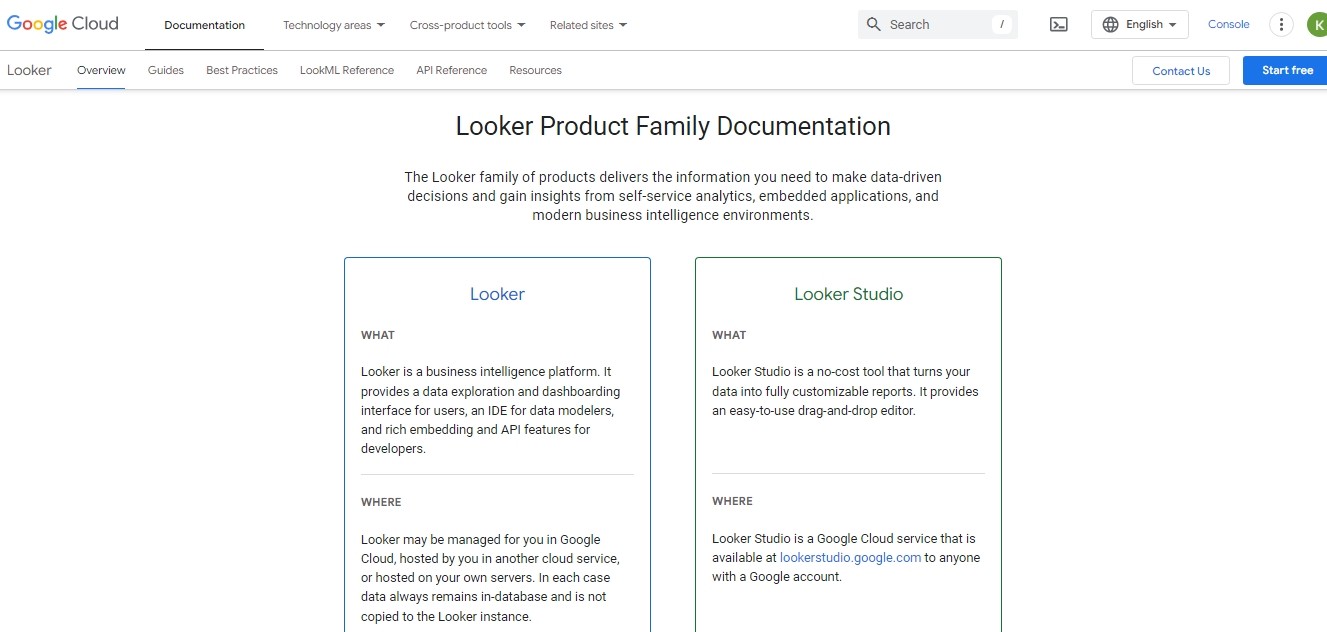
Whether you’re working with sales, marketing, or operational data, Looker helps you model and visualize complex datasets for clear, actionable insights.
Key Features Of Using Looker
LookML Data Modeling Language: Looker uses its LookML to let you define your data relationships and models in a reusable way. This ensures consistency and scalability across your organization.
Integrated Analytics: It connects directly to your data sources, offering you real-time insights without needing imports or exports. This keeps your insights accessible.
Collaboration Tools: Looker lets you share dashboards, reports, and insights effortlessly with your team. It keeps everyone aligned and working with the same data.
Scalable Data Exploration: Whether your business is a startup or an enterprise, Looker adapts to your scale. Its scalable data models grow with your needs.
Custom Reporting: You can create tailored reports and embed analytics into your own tools.
Ideal Use Cases For Looker
Looker is ideal for companies that need deep data exploration and advanced integrations.
It’s especially useful for:
Large Enterprises: Companies with complex data sets can rely on Looker to centralize their data model and ensure consistent reporting across departments.
Finance and Operations Teams: Quickly analyze operational data and financial performance to improve decision-making.
Marketing and Sales Teams: Track key metrics and customer behavior insights to drive more effective strategies and campaigns.
In summary, Looker is a great choice if you need a flexible, scalable platform for data exploration and reporting, with strong integration and collaboration features.
It’s perfect for businesses that want to make smarter decisions based on reliable, real-time data

Looker Pricing Breakdown
Just to give you a little heads up - Looker’s pricing is not transparent.
So, what you’ll find here is a product of my own research.
You’ll have to contact sales for Looker’s actual pricing.
Standard Edition
Designed for smaller teams with fewer than 50 users.
Includes:
One main setup (production instance).
10 Standard Users.
2 Developer Users.
1,000 query-based API calls per month.
1,000 admin API calls per month.
Pricing: Contact Looker’s sales team for custom pricing.
Enterprise Edition
Built for larger teams needing enhanced security features.
Includes:
One main setup (production instance).
10 Standard Users.
2 Developer Users.
100,000 query-based API calls per month.
10,000 admin API calls per month.
Pricing: Custom quote available through Looker’s sales team.
Embed Edition
Ideal for embedding analytics in customer-facing applications.
Includes:
One main setup (production instance).
10 Standard Users.
2 Developer Users.
500,000 query-based API calls per month.
100,000 admin API calls per month.
Pricing: Requires a custom quote from Looker’s sales team.
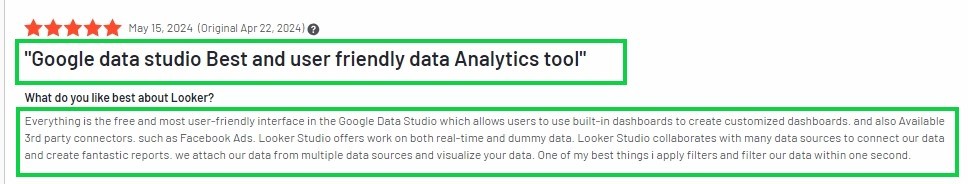
User Reviews: Pros And Cons Of Using Looker
Here’s the pros and cons of using looker.
Pros
Centralized Data Governance: Users appreciated Looker's ability to centralize data definitions across the platform, ensuring consistency in metrics and reducing errors.
SQL-Based LookML: Users liked the LookML model as it’s built on SQL, making it easier for analysts with SQL skills to quickly create custom models and dashboards.
Scalability: Users saw Looker as a good choice for large organizations, offering scalability to handle complex and vast datasets.
Strong Embedded Analytics: Users appreciated Looker’s seamless integration into other tools, allowing businesses to embed analytics into existing applications or workflows.
Self-Service Analytics: Users liked how Looker empowers analysts to build their own reports and dashboards without needing IT support, promoting faster decision-making.
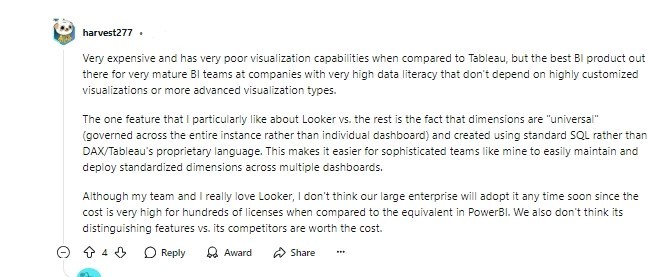
Cons
High Cost: Users saw Looker as expensive, especially for businesses needing many licenses. Some companies report paying over $75,000/year for just a few hundred licenses.
Limited Visualization Features: Users disliked Looker’s basic visualizations, finding it less flexible than competitors like Tableau for creating complex or custom reports.
Requires Strong Data Warehouse: Users noted that Looker relies on powerful data warehouses like Snowflake or BigQuery, and without them, query optimization becomes difficult.
Steep Learning Curve: Users appreciated LookML for its SQL-based approach but found it challenging to master for complex data models, requiring dedicated resources.
Vendor Lock-In: Users disliked the potential for lock-in due to LookML, which makes switching to other platforms difficult after building out models.
Less User-Friendly for Non-Technical Teams: Users found Looker harder to use for non-technical staff, making it less ideal for organizations with lower data literacy across departments.
Overall…
✔️ Looker is great for centralized data governance, offers SQL-based modeling, and scales well for large organizations. It excels in embedded analytics, self-service reporting, and collaboration across teams.
❌ However, users report a steep learning curve for advanced features, high costs, and issues with large datasets. Its visualization capabilities and third-party integrations are also seen as limited.
So, which should you choose: Tableau or Looker?
Choose Tableau if:
You need an intuitive, drag-and-drop interface that anyone can use.
Real-time data visualization and quick, interactive dashboards are essential.
You want a tool that simplifies data for teams without deep technical expertise.
Easy-to-create and share visual reports across teams is a priority.
Choose Looker if:
Your business demands scalable, flexible data exploration with strong integrations.
Advanced data modeling and deep insights are crucial for your team.
SQL expertise is available, and you need to create complex, reusable data models.
You're looking for a platform that offers centralized data governance and strong collaboration features.
Final Thoughts
Tableau has its limits when it comes to handling complex data or scaling with large datasets.
Looker’s visualization features are basic and might not meet the needs of all users.
Both tools offer powerful features, but your choice depends on your team’s skill level, data needs, and long-term goals.
Are you looking for something that offers simplicity without the technical hurdles?
Consider Upsolve AI, a user-friendly, cost-effective alternative to Tableau and Looker that makes data analytics easier and more accessible for all.
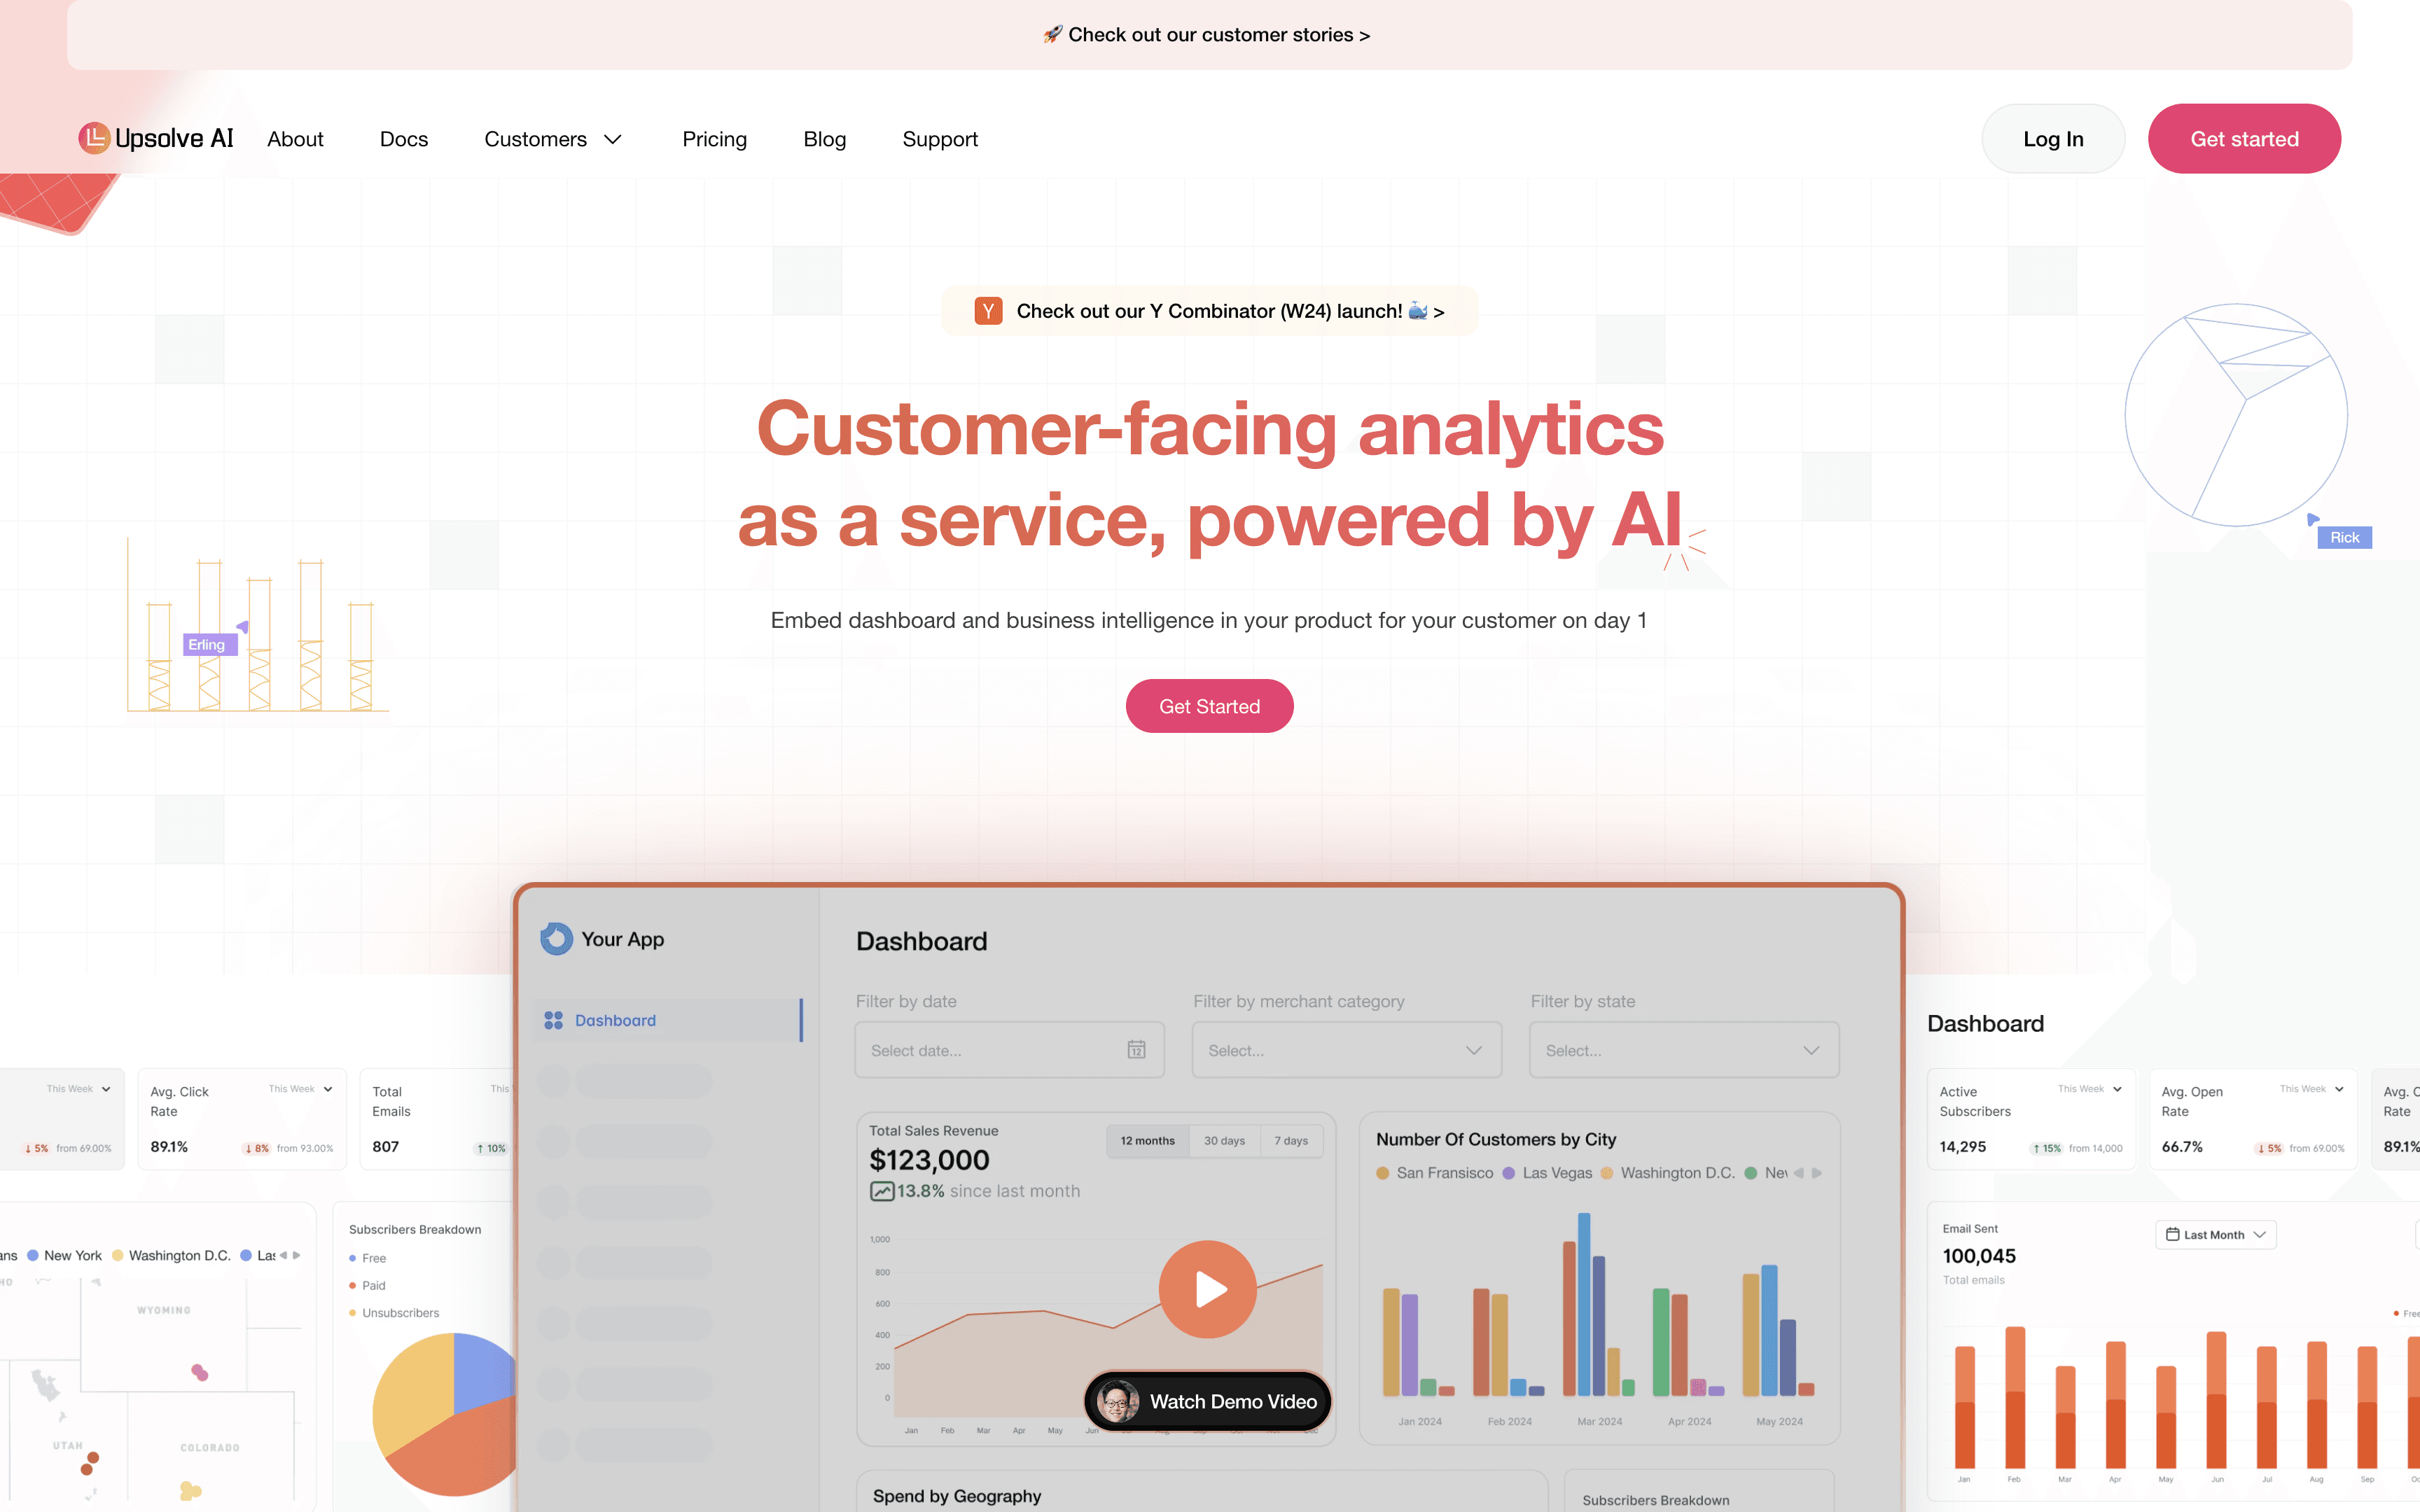
Upsolve AI: Best Alternative To Tableau And Looker
If you're looking for a more cost-effective and simple solution than Tableau or Looker, Upsolve AI might be the customer facing analytics tool you need.
It’s designed to help you embed powerful analytics directly into your application, so your users can access data insights without the need for complex setups.
Key Features Of Using Upsolve AI
Quick Deployment: You can set up a fully functional dashboard in just one day, saving you time and resources compared to building from scratch.

AI-Driven Insights: Upsolve AI helps identify trends and patterns in your data, giving your users the tools they need to make informed decisions faster.
Drag-and-Drop Interface: No technical expertise is required to build dashboards. It’s simple enough for anyone to use.
Embedded Analytics: Integrate insights seamlessly into your application, so your users don’t have to leave your platform to explore data.

Usage Analytics: Track how your users interact with the data to improve their experience and make adjustments where needed.
Unlike Tableau and Looker, which require heavy engineering investment, Upsolve AI makes it easier and quicker to integrate analytics into your product, helping you focus on what matters most.
Upsolve AI Pricing Breakdown
Upsolve AI offers a free test-drive plan and three paid tiers; embedding and multi-tenant analytics start on the Team plan ($2,000/month). Paid plans are structured around monthly credits, with $0.05/credit overage.
Free — $0
A full test-drive of Upsolve with Pro features unlocked.
2,000 one-time credits (~200 analytical questions)
All Pro features unlocked
Community support
Pro — $500/month
For teams getting started with AI-powered analytics.
2,000 credits/month (~200 questions/mo), $0.05/credit overage
50+ data connections, unlimited agents
Charts & visualization, context management suite, full observability & eval
MCP App, priority email support
Team — $2,000/month
For teams that need embedding, RBAC, and a semantic layer. Everything in Pro, plus:
10,000 credits/month (~1,000 questions/mo), $0.05/credit overage
Row-level security / RBAC, embed Upsolve in your product, multi-tenant support
AI Cockpit for data modeling & semantic-layer generation
AI dashboards + email scheduling, dedicated support, bulk credit discount
Enterprise — Custom
For custom deployment, security, and model-routing. Everything in Team, plus:
Custom base platform fee + credits, or BYOM + surcharge
On-prem / self-host / VPC, SAML SSO, HIPAA, SOC 2
Model routing (BYOM), Forward Deployed Engineering, 24/7 support + shared Slack
Annual billing is 20% off across all plans.
Why Choose Upsolve AI?
If you’re looking for a solution to embed analytics directly into your product without the complexity and hefty price tags of Tableau or Looker, Upsolve AI might be the perfect fit for you.
For businesses that need to integrate analytics into customer-facing platforms, Upsolve AI provides several advantages that can save time and resources:
Transparent Pricing: Upsolve AI uses clear, usage-based credit pricing with no hidden fees — a free tier and paid plans from $500/month — unlike the complex pricing of Tableau and Looker.
Seamless Embedded Analytics: Quickly embed fully functional dashboards into your app, with real-time updates and easy deployment—no complex setups required.
AI-Driven Insights: Upsolve AI automatically detects trends in your data, delivering actionable insights without needing a data science team.
Ease of Use: The drag-and-drop interface makes it simple for non-technical teams to build dashboards, saving time and resources.
In summary, if you need a simple, cost-effective, and powerful way to integrate analytics into your product, Upsolve AI could be the right choice.
Conclusion
When it comes to choosing between Tableau and Looker, the right tool depends on your business needs.
If you’re looking for powerful visualizations and quick, easy reporting, Tableau is a solid choice.
On the other hand, Looker shines in data modeling and scalability, making it ideal for businesses with complex data needs and technical teams.
However, if you're seeking a simpler, more cost-effective solution without the complexities of traditional BI tools, Upsolve AI might be the perfect fit.
With its intuitive dashboard, real-time analytics, and seamless integration, it provides a great alternative for businesses looking to embed analytics into their platforms—without the hassle.
Ready to simplify your analytics? Try Upsolve AI and see how easy data-driven decisions can be.

Try Upsolve for Embedded Dashboards & AI Insights
Embed dashboards and AI insights directly into your product, with no heavy engineering required.
Fast setup
Built for SaaS products
30‑day free trial


