
We tested five Tableau alternatives for embedded analytics, comparing features, pricing, pros, cons, and which tools work best for customer-facing use cases.

Ka Ling Wu
Co-Founder & CEO, Upsolve AI
10 min

Finding the right tool for embedded analytics and business intelligence can feel like navigating a maze.
Tableau is popular amongst Founders, CTOs, and Product Managers.
But, High costs, complexity, or a lack of flexibility might make you wonder, “Is there something better out there?”
That’s exactly why I’m here—to help you find Tableau alternatives that suit your needs without the headaches.
If you skip this blog, here’s what you’ll miss:
A breakdown of Tableau’s strengths and weaknesses.
A comparison of 5 Tableau incredible alternatives we tested.
By the end of this blog, you’ll know exactly which Tableau alternatives fit your needs and help you get results faster.
Let’s dive in—you don’t want to miss this!
What Is Tableau?
Tableau is a business intelligence (BI) tool that helps you analyze and visualize data for better decision-making.
It allows you to connect to multiple data sources and create interactive dashboards and reports.
The platform simplifies data analysis with its drag-and-drop interface, making it user-friendly for non-technical users.
With Tableau, you can explore trends, gain insights, and share your findings easily with your team.
Why should you opt for Tableau Alternatives?
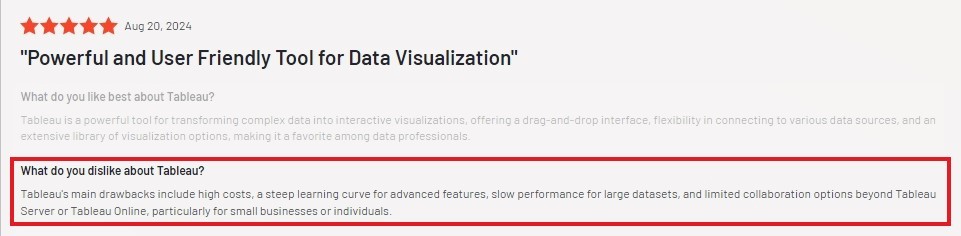
While Tableau is a leading BI tool, it’s not perfect for everyone.
Based on reviews from G2 and Reddit, here’s what users often dislike about Tableau:
Limited Customization for Embedded Analytics: Tableau’s embedded analytics often lack flexibility for advanced customization, making it harder to align dashboards with your brand or create truly interactive customer-facing experiences.
Performance Challenges with Large Datasets: Users report slow load times and delays when working with large or complex datasets, which can disrupt customer engagement in embedded analytics scenarios.
High Licensing Costs for Scaling: Tableau’s licensing costs quickly add up, particularly for businesses aiming to scale embedded analytics across multiple users or customer-facing platforms.
Difficult Integration with Non-Standard Data Sources: While Tableau supports many data sources, integrating less common or custom sources often requires additional time and expertise.
Gaps in Customer-Focused Experience: The lack of deeper customization options and occasional performance issues can limit the ability to deliver seamless, impactful analytics to your products’ end-users.
Complexity for Non-Technical Teams: Although Tableau has a user-friendly drag-and-drop interface, creating advanced dashboards for embedding can require technical expertise, increasing reliance on IT support.
If these limitations sound familiar, it’s worth exploring other BI tools that offer better scalability, affordability, or ease of use.
In the following sections, I’ll introduce you to some top Tableau alternatives that address these challenges and might be a better fit for your business needs.
Top 5 Tableau Alternatives We Tested For Embedded Analytics
Here are five popular tableau alternatives:
Upsolve AI
Power BI
ThoughtSpot
Looker
Qlik Sense
In the next couple of minutes, I’ll explore each of these tools in detail to help you decide which one fits your business needs best.
But before we proceed, here’s a quick reference table that helps you understand the main differences between each tool.
Comparison Table

Upsolve AI
If you’re looking for a smarter way to handle customer-facing analytics that you can embed anywhere, Upsolve AI might be your answer.
Upsolve AI helps businesses create interactive user-facing dashboards and deliver data insights directly to their customers.
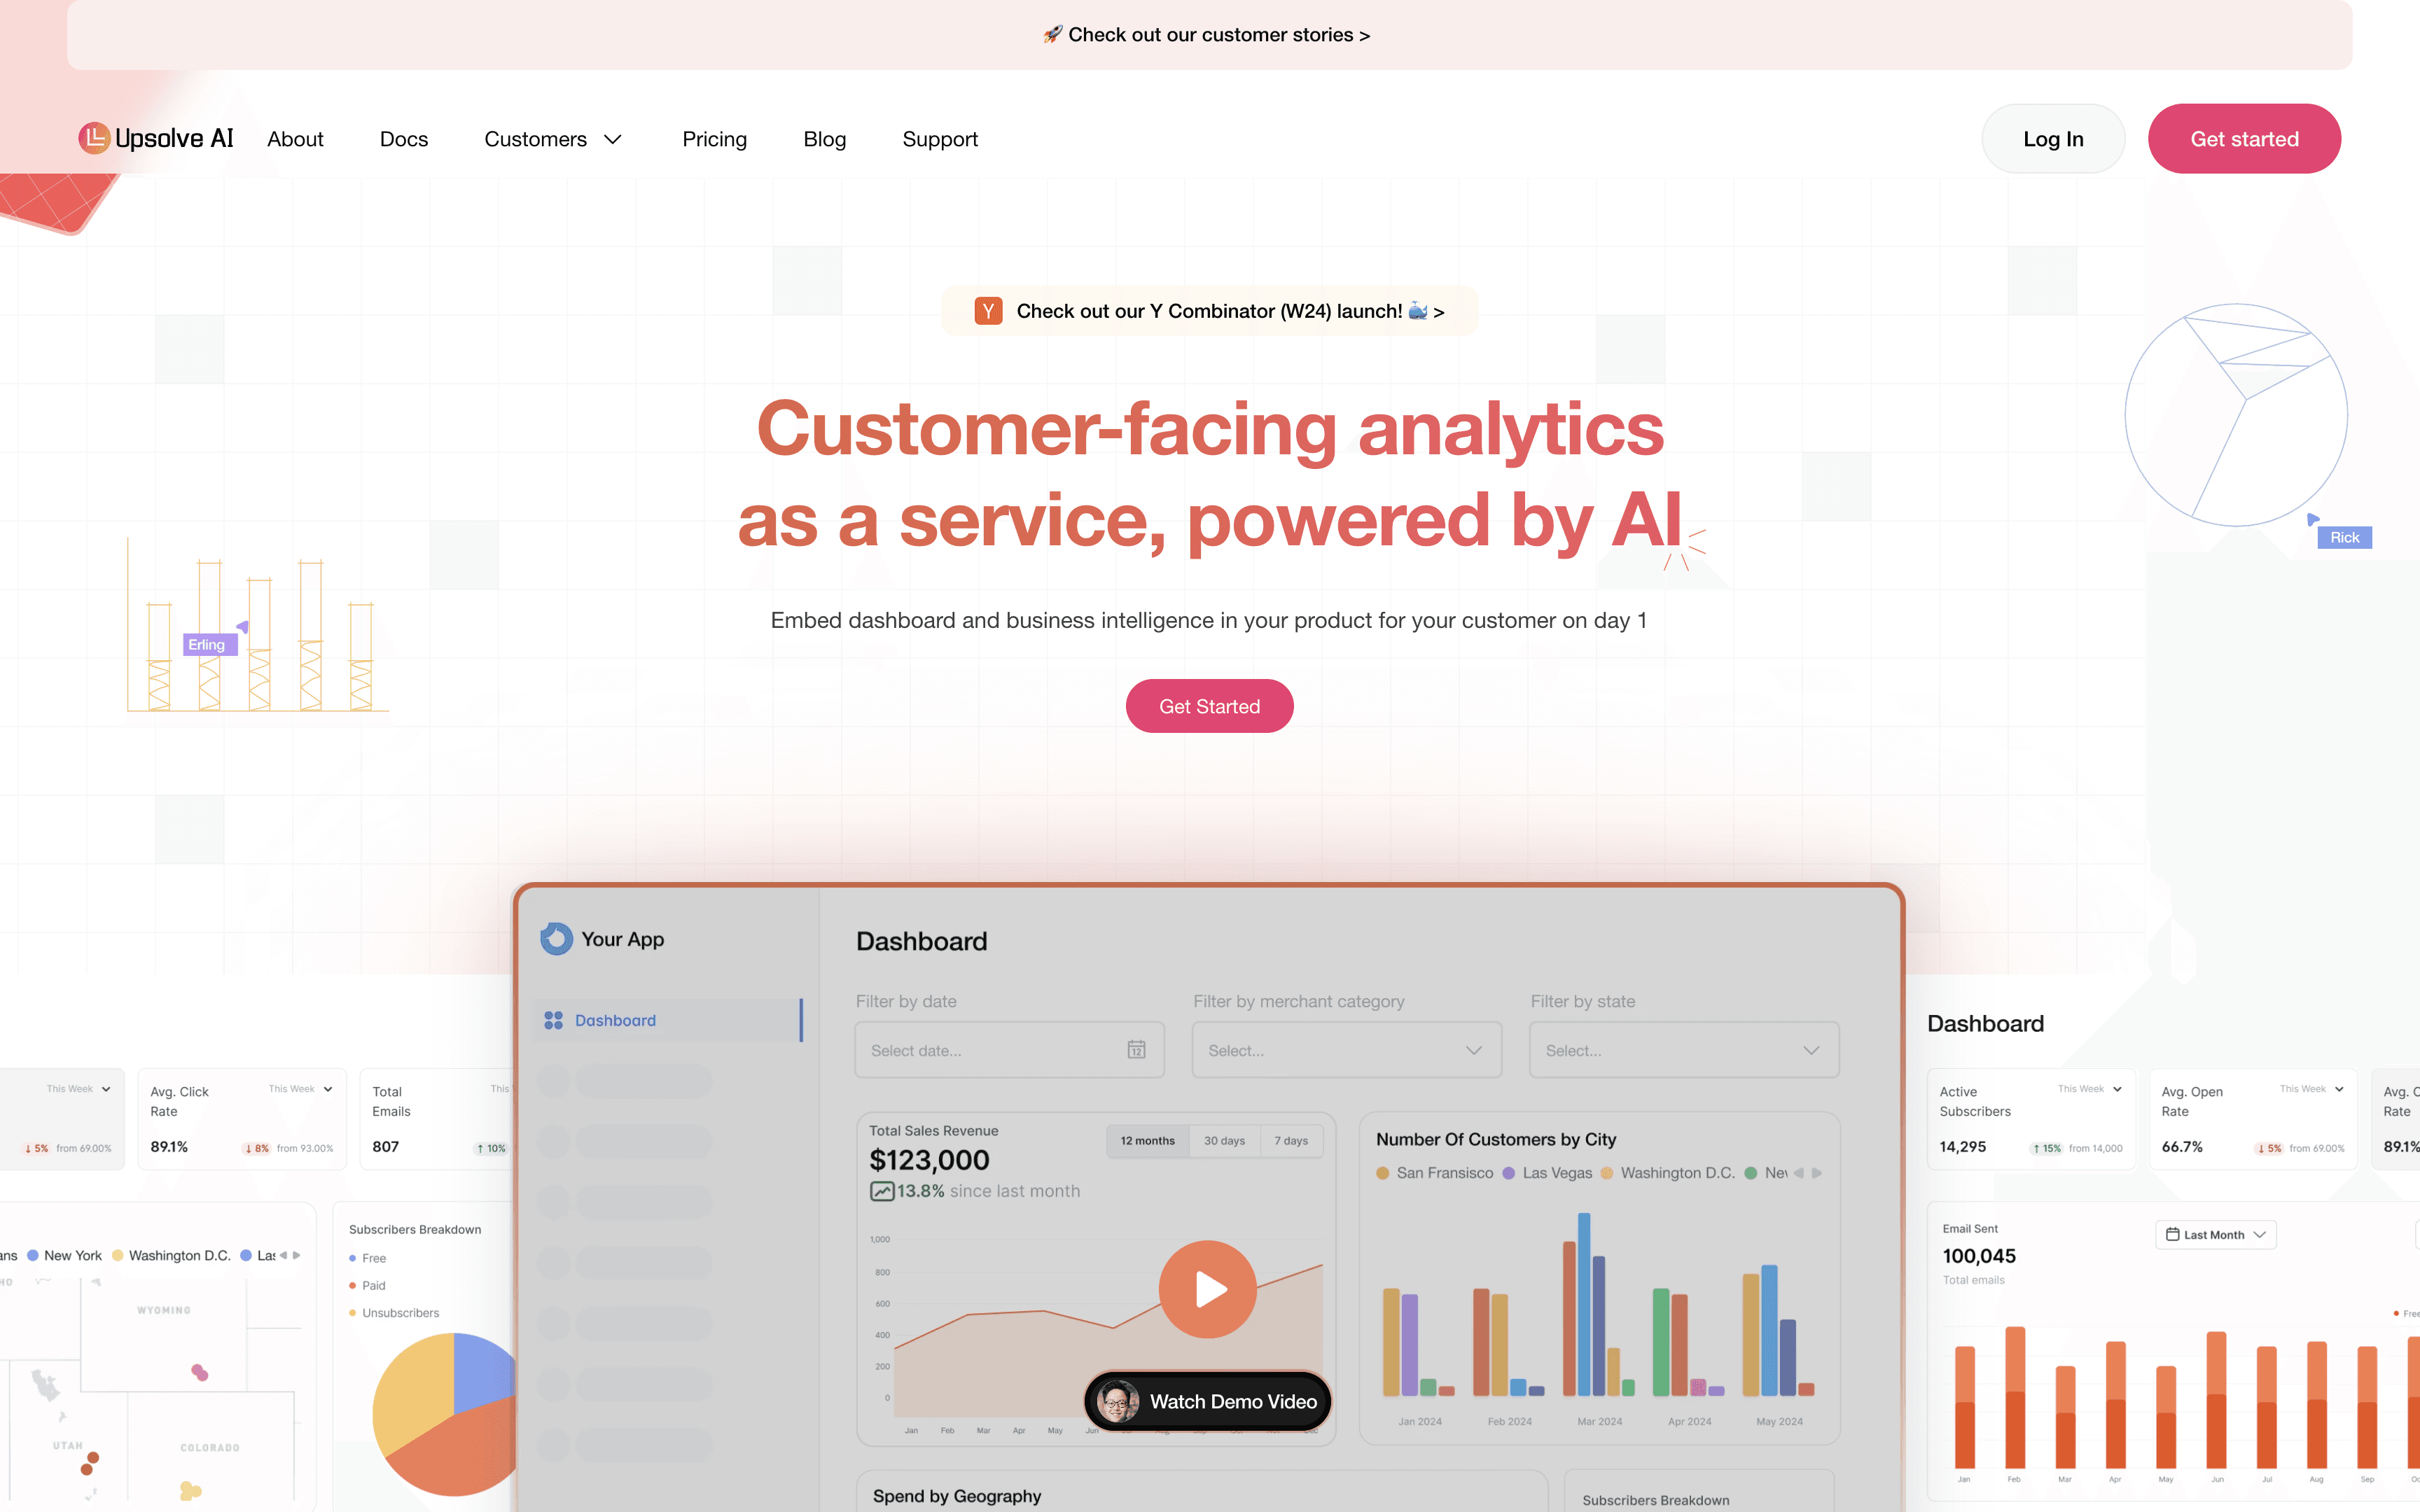
This tool simplifies embedded analytics, making it easy to integrate data visualization into your product quickly and effectively, and allows you to place your focus on building your product.
By delivering actionable insights seamlessly, it helps build loyal customers who stay connected to your platform, driving higher retention and engagement.
Customer or User Facing Analytics: Why You Shouldn't Be Building?
Key Features of Upsolve AI
Embedded Analytics: You can embed analytics directly into your app using simple React or Vue components for effortless integration.
Quick Deployment: You can set up dashboards in just a day, giving your customers instant access to valuable insights.
AI-Powered Insights: You’ll uncover patterns and trends easily with AI, making your data actionable.
Drag-and-Drop Interface: You can build professional dashboards without any technical skills, using a simple drag-and-drop design.
Usage Analytics: You can track how users interact with your dashboards to understand their behavior and enhance their experience.
Upsolve AI Pricing Breakdown
Upsolve AI offers a free plan plus three paid tiers; embedding and multi-tenant analytics start on the Team plan ($2,000/mo).
Free ($0): 2,000 one-time credits (~200 questions); all Pro features, to test-drive
Pro ($500/mo): 2,000 credits/month; 50+ data connections, unlimited agents, full observability
Team ($2,000/mo): 10,000 credits/month; adds embedding, RBAC/row-level security, multi-tenant, and semantic-layer generation
Enterprise (custom): on-prem/VPC, SAML SSO, HIPAA, SOC 2, and BYOM
Annual billing is 20% off.
Pros And Cons Of Using Upsolve AI
According to user reviews, here are the likes and/or dislikes of using Upsolve AI.
Pros
Quick Deployment: Users reported that Upsolve AI allows them to create and deploy dashboards within a day, saving significant time.
AI-Powered Insights: Many users said the tool’s AI-driven analytics made it easier to spot trends and patterns without deep technical expertise.
Ease of Use: Users appreciated the drag-and-drop interface, making dashboard creation accessible even for non-technical team members.
Seamless Integration: Users highlighted how Upsolve AI’s simple React and Vue components made embedding analytics effortless within their applications.
Improved Customer Engagement: Users shared that customers found it easier to interact with data and extract actionable insights, improving product stickiness.
Customizable Templates: Users said the ready-to-use dashboard templates were flexible enough to meet their unique business needs.
Usage Analytics: Users valued the ability to track customer behavior on dashboards, helping them refine their products effectively.
Scalable Solutions: Many users noted that Upsolve AI supports business growth with scalable plans and features tailored to larger teams.
Cons
Limited Internal Analytics: Users reported that Upsolve AI focuses primarily on customer-facing analytics, which may not fully support internal business needs.
Summary of Upsolve AI
Upsolve AI is a business intelligence platform built to streamline customer-facing analytics.
With features like AI-powered insights, quick deployment, and an intuitive drag-and-drop interface, it simplifies dashboard creation and enhances user engagement.
Upsolve AI is best suited for:
Startups and small businesses need quick, cost-effective dashboard integration.
Enterprises looking for scalable solutions to embed advanced analytics into their applications.
Product teams aiming to improve customer experience with actionable and interactive data insights.
If your focus is on delivering seamless customer-facing analytics, Upsolve AI is the ideal solution for your needs.
Power BI
Power BI is a business intelligence tool from Microsoft that helps you analyze and visualize data for actionable insights.
This platform integrates seamlessly with other Microsoft applications like Excel, Teams, and SharePoint, making it easy to use in your daily workflows.
Key Features of Power BI
Data Integration: It connects to various data sources, including cloud services, databases, and Excel spreadsheets.
Interactive Visualizations: It creates rich, interactive dashboards and reports to explore and present data.
AI-Powered Analytics: It uses built-in AI features to uncover trends, make predictions, and simplify data analysis.
Seamless Embedding: It embeds BI reports into your own apps or websites to enhance user experience.
Enterprise-Level Security: It ensures data safety with advanced security and governance features.
Real-Time Insights: It gives live updates on dashboards, making it ideal for dynamic decision-making.
Power BI Pricing Breakdown
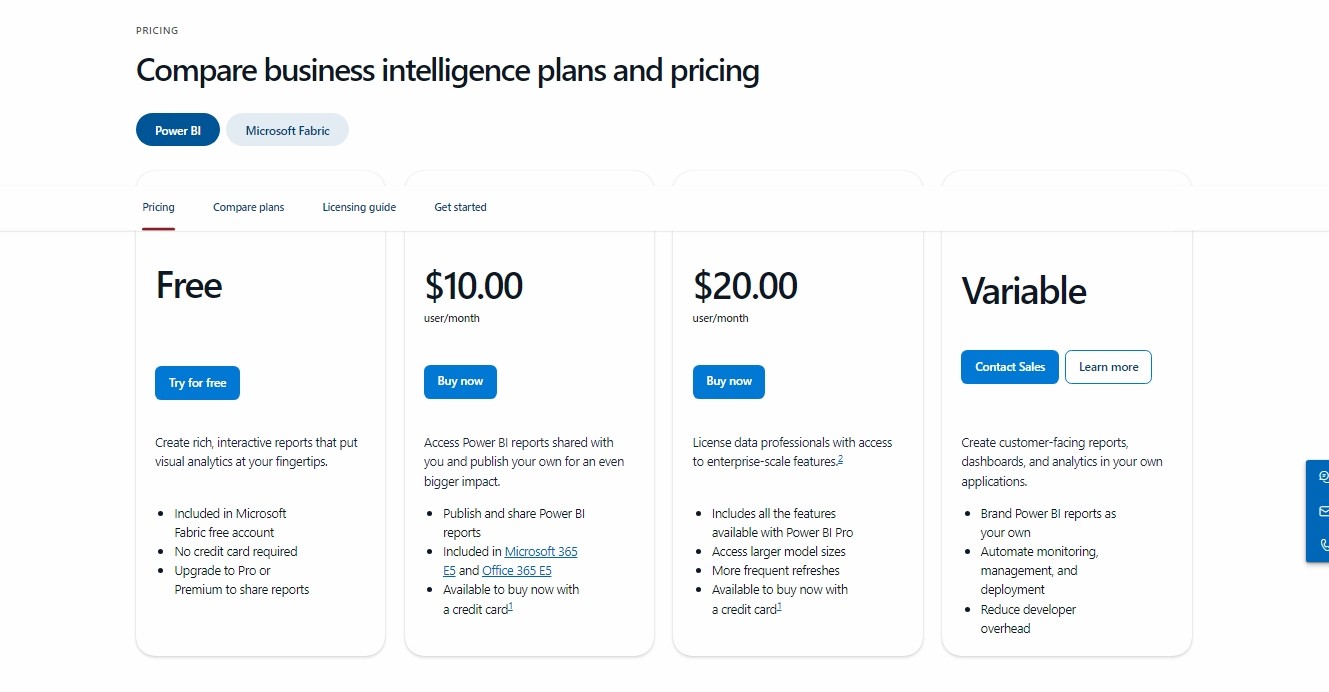
Power BI Free
Ideal for personal use or small-scale reporting. You can create and view reports but can’t share them with others.
Free
Power BI Pro ($10/user/month):
Perfect for businesses needing to create and share reports. It includes collaboration features and access to shared datasets.
$10/user/month
Power BI Premium Per User ($20/user/month):
Adds enterprise-grade capabilities like advanced analytics, AI-generated insights, and higher storage limits.
$20/user/month
Power BI Premium
Designed for large organizations, this plan offers enterprise-scale features, unlimited sharing, and access to Microsoft Fabric workloads.
Contact sales for pricing.
Pros And Cons Of Using Power BI
Pros
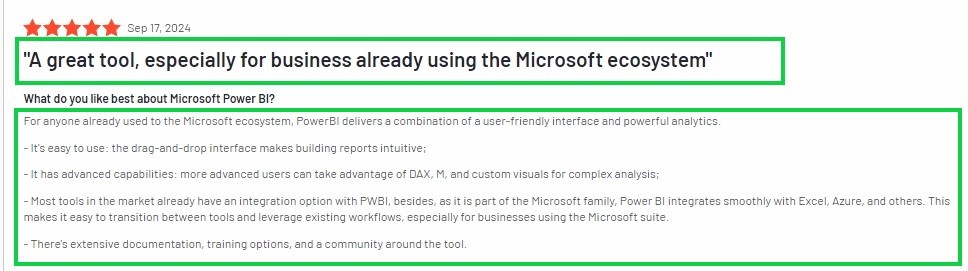
Ease of Use: Users frequently reported that Power BI’s drag-and-drop functionality made it simple to create reports and dashboards.
Wide Range of Integrations: Users appreciated how easily Power BI integrates with other Microsoft tools like Excel, Azure, and Dynamics 365, streamlining workflows.
Data Visualization Options: Users said they could create detailed charts, maps, and slicers, allowing them to present data in various formats.
Scalability for Enterprises: Users highlighted its ability to scale effectively, supporting large datasets and multiple teams without significant performance issues.
Real-Time Insights: Many users noted the real-time updates in dashboards, which helped them make timely, informed decisions
Cons
Learning Curve for Advanced Features: Users said mastering advanced functionalities like DAX and Power Query required significant time and effort.
Performance Issues with Large Datasets: Many users reported slow performance when working with extensive datasets or complex queries, impacting productivity.
Limited Customization Options: Users noted challenges in customizing visuals beyond the provided templates, especially compared to competitors like Tableau.
Dependency on Cloud Services: Some users highlighted that Power BI heavily relies on cloud services for collaboration and sharing, which can pose challenges for organizations with strict data policies.
Summary Of Power BI
Power BI is a business intelligence tool designed to transform data into interactive visual reports and dashboards.
With features like seamless Microsoft ecosystem integration, a user-friendly drag-and-drop interface, and advanced analytics capabilities, Power BI helps you create insightful visuals effortlessly.
Power BI is best suited for:
Businesses already using Microsoft products, leveraging seamless integrations with tools like Excel and Azure.
Teams who need real-time data updates and collaborative dashboards for decision-making.
Organizations requiring a cost-effective yet powerful alternative to Tableau.
If your focus is on leveraging analytics within the Microsoft ecosystem, Power BI might be the right fit for you.
ThoughtSpot
ThoughtSpot is an AI-powered analytics tool that allows you to analyze and visualize data using natural language search.
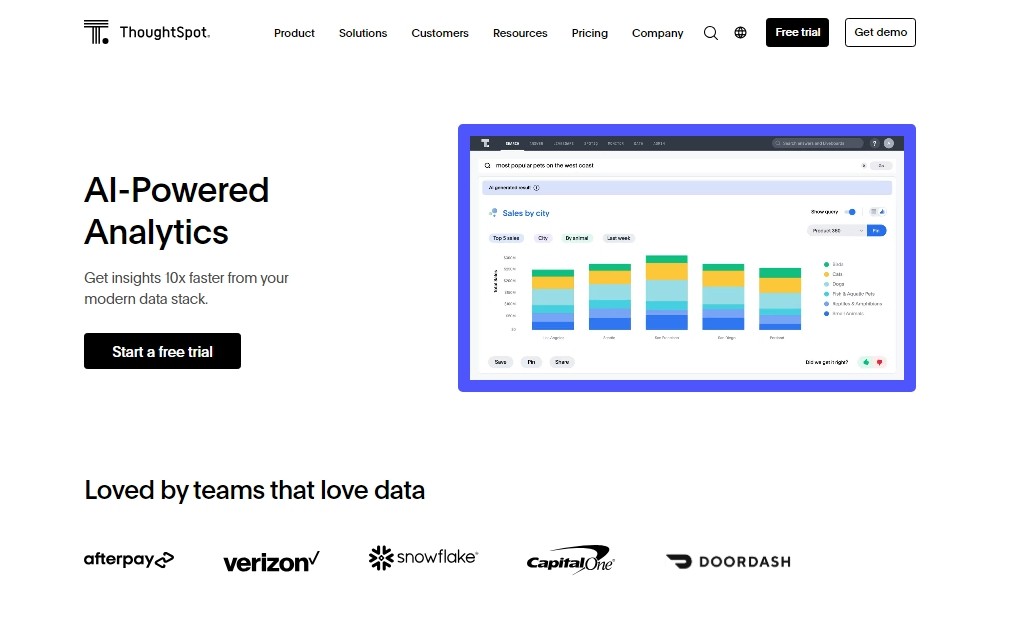
It’s designed to make data insights accessible to everyone, even if you don’t have technical expertise.
Key Features of ThoughtSpot
Natural Language Processing (NLP): It asks questions in plain language, like “What are last quarter’s sales?” to get instant answers.
Real-Time Data Queries: It accesses live data directly from your cloud platform for up-to-date insights.
Scalable Data Handling: It handles large and complex datasets effortlessly, suitable for businesses of all sizes.
Interactive Liveboards: It creates live, interactive dashboards to track metrics and drill into details.
Embedded Analytics: It embeds ThoughtSpot’s analytics into your apps to deliver insights directly to users.
ThoughtSpot Pricing Breakdown
Thoughtspot offers 3 major pricing packages:
Essentials
Pro
Enterprise
Here’s a breakdown:
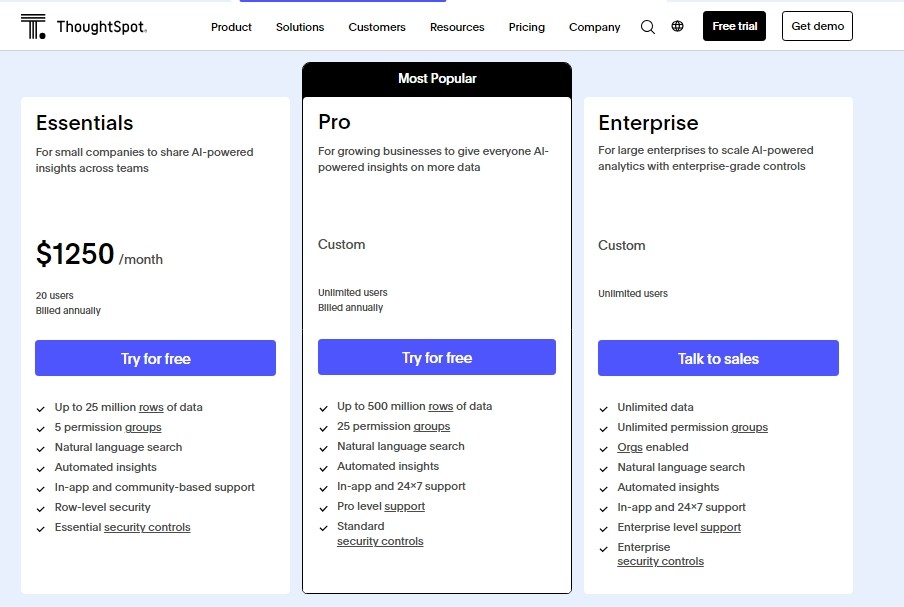
Essentials Plan - $1,250/month
This plan is perfect for small companies wanting to share AI-powered insights across their teams.
It includes:
Up to 25 million rows of data.
20 users with 5 permission groups for secure access control.
Features like natural language search and automated insights.
Basic support through in-app and community channels.
Essential security controls, including data encryption.
Pro Plan - Custom Pricing
Tailored for growing businesses looking to scale their analytics and data handling.
Features include:
Support for up to 500 million rows of data.
Unlimited users and 25 permission groups.
Advanced security controls with Pro-level support available 24/7.
Automated insights and AI-powered search capabilities.
Standard support options with additional layers of security.
Enterprise Plan - Custom Pricing
Suited for large enterprises with high data needs and advanced security requirements.
Key offerings:
Unlimited data and permission groups supporting multi-tenant setups.
Advanced security features, including enterprise-grade encryption.
Comprehensive support with dedicated 24/7 assistance.
Full access to ThoughtSpot’s API for in-depth customization and integration.
Ideal for complex deployments and high scalability, including on-premise or cloud-hosted options.
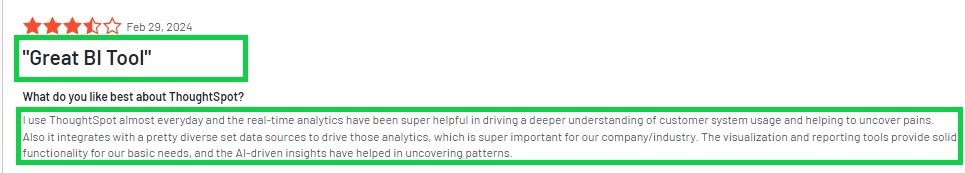
Pros and Cons of ThoughtSpot
Pros
Ease of Use: Users appreciate how simple and intuitive it is to explore data and generate insights without technical expertise.
Natural Language Search: The standout feature allows users to query data conversationally, making analytics more accessible.
Speed of Insights: ThoughtSpot’s fast data retrieval and processing make it ideal for real-time decision-making.
Self-Service Analytics: Enables non-technical users to conduct their own analyses, reducing the dependency on IT teams or data analysts.
Flexible Data Connections: Seamlessly integrates with multiple data sources, including data lakes and cloud storage, for diverse analytics.
Cons
Steep Learning Curve: While the tool is intuitive for simple tasks, more advanced features can be challenging for new users to master.
Limited Visualization Options: Compared to competitors like Tableau, ThoughtSpot's visualization capabilities are somewhat basic and less customizable.
Data Modeling Challenges: Setting up and maintaining the necessary data structures can be complex, requiring significant effort and expertise.
High Cost: ThoughtSpot's pricing model can be prohibitive, especially for smaller businesses or those with tight budgets.
Performance Issues: Some users report slow performance, particularly for complex queries or larger datasets.
Summary Of ThoughtSpot
ThoughtSpot is an AI-driven analytics platform designed to simplify data exploration and visualization through natural language queries.
With features like self-service search, real-time insights, and robust integration with diverse data sources, ThoughtSpot makes analytics accessible for non-technical users.
ThoughtSpot is best suited for:
Businesses prioritizing ad-hoc, self-service analytics for non-technical teams.
Organizations who need fast, search-based insights without heavy reliance on IT.
Companies with well-structured data looking to enable simple yet powerful data exploration.
If you want to empower your teams with intuitive, search-driven analytics, ThoughtSpot could be a great fit for your business.

Looker
Looker is a business intelligence tool built on Google Cloud that helps you analyze and share real-time data insights.
You can use it to create interactive dashboards, custom data applications, or even monetize your data.
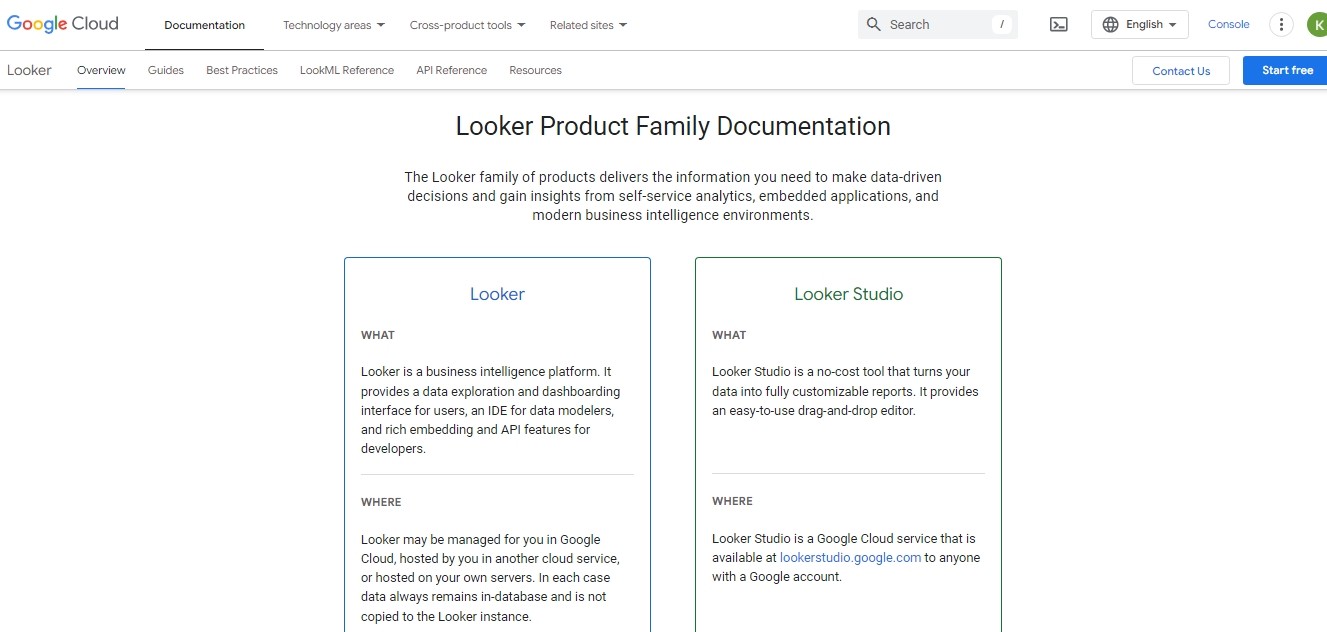
Whether you're a small business or a large enterprise, Looker makes data accessible and actionable.
Key Features Of Using Looker
Data Exploration: You can ask questions and explore data using Looker’s intuitive interface. It supports both simple queries and more advanced analysis.
Customizable Dashboards: Build interactive dashboards to visualize key metrics in real-time. For example, you can track sales performance across multiple regions on one screen.
Embedded Analytics: You can embed Looker’s analytics into your own applications, making it easier to share insights directly with your team or customers.
Seamless Integrations: Looker connects with over 800 data sources, including Google BigQuery, Salesforce, and SQL databases.
AI-Powered Insights: With tools like Looker Studio, you can perform advanced analysis with minimal effort, thanks to built-in AI capabilities.
Looker Pricing Breakdown
Looker’s pricing is not fixed. It is tailored based on your organization’s needs
However, here’s what I found regarding the major pricing packages they offer.
1. Standard Edition
Designed for smaller teams with fewer than 50 users.
Includes:
One main setup (production instance).
10 Standard Users.
2 Developer Users.
1,000 query-based API calls per month.
1,000 admin API calls per month.
Pricing: Contact Looker’s sales team for custom pricing.
2. Enterprise Edition
Built for larger teams needing enhanced security features.
Includes:
One main setup (production instance).
10 Standard Users.
2 Developer Users.
100,000 query-based API calls per month.
10,000 admin API calls per month.
Pricing: Custom quote available through Looker’s sales team.
3. Embed Edition
Ideal for embedding analytics in customer-facing applications.
Includes:
One main setup (production instance).
10 Standard Users.
2 Developer Users.
500,000 query-based API calls per month.
100,000 admin API calls per month.
Pricing: A custom quote from Looker’s sales team is required.
Pros And Cons Of Using Looker
Pros
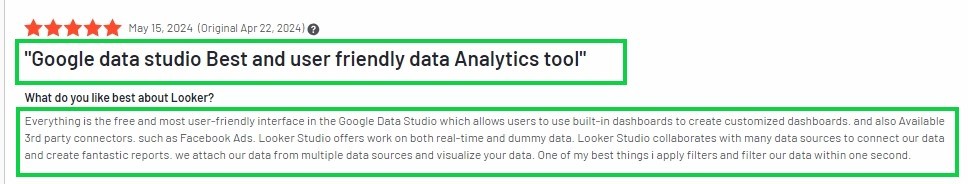
Ease of Use for Non-Technical Users: Looker’s drag-and-drop interface allows anyone to create dashboards without requiring advanced technical skills. For example, marketers can quickly create reports without needing SQL expertise.
Seamless Data Integration: Looker connects with multiple data sources like BigQuery, Google Ads, and SQL databases, ensuring you can analyze all your data in one place.
Centralized Data Models: Looker uses LookML, which provides a consistent and governed data model. This ensures uniform calculations across your organization, reducing discrepancies in data interpretation.
Real-Time Analytics: Looker supports real-time data analysis, which is especially useful for businesses needing up-to-date insights for decision-making, like monitoring ad campaign performance.
Customizable Dashboards: You can create dashboards tailored to your specific business needs, with options for interactive and visual data exploration.
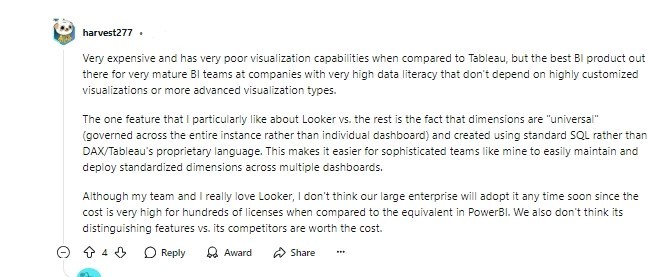
Cons
Steep Learning Curve: Advanced features like LookML require knowledge of SQL, which might be challenging for non-technical users initially.
Dependency on Internet Connectivity: Looker is a cloud-based platform, meaning you need a stable internet connection to access and update data. Offline functionality is not supported.
Performance Issues with Large Data Sets: When dealing with massive data sets, Looker’s performance may slow down, especially if the backend data warehouse isn't optimized.
High Cost for Enterprises: Looker’s pricing model can be expensive, particularly for large organizations needing licenses for multiple users.
Limited Third-Party Integrations: While Looker integrates seamlessly with Google services, it lags behind competitors like Tableau in supporting non-Google platforms, such as Facebook Ads.
Summary Of Looker
Looker is a business intelligence platform from Google Cloud that helps you turn raw data into actionable insights.
With its seamless integration with tools like BigQuery, Google Analytics, and Google Ads, Looker is designed to unify data and enable collaboration through intuitive dashboards and reports.
Looker is best suited for:
Teams using Google Cloud tools like BigQuery for seamless data analysis.
Organizations needing real-time insights and governed data models to ensure consistent metrics.
Businesses looking for an easy-to-use platform for both technical and non-technical users.
If your focus is on leveraging data within the Google ecosystem and creating a single source of truth, Looker might be the right fit for you.
Qlik Sense
Qlik Sense is a business intelligence tool designed to help you explore, analyze, and visualize data interactively.
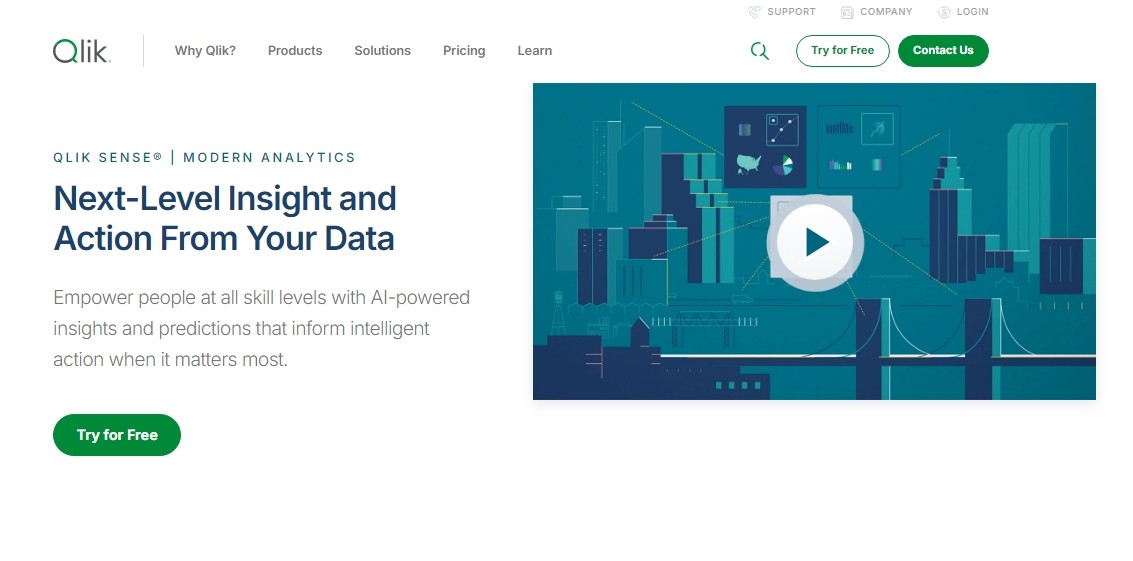
It uses an Associative Engine, which lets you freely navigate your data, uncovering hidden patterns and connections that traditional query-based tools might miss.
Key Features of Qlik Sense
Interactive Dashboards: You can build dynamic dashboards that allow you to drill down into data and uncover insights in real-time.
AI and Machine Learning Integration: Qlik Sense provides AI-powered tools to assist with predictive analytics and natural language queries. You can ask questions like "What were my top-performing products last quarter?" and get instant answers.
Flexible Data Integration: Qlik Sense integrates with various platforms like Google Analytics, Salesforce, and Snowflake.
Collaboration Features: You can share dashboards and reports with your team, enabling everyone to access real-time insights for decision-making.
Cloud and On-Premise Options: Whether you prefer cloud-based or on-premise deployment, Qlik Sense provides both options, giving you the flexibility to choose what suits your needs.
Qlik Sense Pricing Breakdown
Qlik Sense offers tiered pricing based on your business needs.
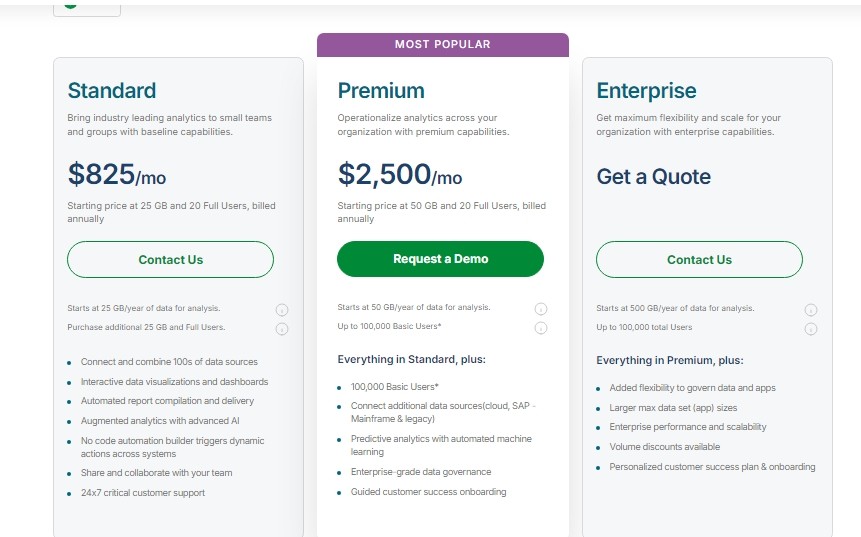
1. Standard Plan
Designed for small teams or groups, the Standard plan starts with 25 GB of annual data for analysis and 20 Full Users.
Features include:
Interactive data visualizations, automated reporting, and AI-powered analytics.
Access to a no-code automation builder to streamline actions across systems.
24/7 critical customer support for added peace of mind.
$825/month, billed annually
2. Premium Plan
Built for larger teams, the Premium plan starts with 50 GB of data and scales up to 100,000 Basic Users along with the original 20 Full Users.
Includes everything in the Standard plan, plus:
Expanded data sources, such as SAP, mainframe, and legacy systems.
Predictive analytics powered by machine learning and advanced governance.
A guided customer success onboarding to get teams up and running smoothly.
$2500/month, billed annually
3. Enterprise Plan
For organizations with extensive data needs, the Enterprise plan offers a starting capacity of 500 GB and scales to accommodate up to 100,000 users.
Adds extra features beyond the Premium plan, such as:
Higher performance, scalability, and larger app sizes.
Volume discounts, enhanced data governance, and a customized onboarding plan.
Custom Pricing
Pros And Cons Of Using Qlik Sense
Pros
Dynamic Data Exploration: Qlik Sense’s Associative Engine enables you to explore data freely, uncovering hidden patterns and insights that traditional query-based tools like Tableau might miss.
Self-Service Analytics: Users can independently access and analyze data without relying on IT support, making it easy for departments like marketing to generate campaign insights on demand.
Seamless Integration with Multiple Data Sources: Qlik Sense connects with databases, CRMs, and other tools like SAP and Salesforce, allowing you to consolidate data for a complete view of your business.
Collaboration Features: Qlik Sense lets you share dashboards and reports in real-time, helping teams work together effectively and stay aligned on goals.

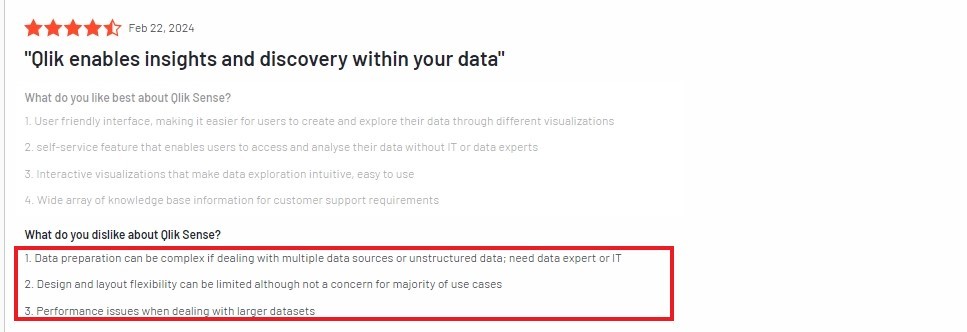
Cons
Steeper Learning Curve for Advanced Features: While the interface is user-friendly, mastering complex visualizations and scripting in Qlik Sense requires additional training or experience.
Performance Issues with Large Datasets: Qlik Sense may experience slower performance when handling large volumes of data, which can impact real-time analysis.
Limited Customization Options: Advanced users might find the customization for visualizations and layouts somewhat restricted compared to Tableau.
High Licensing Costs: For smaller businesses, the pricing can be a challenge, especially when scaling to multiple users.
Summary Of Qlik Sense
Qlik Sense is a data analytics and visualization platform designed to help businesses turn complex data into actionable insights.
With its associative data model and AI-driven insights, Qlik Sense enables users to explore data intuitively, uncover hidden relationships, and make informed decisions.
Qlik Sense is best suited for:
Businesses that require powerful data visualization and exploration tools.
Organizations seeking AI-powered analytics to uncover insights faster.
Teams looking for a user-friendly platform that supports both technical and non-technical users.
If your focus is on creating interactive dashboards, exploring complex data relationships, and leveraging AI for analytics, Qlik Sense could be the ideal choice for your organization.
Conclusion: Which Tableau Alternative Should You Choose?
Choosing the right business intelligence tool depends on your organization’s specific requirements, budget, and technical ecosystem.
Tableau has set a high bar in the analytics space, but it isn’t always the perfect fit, particularly for those seeking cost-effective, customizable, or intuitive embedded analytics solutions.
If you need:
Fast Deployment and Customer-Facing Analytics: Upsolve AI is an excellent choice, simplifying the process of embedding analytics into your applications with minimal effort.
Search-Driven Insights: ThoughtSpot excels with its natural language search and real-time insights, making it ideal for non-technical teams.
Microsoft Integration: Power BI is the go-to tool if you already use Microsoft tools like Excel and Teams.
Enterprise-Level Modeling: Looker provides robust AI tools and a semantic layer for detailed and governed analytics.
Dynamic Data Exploration: Qlik Sense stands out with its Associative Engine, allowing free-form data discovery and visualization.
For businesses prioritizing customer-facing analytics, seamless embedding, and AI-powered insights, Upsolve AI delivers an unmatched combination of simplicity and value.
It’s tailored for startups, growing businesses, and enterprises looking to enhance user experiences with interactive dashboards and actionable insights.
If you’re ready to revolutionize your analytics approach and empower your users, give Upsolve AI a try today. It might just be the BI solution your business needs to achieve its goals.

Try Upsolve for Embedded Dashboards & AI Insights
Embed dashboards and AI insights directly into your product, with no heavy engineering required.
Fast setup
Built for SaaS products
30‑day free trial


