
Explore AI business intelligence tools, comparing features, pricing, use cases, and which platforms fit customer-facing analytics or internal reporting needs.

Ka Ling Wu
Co-Founder & CEO, Upsolve AI
10 min

AI business intelligence tools are changing how teams analyze data and make decisions. Instead of manually building reports, these tools use AI to identify patterns, predict outcomes, and surface insights automatically.
If you are a founder, CTO, business analyst, or product manager, you have likely felt the gap between having data and being able to act on it quickly. Traditional BI tools show what happened. AI-powered BI tools help explain why it happened and what to do next.
Not all AI Business Intelligence tools are built for the same use cases. Some focus on customer-facing analytics and embedded dashboards, while others are designed for internal reporting, advanced visualization, or enterprise-scale analysis.
In this guide, you will find a practical comparison of leading AI business intelligence tools, covering features, pricing, and ideal use cases to help you choose the right option.
What Is AI Business Intelligence?
AI Business Intelligence (AI BI) combines traditional business intelligence with artificial intelligence to help you analyze data, find patterns, and generate insights automatically.
Here’s how it works:
Traditional BI tools present data in reports, charts, and graphs.
AI BI takes it further by understanding the data and providing actionable insights.
Instead of just showing sales numbers, for example, AI BI can explain why sales increased or predict future trends.
With AI BI, you don’t just look at data—you get answers. It simplifies decision-making by automating complex analysis.
How AI Enhances Traditional Business Intelligence
Traditional BI tools focus on looking at historical data. AI BI adds a predictive layer, making it easier to act on data.
Here’s how it enhances the process:
Real-Time Insights: AI BI processes data in real time. For example, if sales in one region drop suddenly, you’ll know immediately and can adjust your strategy.
Predictions for the Future: Let’s say you manage an online store. Traditional BI might show you which products sold well last month. AI BI predicts which products are likely to sell next month so you can stock up in advance.
Natural Language Queries: You don’t need to be a data expert to use AI BI. You can ask questions like, “What were our top-performing products last year?” The tool gives you an instant, clear answer.
Time-Saving Automation: Instead of spending hours preparing reports, AI BI tools generate them instantly. This frees up your time to focus on strategy.
With AI Business Intelligence, you move beyond just understanding what happened in the past. You gain the ability to predict what’s coming next and take immediate action.
5 Best AI Business Intelligence Tools Compared
Here’s a list of the top tools:
Upsolve AI
Tableau With Einstein Discovery
Microsoft Power BI
ThoughtSpot
Qlik Sense
Before we get into the details, here’s a quick reference table to help you understand the main differences between each.
Feature and Pricing Comparison
Metric | Upsolve AI | Tableau | Power BI | ThoughtSpot | Qlik Sense |
Key Features | AI-powered insights, embedded dashboards, drag-and-drop builder | Predictive analytics with Einstein Discovery, real-time data, advanced visualizations | AI-driven insights, natural language queries, Microsoft ecosystem integration | Natural language search, AI-driven insights, real-time querying | Associative engine, AI-powered insights, dynamic visualizations |
Ease of Use | Very easy, fast setup, no-code | Easy for basics, steep learning curve for advanced features | Easy for basics, advanced features require training | Simple search interface, requires proper data modeling | Intuitive exploration, advanced scripting requires expertise |
Integration | Native embedding with React and Vue | Cloud and on-premise data sources | Deep integration with Excel, Azure, Microsoft Fabric | Cloud data platforms like Snowflake and BigQuery | SAP, Salesforce, legacy and hybrid systems |
Scalability | Scales from startups to large SaaS platforms | Suitable for teams and enterprises | Scales via Pro, Premium, and Embedded plans | Designed for enterprise-scale datasets | Built for small teams to large enterprises |
Pricing | Free tier; Pro $500/mo; Team $2,000/mo for embedding, RBAC, and multi-tenant; Enterprise custom (usage-based credit pricing) | Creator: $75/user/month | Explorer: $42/user/month | Viewer: $15/user/month | Enterprise: from €115/user/month | Free: $0 | Pro: $14/user/month | Premium (Per User): $24/user/month | Embedded: Variable | Essentials: $25/user/month | Pro: $50/user/month | Enterprise: Custom | Starter: $200/month | Standard: $825/month | Premium: $2,750/month | Enterprise: Custom |
Best For | SaaS teams needing fast, customer-facing embedded analytics | Enterprises needing advanced visualization and predictive analytics | Microsoft-centric teams needing affordable BI | Non-technical users seeking search-driven insights | Teams prioritizing associative exploration and governance |
Let’s get into it.
Upsolve AI
Upsolve AI is an AI business intelligence tool that focuses on customer-facing analytics. It allows you to build dashboards and embed them into your application so your users can access insights directly.
For instance, if you run a SaaS platform, your customers might want to see how their data is performing.
Upsolve AI enables you to deliver these insights with minimal effort. Instead of spending months building analytics features, you can set everything up in just one day.
Key Features
Here’s what makes Upsolve AI a strong choice:
Quick Deployment: You can create and deploy dashboards in a single day. For example, A startup can integrate analytics for their product users immediately after launching.
AI-Powered Insights: The tool uses AI to identify trends, patterns, and risks, helping your users understand their data better.
Drag-and-Drop Interface: No technical expertise is needed. You can create dashboards using a simple drag-and-drop builder.
Embedded Analytics: Upsolve AI makes it easy to embed dashboards into your application using React or Vue components. Your users can view analytics without leaving your platform.
Usage Analytics: Monitor how users interact with the dashboards. This helps you improve their experience and understand what’s working.
Upsolve AI Pricing Breakdown
Upsolve AI offers a free plan plus three paid tiers; embedding and multi-tenant analytics start on the Team plan ($2,000/mo).
Free ($0): 2,000 one-time credits (~200 questions); all Pro features, to test-drive
Pro ($500/mo): 2,000 credits/month; 50+ data connections, unlimited agents, full observability
Team ($2,000/mo): 10,000 credits/month; adds embedding, RBAC/row-level security, multi-tenant, and semantic-layer generation
Enterprise (custom): on-prem/VPC, SAML SSO, HIPAA, SOC 2, and BYOM
Annual billing is 20% off.
Pros And Cons
Pros
Quick Setup: Users reported that dashboards can be deployed in just one day, saving time and reducing development effort.
Customer-Focused Analytics: Users said Upsolve AI helps their customers get actionable insights directly from the platform, improving engagement and retention.
Ease of Use: Many users highlighted the drag-and-drop interface, which allows teams without technical expertise to build professional dashboards easily.
Seamless Embedding: Users said embedding dashboards into their applications was straightforward with Upsolve AI's React and Vue components.
Improved Customer Insights: Users reported gaining a better understanding of their customers’ behavior through usage analytics, helping them improve their product offerings.
Scalable for Growth: Users said the pricing plans and features allowed their businesses to scale as their needs grew, making Upsolve AI a long-term solution.
Cons
Limited Internal Analytics: Users said Upsolve AI focuses heavily on customer-facing analytics, which might not fully support internal business analytics needs.
Customization Constraints: Some users reported that while Upsolve AI offers customization, it may not meet the needs of businesses requiring highly tailored visualizations or advanced features.
✔️ So, Upsolve AI offers quick deployment, seamless integration, and an easy-to-use drag-and-drop interface, making it ideal for quickly and efficiently creating customer-facing dashboards.
❌ However, it does have some limitations, such as a stronger focus on external analytics rather than internal reporting and less flexibility for advanced customization.
Despite these challenges, it’s a solid choice for businesses prioritizing external data insights and scalable customer-facing analytics solutions.
Tableau
Tableau, now part of Salesforce, is a well-known AI business Intelligence tool for creating interactive dashboards and data visualizations.
With Einstein Discovery, Tableau adds machine learning capabilities to deliver predictions and recommendations directly within your workflows.
Key Features of Tableau with Einstein Discovery
Here are the key features that make Tableau with Einstein Discovery stand out:
Drag-and-Drop Interface: You can create dashboards and reports quickly, even without technical skills. Simply drag and drop elements to build visuals.
Real-Time Data Updates: Tableau connects to multiple data sources, ensuring your dashboards always display the most recent information.
Predictive Analytics with Einstein Discovery: You can embed predictive models into Tableau to forecast outcomes or suggest the best action for specific scenarios.
Transparent and Ethical AI: Einstein Discovery includes features that reduce bias and explain predictions, so you can confidently make decisions.
Collaboration and Sharing: Tableau makes sharing dashboards with team members or clients easy, enabling better collaboration and decision-making.
Tableau Pricing Plans Breakdown
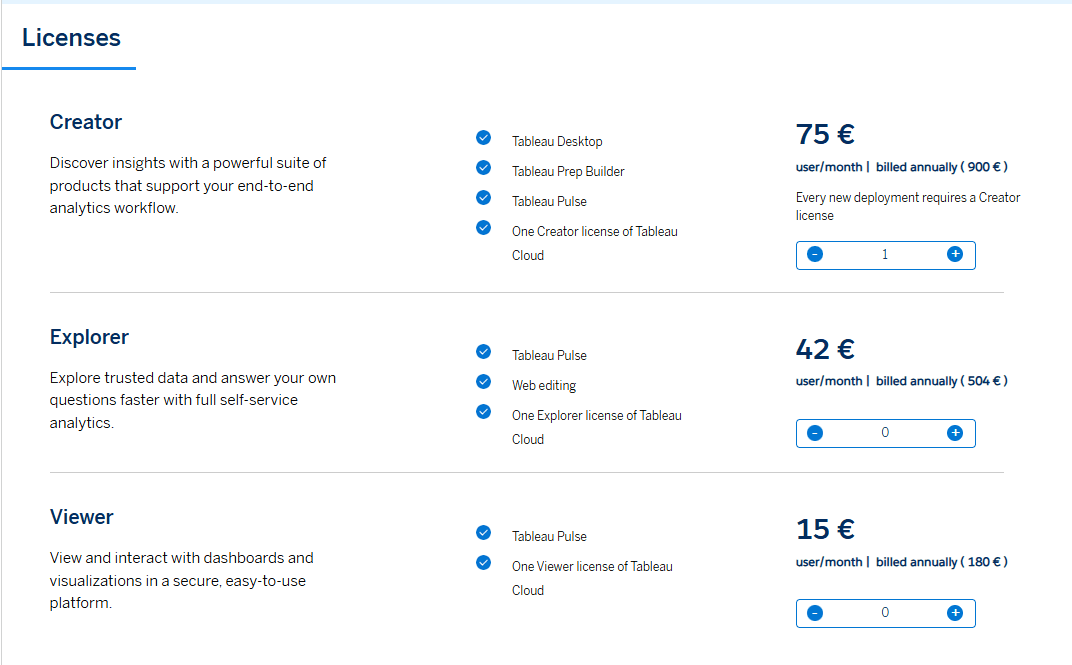
Tableau Creator
Designed for users who create and manage dashboards.
$75 per user per month (billed annually)
Includes:
Tableau Desktop for building dashboards
Tableau Prep Builder for data preparation
Full dashboard creation and publishing
Publishing to Tableau Cloud or Tableau Server
Best suited for analysts and teams responsible for building reports.
Tableau Explorer
Designed for users who analyze existing dashboards.
$42 per user per month (billed annually)
Includes:
Access to dashboards via Tableau Cloud or Tableau Server
Ability to filter, drill down, and explore data
Create saved views from existing dashboards
Ideal for managers and business users who need insights without building dashboards.
Tableau Viewer
Designed for users who only need to view dashboards.
$15 per user per month (billed annually)
Includes:
View-only access to published dashboards
Apply filters, receive alerts, and subscribe to reports
Best for stakeholders who consume reports but don’t interact deeply with data.
Tableau Enterprise Plan
Designed for large organizations that need advanced governance, security, and scalability.
Pricing:
Starts at €115 per user per month (billed annually) for the Creator license
Explorer licenses cost €70 per user per month (billed annually)
Viewer licenses cost €35 per user per month (billed annually)
Final pricing depends on team size, deployment model, and enterprise requirements
Includes everything in standard Tableau plans, plus advanced data management, security controls, and enterprise administration features.
Pros And Cons
Pros
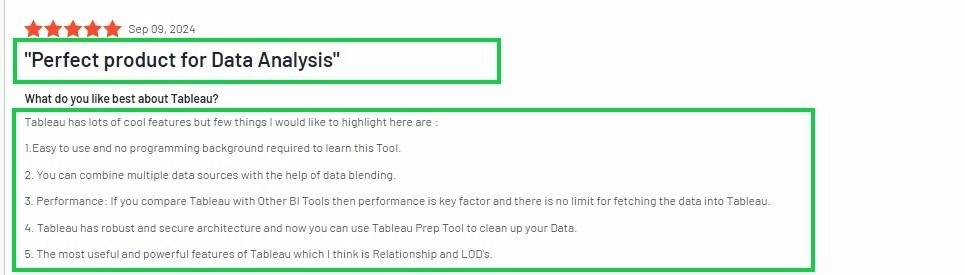
Easy Data Visualization: Users praised Tableau for its drag-and-drop interface, making it simple to create stunning visualizations and interactive dashboards without needing technical expertise.
Data Integration Flexibility: Many users appreciated Tableau's ability to seamlessly connect with various data sources, such as Excel, databases, and cloud platforms, enabling comprehensive data analysis.
User-Friendly Experience: Users reported that Tableau’s intuitive design helps non-technical team members quickly adapt and utilize its features effectively, even with minimal training.
Real-Time Insights: Tableau’s integration with live data sources provides users with up-to-date information, allowing them to make timely and informed decisions.
Cons
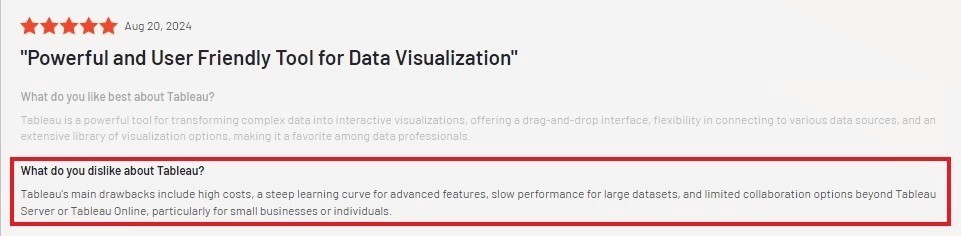
High Cost: Users mentioned that Tableau's pricing can be a barrier, especially for small businesses or startups. The licensing fees add up quickly when scaling across teams.
Performance Issues: Users reported that Tableau struggles with large datasets, leading to slower performance and lag, which can hinder efficiency during analysis.
Steep Learning Curve for Advanced Features: While the basic interface is user-friendly, many users found the advanced functionalities require significant training and expertise to use effectively.
✔️ Tableau makes data visualization simple with its drag-and-drop interface, seamless data integration, and real-time insights, making it a user-friendly tool for creating interactive dashboards.
❌ However, it comes with challenges like high costs, performance issues with large datasets, and a steep learning curve for advanced features.
Microsoft Power BI With AI Builder
Microsoft Power BI is a business intelligence tool designed to transform raw data into meaningful insights through interactive dashboards and reports.
When paired with AI Builder, it goes beyond visualization, enabling you to integrate AI-driven capabilities directly into your analytics workflows.
Whether you’re identifying trends, making predictions, or automating repetitive processes, Power BI with AI Builder simplifies AI business intelligence for all users, even those without technical expertise.
Key Features of Power BI with AI Builder
AI-Powered Insights: AI Builder in Power BI allows you to use prebuilt models or create custom AI models for tasks like sentiment analysis, prediction, and object detection.
Seamless Data Integration: Power BI connects effortlessly to multiple data sources, such as Excel, cloud platforms, and SQL databases.
Interactive Dashboards: Using its drag-and-drop interface, Power BI makes it easy for you to create dynamic, interactive dashboards.
Real-Time Updates: With live connections to your data sources, Power BI ensures that your reports and dashboards always display the latest information.
Embedded Analytics: Power BI Embedded enables you to integrate reports directly into your applications, offering your customers a seamless experience.
No-Code AI: AI Builder provides a no-code interface to create AI models, making it accessible even for non-technical team members. You can easily automate tasks like document processing or image recognition without writing a single line of code.
Microsoft Power BI Pricing Breakdown
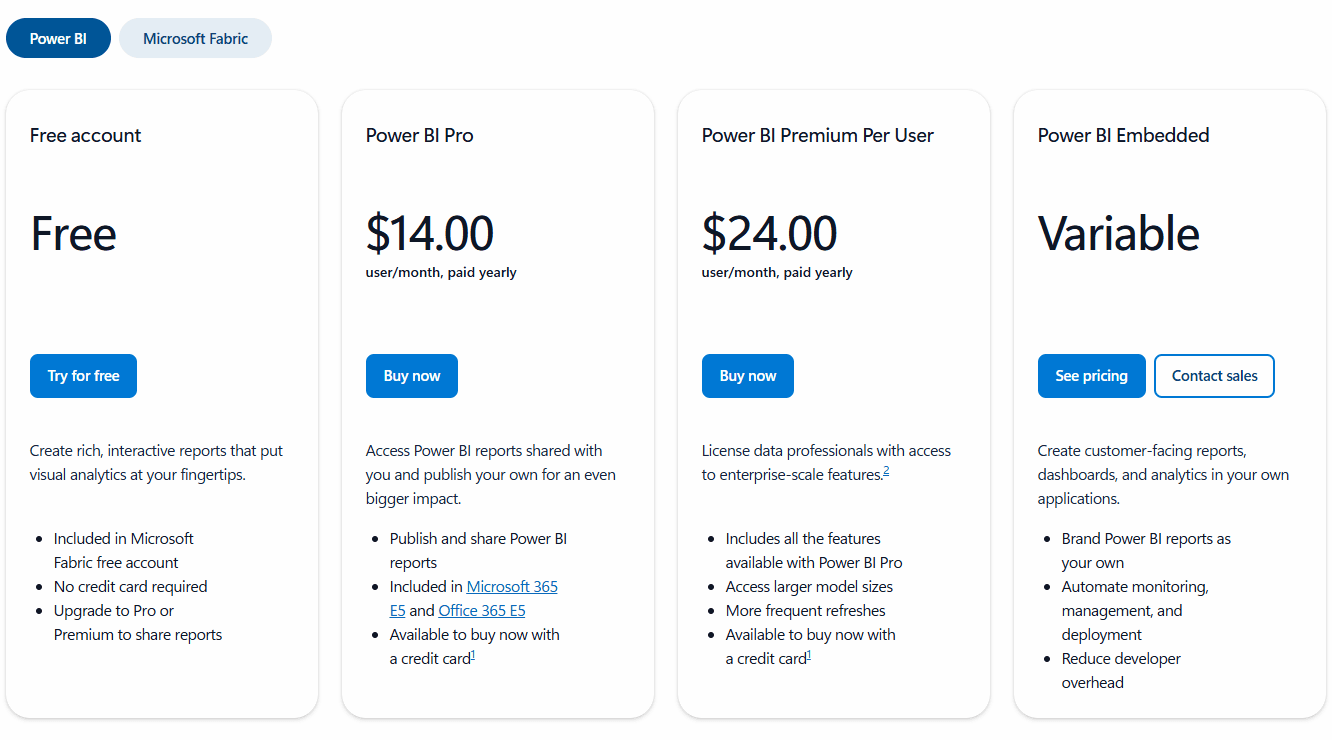
1. Power BI Free
Create rich, interactive reports for personal use
Suitable for individual users exploring data
Included with Microsoft Fabric free account
Free
2. Power BI Pro
Share reports and dashboards across your team
Publish, collaborate, and manage Power BI content
Included with Microsoft 365 E5 and Office 365 E5
$14 per user per month (paid yearly)
3. Power BI Premium (Per User)
Includes all Power BI Pro features
Access to larger data models and more frequent refreshes
Designed for advanced analytics and enterprise-scale workloads
$24 per user per month (paid yearly)
4. Power BI Premium (Capacity-Based)
Create customer-facing reports and dashboards inside your own applications
Brand Power BI analytics as your own product
Automate monitoring, management, and deployment
Reduce development overhead for embedded analytics
Variable pricing, based on usage and capacity (contact sales)
Pros And Cons
Pros
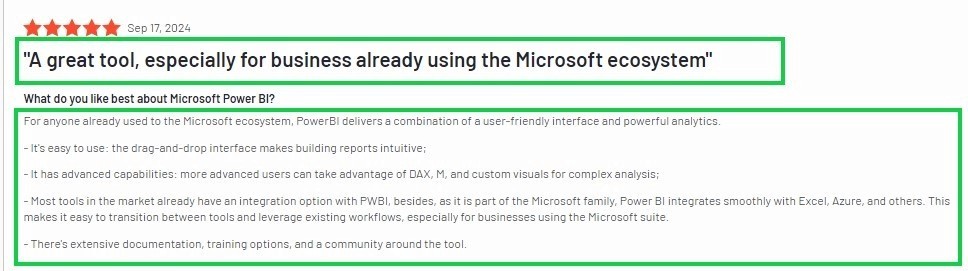
Seamless Integration: Users appreciated how Power BI works effortlessly with other Microsoft tools like Excel and Azure.
Interactive Dashboards: Users love the interactivity of Power BI dashboards. They mentioned how simple it is to apply filters, dive into specific details, and get instant insights without technical barriers.
User-Friendly Interface: Users said Power BI’s drag-and-drop functionality makes creating visuals easy—even for those without a technical background.
Data Connectivity: Users appreciated the ability to connect Power BI with multiple data sources, including SQL Server, SharePoint, and cloud platforms.
Cons
Steep Learning Curve for Advanced Features: Users said while the basic interface is easy to use, mastering advanced functionalities like DAX and Power Query requires significant effort and structured training.
Performance Issues with Large Data: Users appreciated the tool's capabilities but mentioned that Power BI can struggle with large datasets. They said working with high volumes of data sometimes causes delays and slower query execution.
Cloud Dependency: Users love the collaboration options but pointed out that Power BI relies heavily on cloud services for sharing and managing reports, which may not suit every organization’s infrastructure
✔️ Power BI stands out for its seamless integration with Microsoft tools like Excel and Azure, interactive dashboards, user-friendly drag-and-drop functionality, and the ability to connect with multiple data sources.
❌ However, users mentioned a steep learning curve for advanced features like DAX and Power Query. Performance issues with large datasets and heavy reliance on cloud services for sharing reports can be inconvenient for some organizations.
ThoughtSpot
ThoughtSpot is an AI-powered business intelligence tool that helps you analyze data and gain insights using natural language search.
With its AI-driven features, ThoughtSpot makes it easy to query data, uncover patterns, and make informed decisions—even if you’re not a data expert.
Key Features
Natural Language Search: Ask any question in plain English, like “What were my top sales regions last quarter?” and get instant insights.
Real-Time Data Querying: Connect directly to your cloud data platforms and access live data updates without delays.
Scalable Data Handling: Handle billions of rows of data effortlessly, making it ideal for enterprises with large datasets.
Interactive Liveboards: Create live, interactive dashboards to visualize data and drill down into specifics without predefined drill paths.
Embedded Analytics: Embed ThoughtSpot’s analytics into your applications, offering users seamless, real-time insights.
AI-Driven Insights: Use ThoughtSpot’s AI features like SpotIQ to identify anomalies, detect trends, and uncover hidden patterns automatically.
ThoughtSpot Pricing Breakdown
Thoughtspot offers 3 major pricing packages:
Essentials
Pro
Enterprise
Here’s a breakdown:
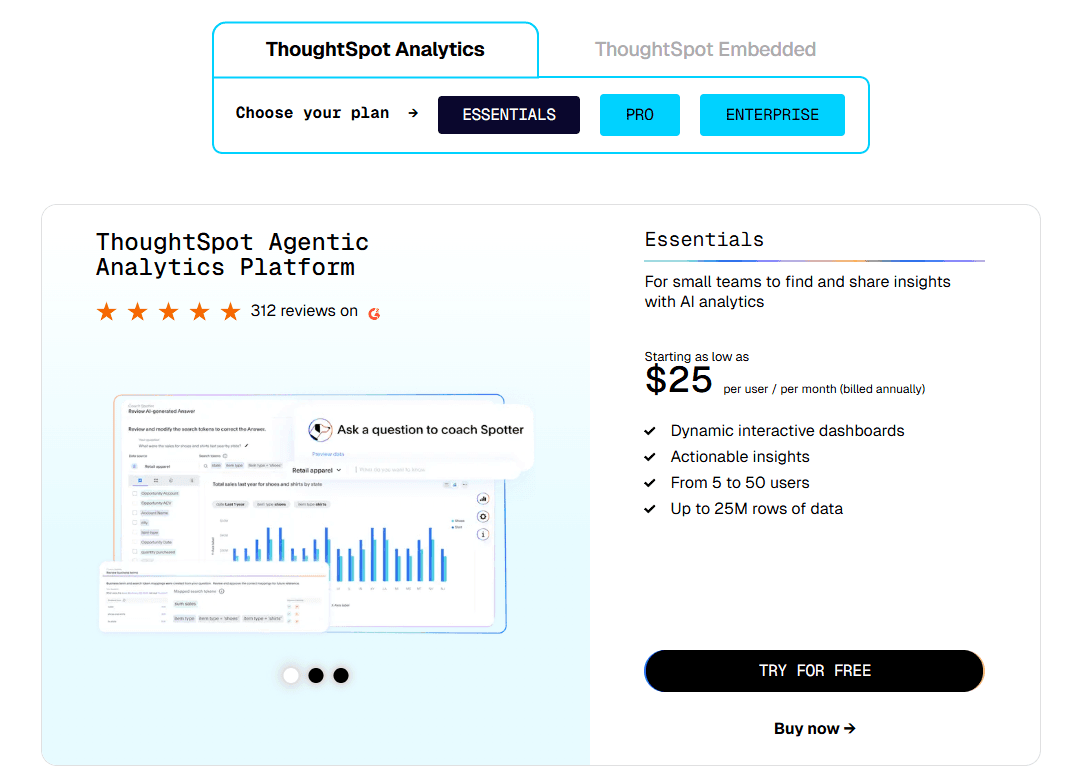
Essentials Plan
Designed for small teams to find and share insights with AI analytics.
Dynamic interactive dashboards
Actionable AI-powered insights
Supports 5 to 50 users
Up to 25 million rows of data
$25 per user per month (billed annually)
Pro Plan
Built for growing teams using agentic AI analytics to drive decisions.
Dynamic AI-infused dashboards
Spotter AI Agent (25 queries per user per month)
Supports 25 to 1,000 users
Up to 250 million rows of data
$50 per user per month (billed annually)
Enterprise Plan
Designed for large organizations with advanced analytics and scale requirements.
Dynamic AI-infused dashboards
Spotter AI Agent
Unlimited users
Unlimited data
Advanced security, governance, and deployment options
Custom pricing (contact sales)
Pros and Cons
Pros
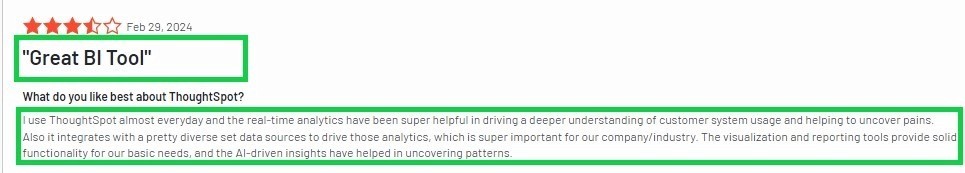
User-Friendly Search Feature: Users appreciated the ability to ask data questions using natural language.
Speedy Data Retrieval: Users said ThoughtSpot’s speed in fetching data was unmatched. It’s especially useful when you need answers fast without waiting for complex processes.
Self-Service Analytics: ThoughtSpot empowers users to explore and analyze data on their own. Users found this particularly helpful in reducing dependency on IT teams for basic queries.
Direct Connection to Data Sources: Users highlighted how ThoughtSpot connects directly to data lakes and tables.
Cons
Limited Visualization Options: Users said the charting and visualization features are quite basic. Adjusting chart sizes or customizing liveboards is often frustrating, leaving much to be desired.
Steep Learning Curve: Users appreciated the innovative features but noted that ThoughtSpot isn’t always intuitive. New users, especially those unfamiliar with BI tools, may take time to get comfortable.
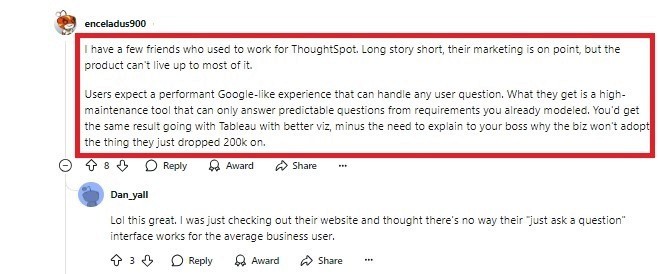
Heavy Data Preparation Needed: Users mentioned that ThoughtSpot requires data to be properly modeled and curated. Without a solid setup, the tool can struggle to deliver meaningful insights.
High Costs for Larger Use Cases: Some users said the pricing, while capacity-based, can escalate quickly for larger organizations. If cost is a concern, explore ThoughtSpot alternatives.
✔️ ThoughtSpot shines with its natural language search, speedy data retrieval, self-service analytics, and seamless connection to data lakes and tables, making it ideal for independent data exploration.
❌ However, users pointed out limited visualization options, a steep learning curve for beginners, heavy data preparation requirements, and escalating costs for larger organizations.
Qlik Sense
Qlik Sense is a powerful business intelligence tool designed for interactive data visualization and analysis. It enables organizations to uncover insights and make data-driven decisions with ease.
For example, if you’re managing a retail chain, Qlik Sense allows you to analyze sales data, track inventory, and identify trends—all through a user-friendly interface.
Key Features
Here’s what makes Qlik Sense a popular choice:
Associative Engine: Unlike traditional BI tools, Qlik Sense uses an associative model, allowing users to explore data relationships intuitively.
Self-Service Analytics: Qlik Sense empowers users to create their own dashboards and reports without relying on IT teams, ensuring faster access to insights.
Smart Visualizations: The tool offers dynamic visualizations that automatically adjust to the data context, making it easier to spot patterns and trends.
Multi-Device Support: Qlik Sense dashboards are optimized for desktops, tablets, and smartphones, enabling users to access data on the go.
Advanced Security Features: With granular control over data access, Qlik Sense ensures that sensitive information remains protected while providing appropriate visibility to users.
Qlik Sense Pricing Breakdown
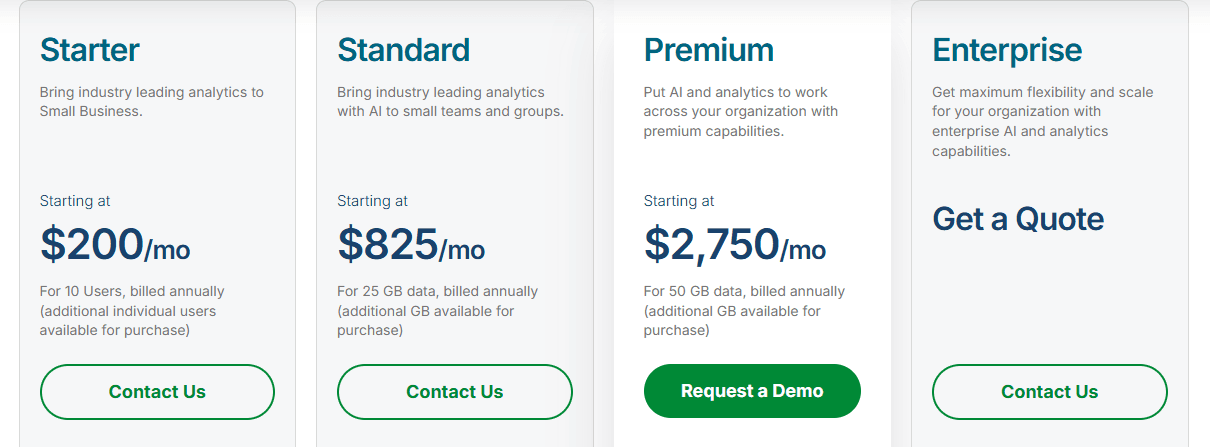
1. Starter Plan
For small businesses getting started with analytics.
Starting at $200 per month (billed annually)
Includes:
Up to 10 users
25 GB of data for analysis
AI-powered analytics
Interactive dashboards and sharing
Standard data connectors
2. Standard Plan
For teams that need AI insights and automation.
Starting at $825 per month (billed annually)
Includes:
25 GB of data (expandable)
AI-powered analytics and GenAI insights
Automated reporting and delivery
No-code automation builder
Broad data source connectivity
3. Premium Plan
For organizations scaling analytics across departments.
Starting at $2,750 per month (billed annually)
Includes everything in Standard, plus:
50 GB of data (expandable)
Predictive analytics with machine learning
Advanced GenAI capacity
SAP and legacy system connectivity
Advanced governance features
4. Enterprise Plan
For large-scale, enterprise deployments.
Custom pricing (Get a quote)
Includes everything in Premium, plus:
250 GB+ of data capacity
Enterprise-grade security and governance
Multi-region and large deployment support
Pros And Cons
Pros
Associative Engine for Insights Discovery: Users appreciated Qlik Sense's unique associative engine, which allows them to uncover relationships in data that traditional query-based tools might miss.
Ease of Use and Accessibility: Users said Qlik Sense offers a user-friendly interface that simplifies data analysis for both beginners and experienced analysts.
Powerful Data Integration: Qlik Sense is praised for its ability to connect seamlessly to various data sources, including spreadsheets, databases, and cloud platforms.
Interactive and Dynamic Visualizations: Users appreciated the dynamic visualizations that adjust automatically to the data context.

Cons
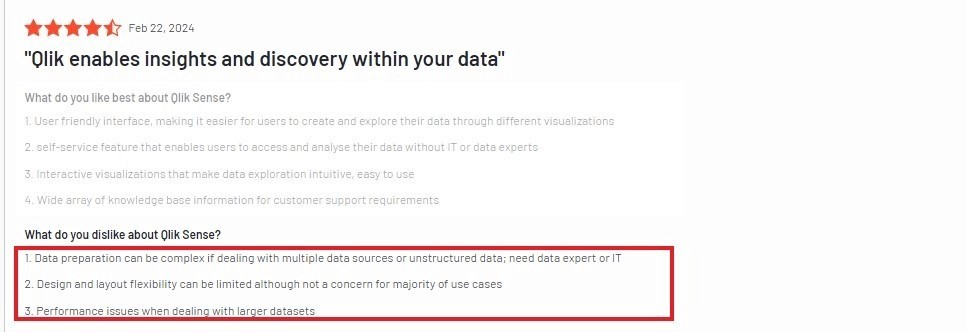
Limited Design Flexibility: Users said Qlik Sense’s design and layout options could feel restrictive. The ability to customize dashboards and visualizations is limited.
Performance Issues with Large Datasets: Users appreciated Qlik Sense’s capabilities but noted that it struggles with performance when handling massive datasets.
Complex Data Preparation Requirements: Users mentioned that working with multiple data sources or unstructured data often requires significant effort in data modeling and preparation.
Steep Learning Curve for Advanced Features: While the interface is user-friendly, users said mastering Qlik Sense’s more advanced features, such as scripting and set analysis, can take time and may require training.

✔️ Qlik Sense stands out with its intuitive interface, robust associative engine, and seamless data integration, empowering users to uncover hidden insights and create dynamic visualizations effortlessly.
❌ However, users found advanced features difficult to master, noted performance issues with large datasets, and expressed concerns about limited design flexibility and higher costs for smaller teams.
Conclusion: Which AI Business Intelligence Tool Should You Choose?
Choosing the right AI business intelligence tool depends on your specific business needs, technical requirements, and budget.
Each tool offers unique features and serves different use cases, making them suitable for varied organizational goals.
If you need:
Fast Deployment and Embedded Dashboards: Upsolve AI is a strong option, offering quick setup, AI-powered insights, and seamless integration for customer-facing analytics.
Visual Excellence and Predictive Analytics: Tableau + Einstein Discovery stands out with high-quality dashboards and advanced AI capabilities designed for enterprise use cases.
Microsoft Ecosystem Integration: Power BI + AI Builder works best for organizations relying on Microsoft tools, providing native compatibility and built-in AI features.
Search-Driven Insights: ThoughtSpot is well suited for non-technical users, offering natural language search and real-time analytics to support faster decision-making.
Flexible Data Exploration: Qlik Sense is known for its associative engine, enabling dynamic visualizations and deeper insights discovery across complex datasets.
Among these options, Upsolve AI is particularly well suited for teams focused on delivering fast, embedded, customer-facing analytics without heavy development effort.
If you are looking to modernize how insights are delivered across your product or organization, Upsolve AI is worth exploring.

Try Upsolve for Embedded Dashboards & AI Insights
Embed dashboards and AI insights directly into your product, with no heavy engineering required.
Fast setup
Built for SaaS products
30‑day free trial


