
Learn how fintech teams use AI-powered BI dashboards to track key metrics, manage risk, and build real-time insights without heavy engineering effort.

Ka Ling Wu
Co-Founder & CEO, Upsolve AI
10 min

Disclosure: This article is published by Upsolve AI. Where our product is mentioned alongside competitors, we aim to provide balanced coverage based on publicly available information. We encourage readers to evaluate all options independently.
You want a Business Intelligence dashboard for your fintech team. Great. But do you know what it actually gets you?
Here’s what a good one does:
Tracks revenue, churn, and compliance in real-time
Aligns every team on one version of the truth
Flags risks early and improves customer experience
Saves hours of manual reporting
But that’s just the start.
A regular dashboard shows you what happened.
An AI-powered one tells you what to do next.
In this blog, you’ll learn:
What a fintech BI dashboard really is
Key metrics to track
How AI makes it smarter
How to build it—no dev team needed
By the end, you’ll know exactly how to launch a dashboard that drives decisions.
Why Fintech Needs a Business Intelligence Dashboard
In fintech, every decision needs to be fast, clear, and correct.
But it’s hard when your data is spread across different tools and spreadsheets.
So, this is why your fintech needs a business intelligence dashboard:
Reason #1: Real-Time Decisions Can’t Wait
Fintech deals with payments, loans, and customers instantly.
A dashboard shows exactly what's happening right now, so you can quickly make good decisions without delays.
Reason #2: Manual Reporting Slows You Down
Copying numbers from different places takes too long and can cause mistakes.
Dashboards do this automatically, giving you updated information without wasting any time.
Reason #3: Teams Need One Source of Truth
When everyone looks at different data, they can make wrong decisions.
A dashboard gives everyone the same clear picture, helping your teams stay focused on the same goals.
Reason #4: Risk and Compliance Can’t Be Ignored
Fintech companies must follow strict rules and watch for fraud.
A dashboard clearly shows risk and compliance data live, so you can quickly spot problems before they grow.
Reason #5: Investors and Stakeholders Want Clear Data
When talking with investors or your board, you need easy-to-understand numbers.
Dashboards help you share data clearly, always showing the most recent and accurate information.
Without a dashboard, you’re only guessing what might work.
But with a BI dashboard, you can see your fintech business and make better choices every day, keeping your company strong and growing safely.
Embedded Analytics vs Business Intelligence: 5 Key Differences
What Is a Business Intelligence Dashboard for Fintech?
A business intelligence dashboard for fintech is a tool that shows your company’s most important numbers in one place and updates them automatically in real time.
It’s different from manual dashboards because:
You don’t need to copy and paste from spreadsheets
It updates live without any extra work
It pulls data from all your tools into one view
Everyone on the team sees the same data, any time
With a BI dashboard, your fintech team can track performance, find issues early, and make smarter choices without waiting.
It helps your business stay fast, focused, and ready to grow even when things change quickly.
Key Metrics to Track in a Fintech BI Dashboard
You need to track the right numbers to keep your fintech growing and safe.
Here are the key metrics your dashboard should clearly show:
Key Metric | What It Tracks | How It Helps? |
1. Transaction Volume and Revenue per User | Number of transactions and earnings per customer | Helps understand growth and customer value |
2. Churn Rate and Customer Lifetime Value | Customer retention and overall value per customer | Helps keep customers happy and improves profits |
3. Loan Default Rate and Credit Risk Score | Timely loan repayments and customer risk | Protects your business by quickly spotting risks |
4. Funnel Conversions and Onboarding Drop-offs | Customer drop-off points during sign-up | Improves onboarding to win more customers |
5. Compliance and Audit KPIs | Meeting regulatory and compliance requirements | Ensures your fintech stays legally safe |
Tracking these metrics makes your FinTech dashboard clear and useful, helping you safely grow your business each day.
How AI Enhances Business Intelligence Dashboard for Fintech
AI makes fintech dashboards smarter and more helpful.
It automatically shows important numbers clearly and quickly, so you can make good decisions without needing extra effort or time.
Here’s how AI enhances your business intelligence dashboard:
1. Live Data from Many Sources
AI combines data from different tools and shows it instantly.
This helps your fintech team get the latest information without any delays or manual work.

2. Predict Problems Early
AI spots problems like fraud or customers leaving even before they happen.
This lets you quickly take action and protect your business from losing money or customers.
3. Easy-to-Understand Summaries
AI explains your data simply, like talking to a friend.
This helps your team make quick decisions without spending extra time trying to understand complex data.
4. Smart Alerts on Important Events
AI sends clear alerts if something unusual happens, such as sudden spikes or drops in your data. Your team can then quickly check and solve any issue.
5. Personalized Insights for Your Team
AI learns what matters most to your fintech.
It shows personalized tips and insights that help your team improve and grow the business more effectively.
When you add AI to your fintech dashboard, it turns from a simple data display into a helpful advisor.
It helps your team make better decisions quickly and easily every day.
How to Create a BI Dashboard for Fintech Using AI
Creating a business intelligence dashboard for your fintech team is simple, but it depends on how you want to make it, either manually or by using a tool.
Creating a dashboard with a tool is much simpler because you don't need technical skills or hours of work.
A good tool saves time and keeps your dashboard updated automatically.
Benefits of using a tool:
Simple setup without coding skills
Always updated with real-time data
Easy for everyone on your team
Built-in AI insights
Quickly connects to all your data sources
So, this is why considering a tool is better, and to make it simple, we've found the top 5 tools that can easily build a business intelligence dashboard for you in minutes.
Best Tools to Build AI-Powered Dashboards for Fintech
Choosing the right dashboard tool makes your fintech stronger.
Here's a quick overview of the top tools and how they can help your team build dashboards easily:
Tool | Ideal For | AI Capabilities | Ease of Setup | Fintech-Readiness |
|---|---|---|---|---|
Tableau | Salesforce-based fintechs | Advanced predictions | Complex ⚠️ | Medium ⚠️ |
Power BI | Microsoft-based fintechs | Detailed AI modeling | Complex ⚠️ | Medium ⚠️ |
Looker | Large fintech teams | Custom analytics | Complex ⚠️ | Medium ⚠️ |
Metabase | Small or new fintechs | Basic AI plugins | Easy ✅ | Low ❌ |
Upsolve AI | All fintech teams | Predictive analytics, smart summaries | Very easy ✅ | High ✅ |
Now, we'll explore each business intelligence tool and see how they differ from each other and what might be a better pick for your fintech needs.
1. Tableau: Best for Salesforce-Based Fintech Teams

Tableau is a popular business intelligence tool that helps fintech teams easily visualize complex data and gain clear insights, especially if they already use Salesforce tools.
Tableau helps fintech teams quickly see trends, patterns, and important data points visually, making complicated information simple for daily decisions and long-term strategies.
Tableau Features:
Interactive Visualizations: Easily create charts, graphs, and dashboards to visualize complex fintech data clearly.
Einstein AI Integration: Combines Tableau visuals with Einstein's AI for predicting trends and customer behavior.
Real-Time Salesforce Data Sync: Connect directly to Salesforce data and automatically update dashboards.
Collaborative Dashboards: Easy for different team members to build, share, and update dashboards together.
Mobile-Friendly Dashboards: Dashboards look clear on any device, so your team always stays updated.
Tableau Pricing:
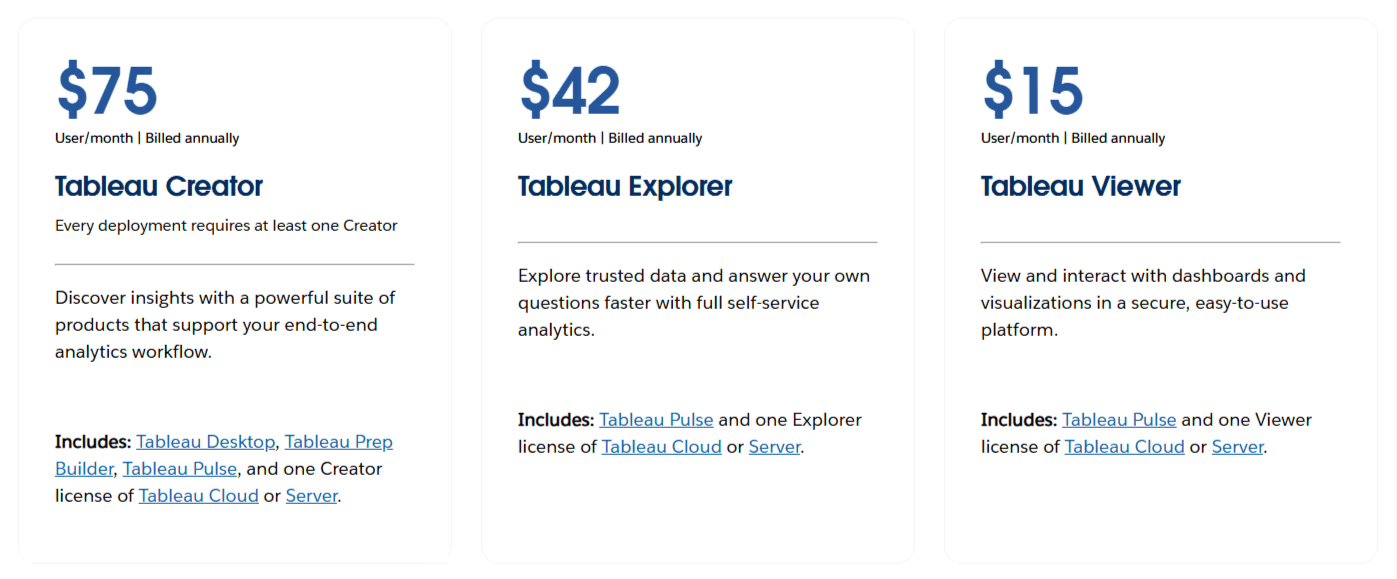
Viewer: $15/month per user (view-only dashboards)
Explorer: $42/month per user (create/edit dashboards, limited data sources)
Creator: $70/month per user (full dashboard creation, advanced analytics, all integrations)
2. Power BI: Best for Microsoft-First Fintech Teams
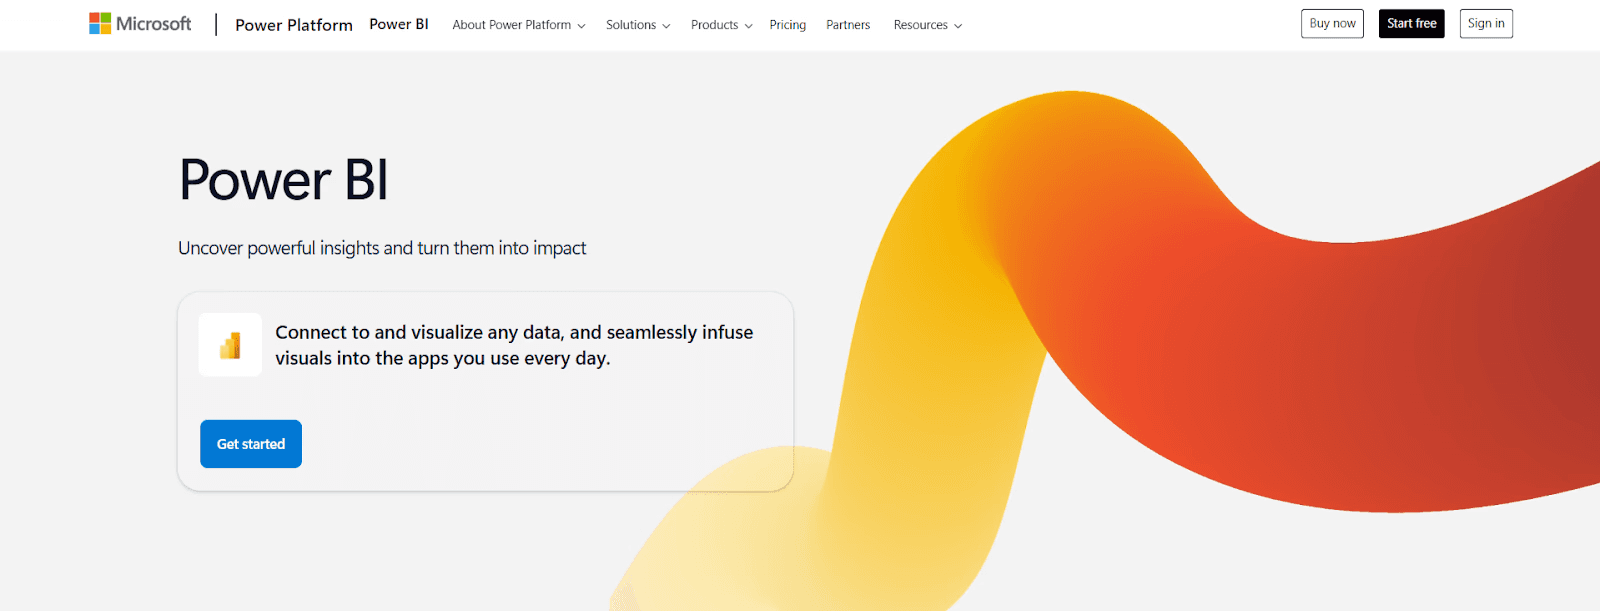
Power BI is a business intelligence tool by Microsoft that helps fintech teams create interactive dashboards by connecting with Excel, Azure, and other Microsoft tools they already use.
Power BI helps fintech teams visualize key metrics, forecast outcomes, and monitor data in real-time using familiar tools, making reporting easier for companies already in the Microsoft ecosystem.
Power BI Features:
Microsoft Ecosystem Integration: Works seamlessly with Excel, Azure SQL, and other Microsoft products.
AI-Powered Insights: Uses machine learning to detect patterns and trends in your fintech data.
Real-Time Dashboards: Displays live updates from your connected data sources without a manual refresh.
Secure Data Sharing: Share dashboards easily across your organization with role-based access.
Power BI Pricing:
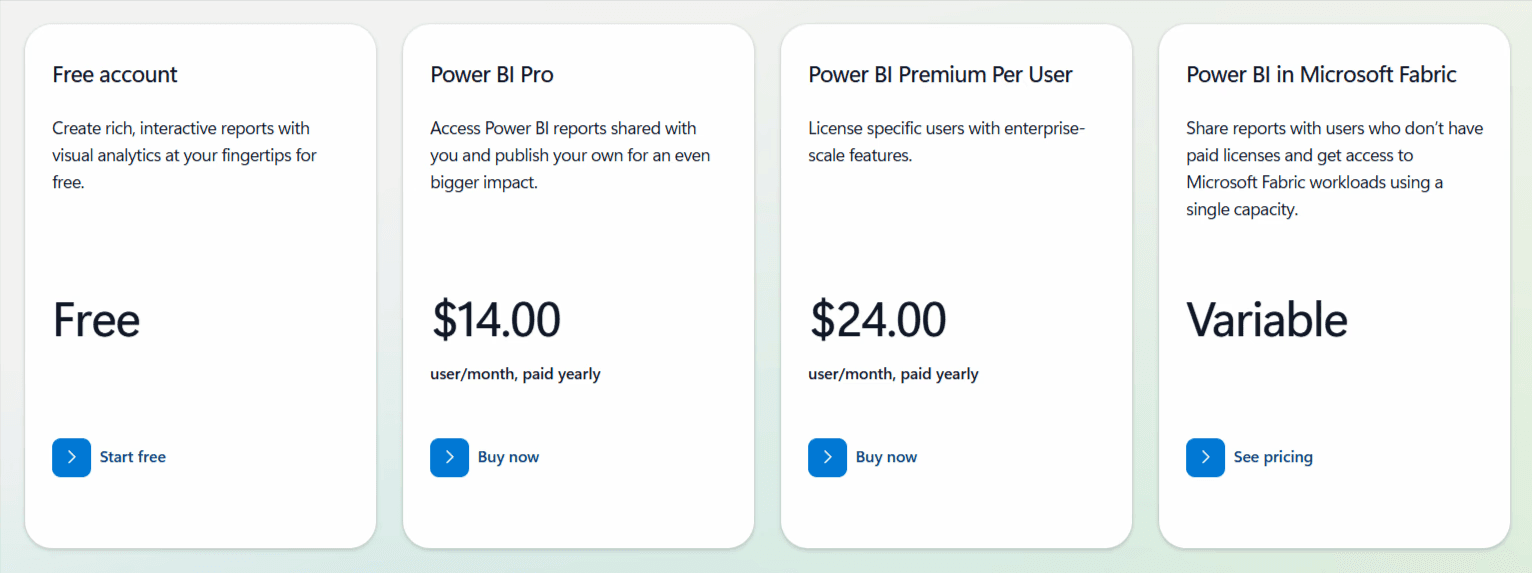
Free Plan: Limited features, ideal for personal use and testing
Pro Plan: $14/month per user (full collaboration and sharing)
Premium Plan: $24/month per user (larger models, AI capabilities, and advanced dataflows)
Enterprise Plan: Custom Pricing
3. Looker: Best for Data-Heavy Fintech Teams
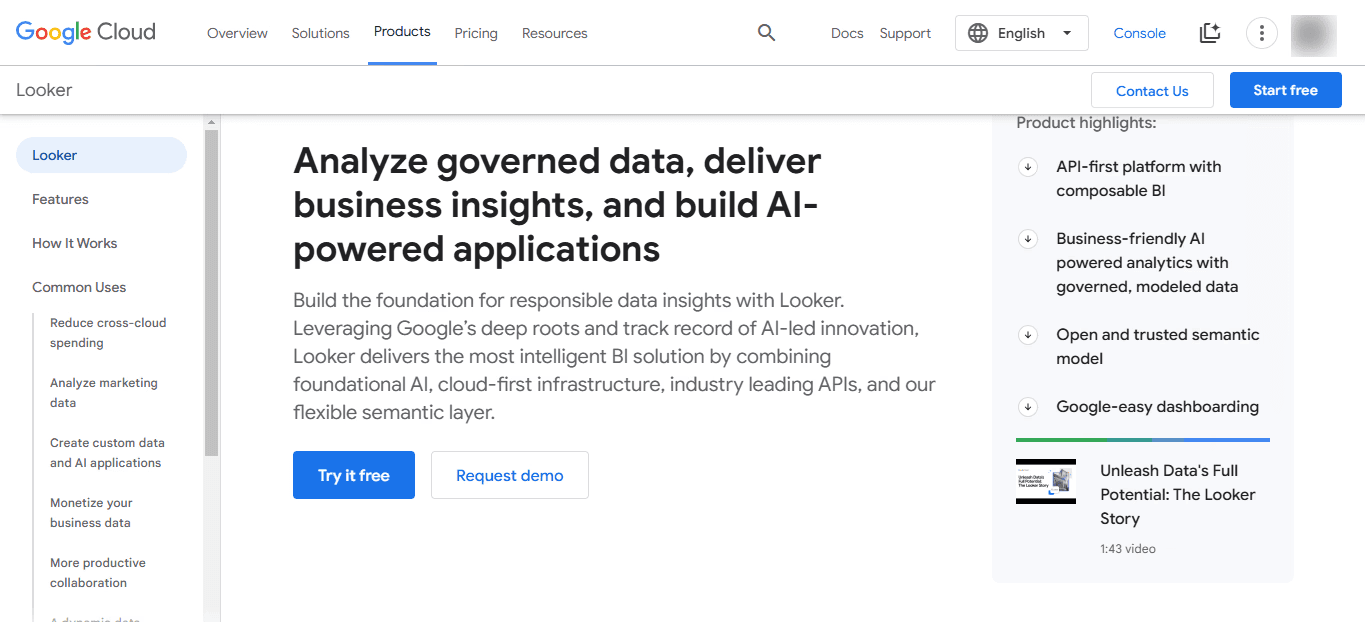
Looker is a modern business intelligence tool from Google Cloud that helps fintech teams explore, analyze, and share large datasets using customizable dashboards and deep data modeling.
Looker helps data teams build detailed dashboards, run complex queries, and share real-time insights with non-technical teams, making it ideal for fintechs with engineering resources.
Looker Features:
Deep Data Modeling: Let your team create reusable data models and definitions for accurate, trusted reporting.
Real-Time Reporting: Dashboards auto-refresh with the latest numbers from BigQuery and other cloud databases.
Flexible Embedding: Embed dashboards into apps or internal tools for easy access.
Advanced Permissions: Control who sees what with detailed access management.
Looker Pricing:
Custom pricing based on your company's data size, users, and features required.
Usually suited for larger or enterprise-level fintech teams.
4. Metabase: Best for Small or Early-Stage Fintech Teams

Metabase is a simple, open-source business intelligence tool designed for fintech startups and smaller teams looking for an easy, budget-friendly way to visualize data and track key metrics.
Metabase helps fintech teams quickly build clear dashboards, track daily metrics, and easily understand data without needing advanced technical knowledge or a dedicated data team.
Metabase Features:
Simple Dashboard Builder: Easily create dashboards by simply dragging and dropping without coding skills.
Basic AI Plugins: Offers easy-to-use plugins to add basic analytics features like simple forecasts.
Easy Data Connections: Connects directly to SQL databases and other popular tools quickly.
Real-Time Data Visualization: Updates dashboards automatically to always show the latest data.
Metabase Pricing:

Open Source (Self-Hosted): Free to use and customize, hosted by your own team
Cloud Starter: $85/month (up to 5 users, basic analytics)
Cloud Pro: $500/month (up to 10 users, advanced sharing, priority support)
Enterprise Plan: Custom pricing (includes extra security, audit logs, and dedicated support)
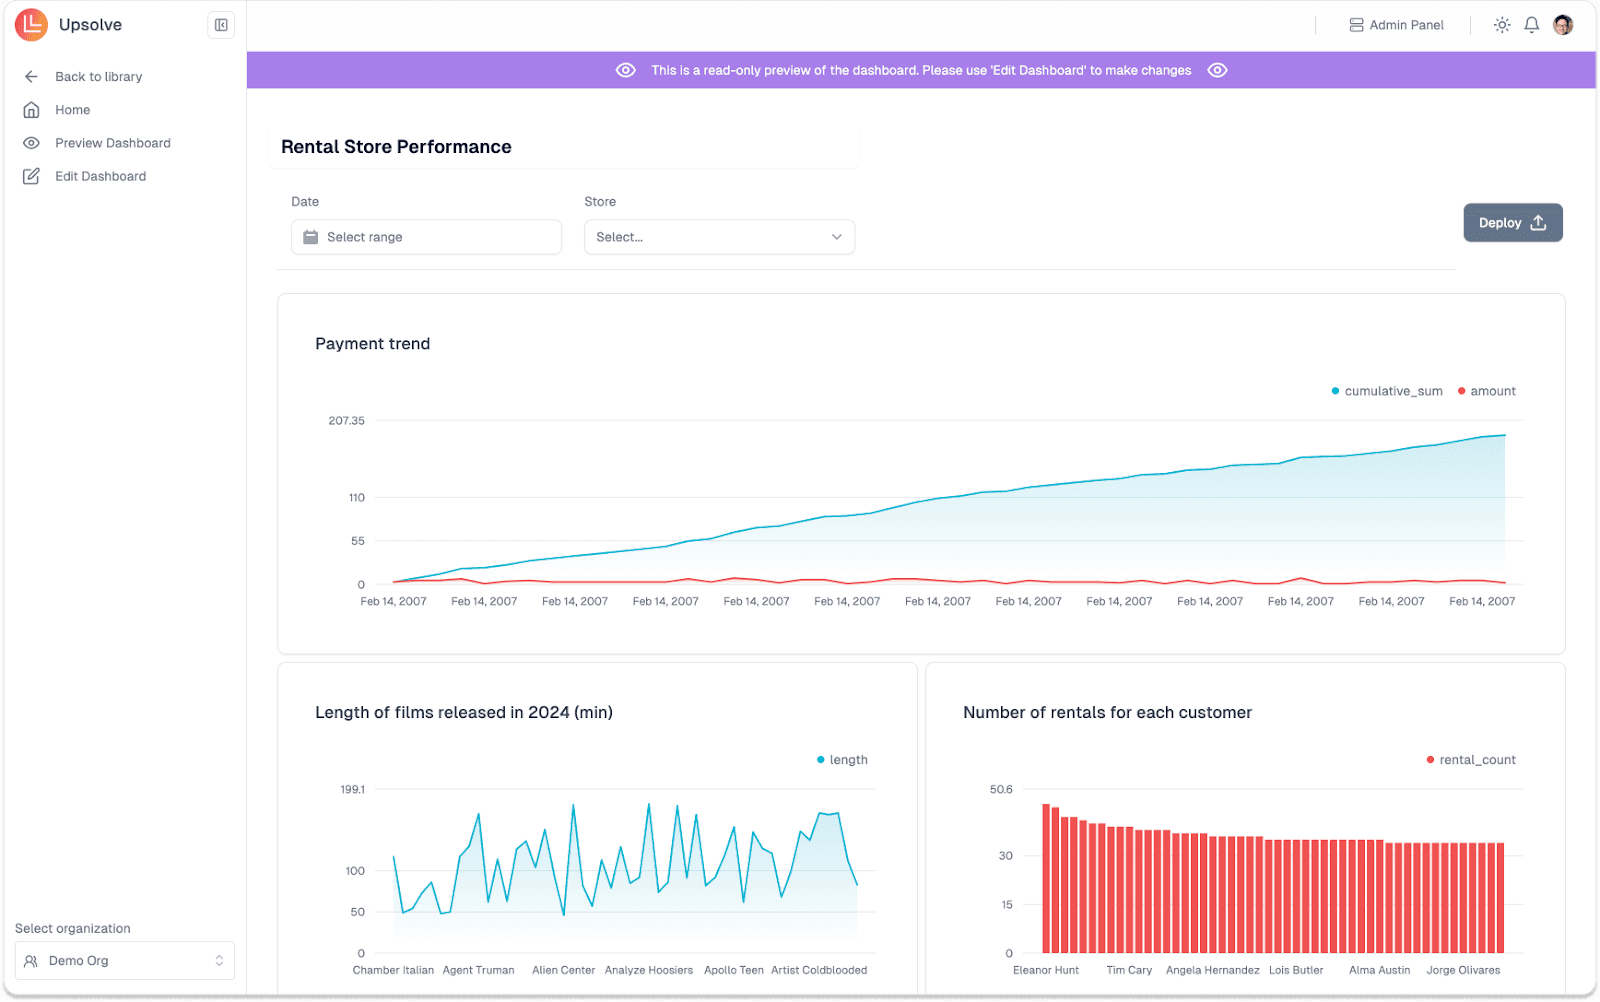
5. Upsolve AI: Best for Agent-Driven Analytics for Fintech
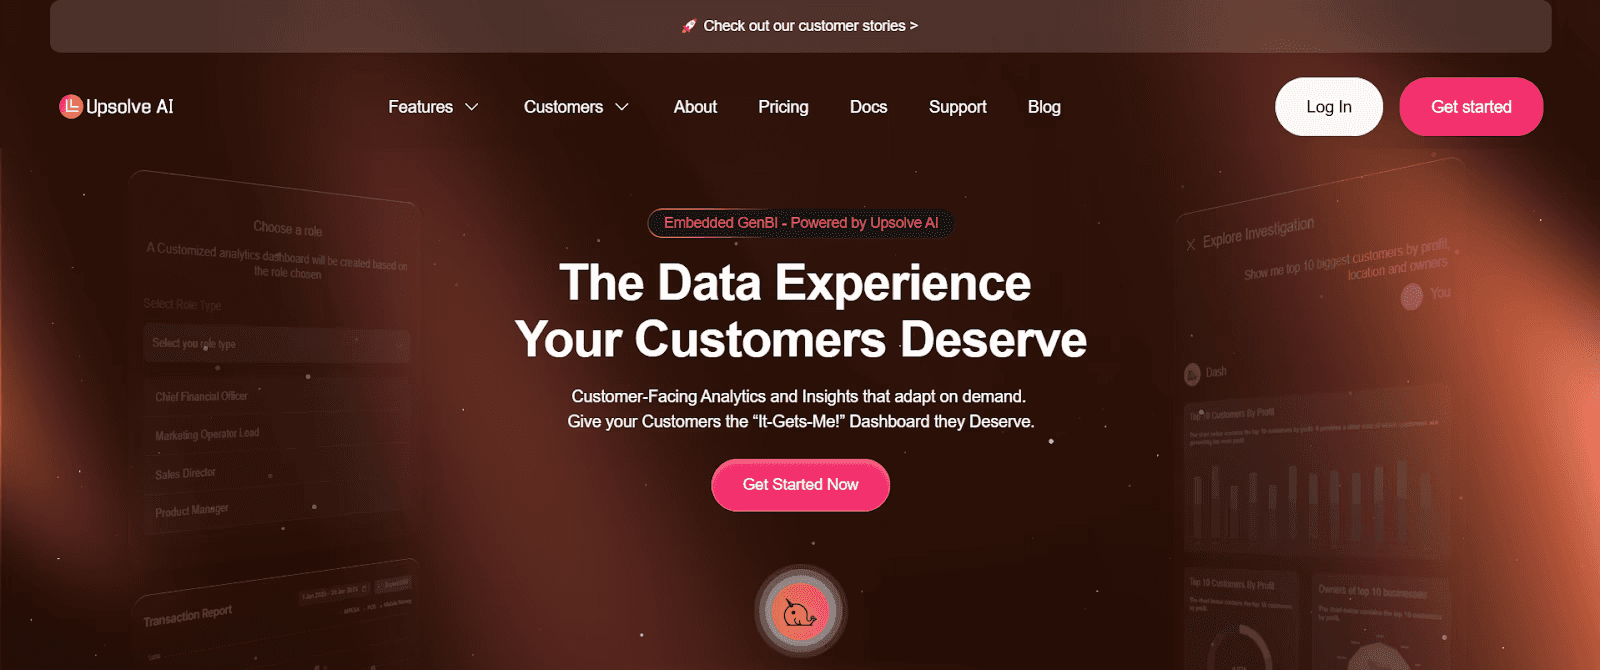
Upsolve AI is a two-sided agentic analytics platform. Business and finance users work through an Agentic Dashboard, asking questions in natural language and describing the charts they want the agent to build, while data teams use Agent Studio to encode metric definitions and business rules so fintech metrics stay accurate and governed.
Dashboards embed into customer-facing or internal products, with role-based access and row-level security for compliance-sensitive data.
Upsolve AI Features:
No-Code Setup: Build dashboards by asking in natural language, no technical knowledge needed.
Predictive Analytics: Automatically predicts important things like customer churn and risks.
Smart Summaries and Alerts: AI summarizes data and alerts your team about important changes.
Multi-Source Data Connectors: Easily connects with 50+ data sources, including Stripe, SQL, and CRM tools.
Fintech-Ready Templates: Comes with ready-made dashboard templates made especially for fintech.
Upsolve AI Pricing
Upsolve AI offers a free plan plus three paid tiers, billed around monthly credit usage:
Free ($0): 2,000 one-time credits (~200 questions); all Pro features, to test-drive
Pro ($500/mo): 2,000 credits/month; 50+ data connections, unlimited agents, full observability
Team ($2,000/mo): 10,000 credits/month; adds embedding, RBAC/row-level security, multi-tenant, and semantic-layer generation
Enterprise (custom): on-prem/VPC, SAML SSO, HIPAA, SOC 2, and BYOM
Annual billing is 20% off.
Now that you’ve seen the top tools fintech teams use to build smart business intelligence dashboards, let’s walk through the exact steps to create your own using one of these platforms.
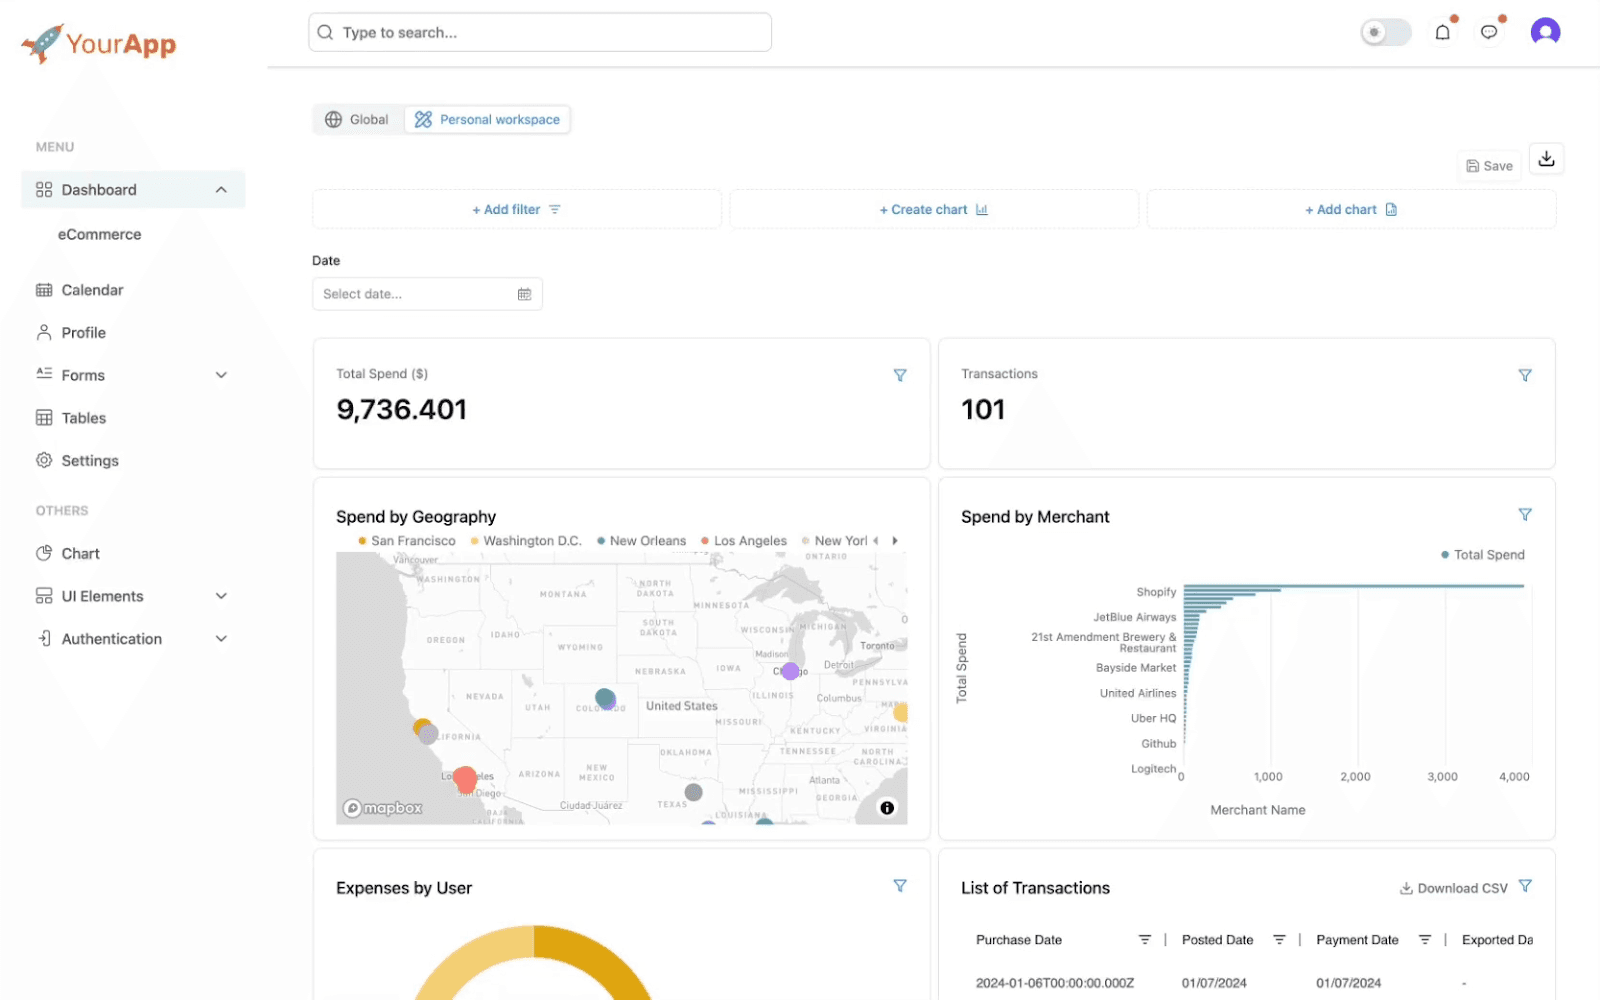
Step-by-Step: Build Your Fintech BI Dashboard with AI
You can build a fintech BI dashboard with any of the tools above. The walkthrough below uses Upsolve AI as the worked example, matching the screenshots shown.
Here is how to build one:
Step 1: Sign Up and Log In to Upsolve AI
Create your account on Upsolve AI's website and log in to start building your dashboard.
Step 2: Connect Your Data Sources
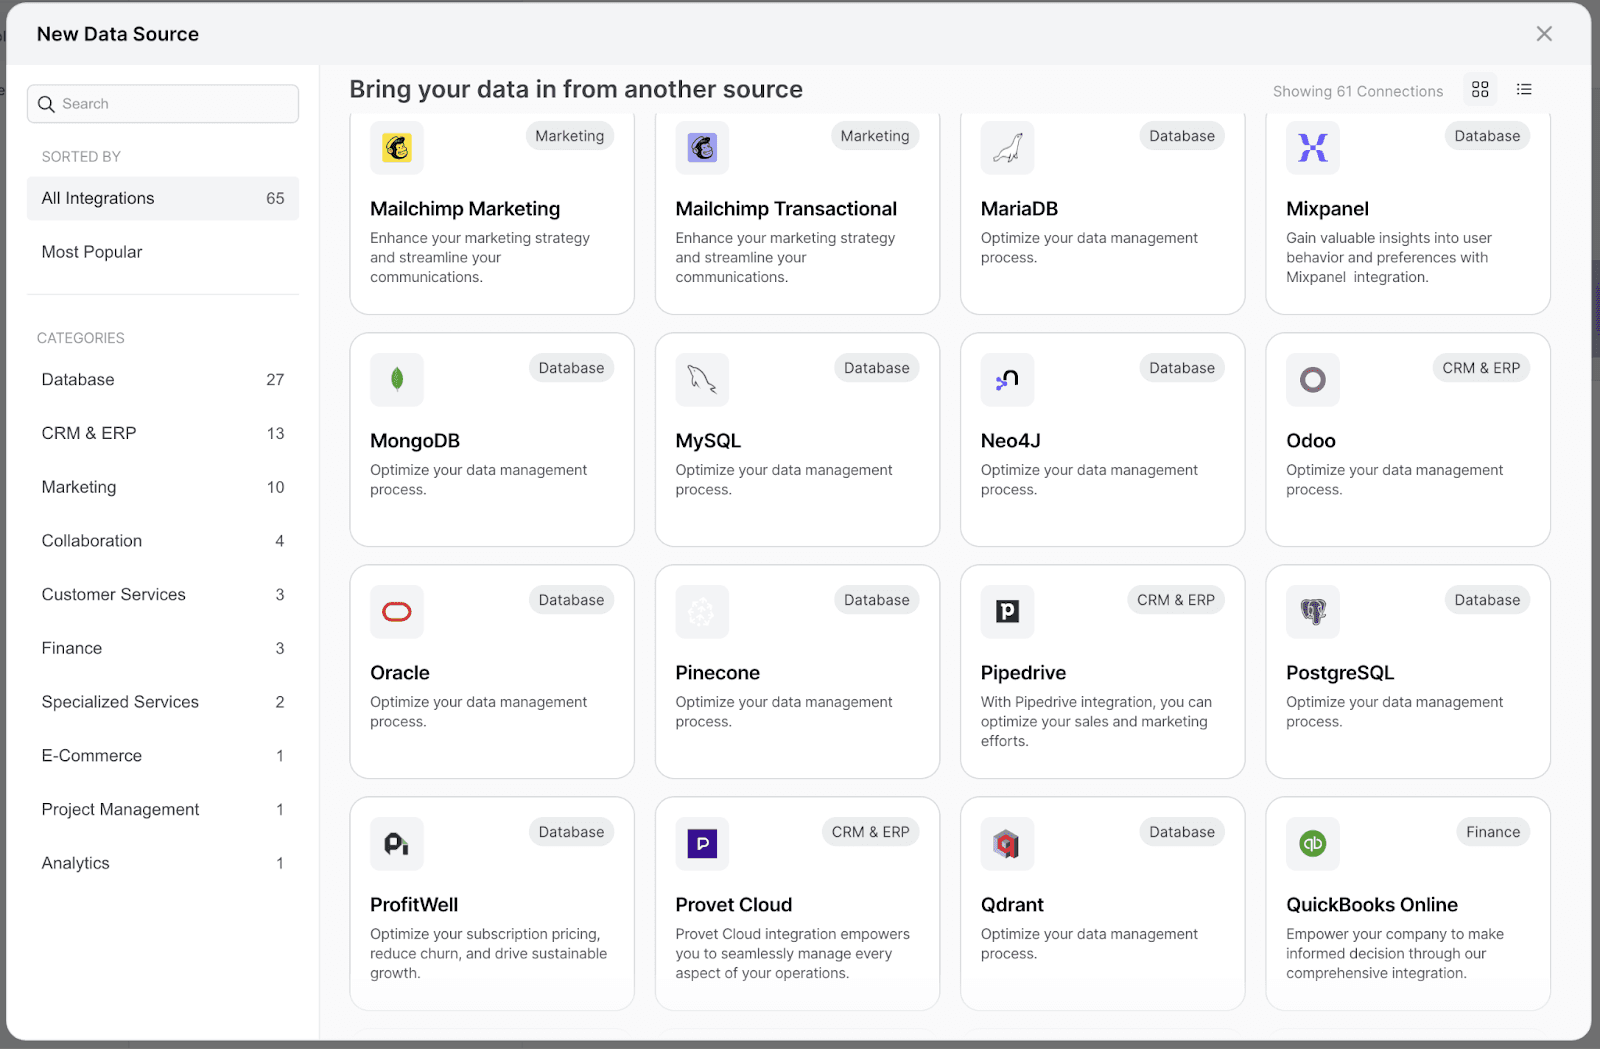
Connect your fintech data sources like Stripe, PostgreSQL, HubSpot, and other CRM or SQL databases using Upsolve's connectors.
Step 3: Choose Your Dashboard Template
Pick from ready-made fintech dashboard templates for needs like lending, payments, risk analysis, or compliance tracking.
Step 4: Select Key Metrics and Customize
Select key fintech metrics such as revenue per user, churn rate, or fraud alerts, then drag and drop charts or graphs into your dashboard layout.
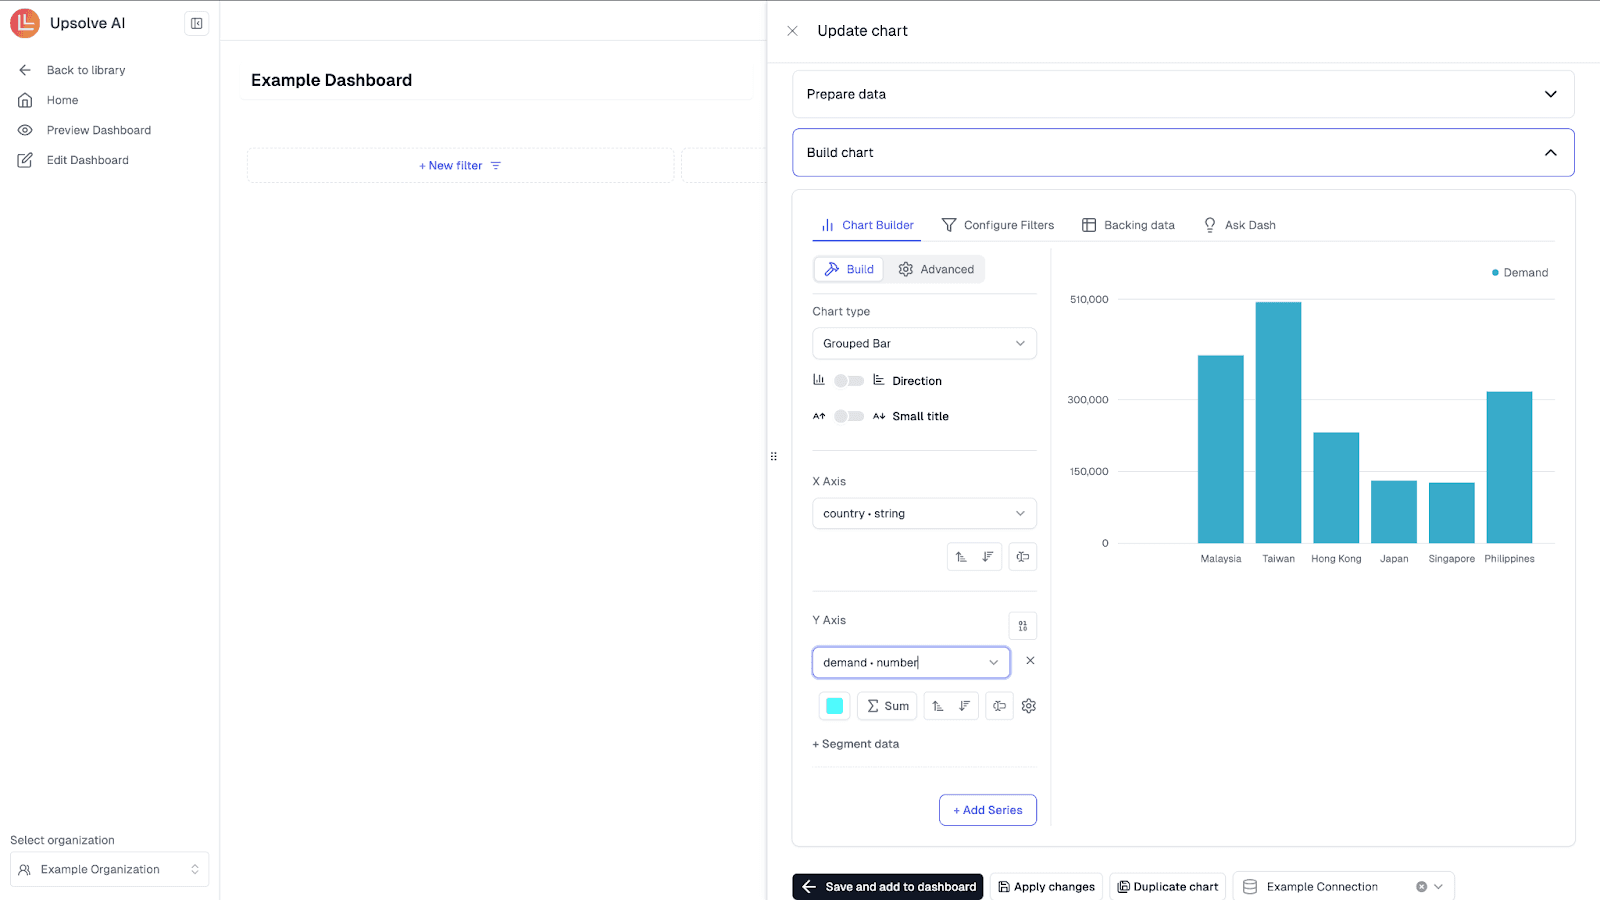
Step 5: Enable AI Features
Activate smart summaries, predictive analytics, and automatic alerts so Upsolve's AI surfaces changes and recommendations without manual digging.
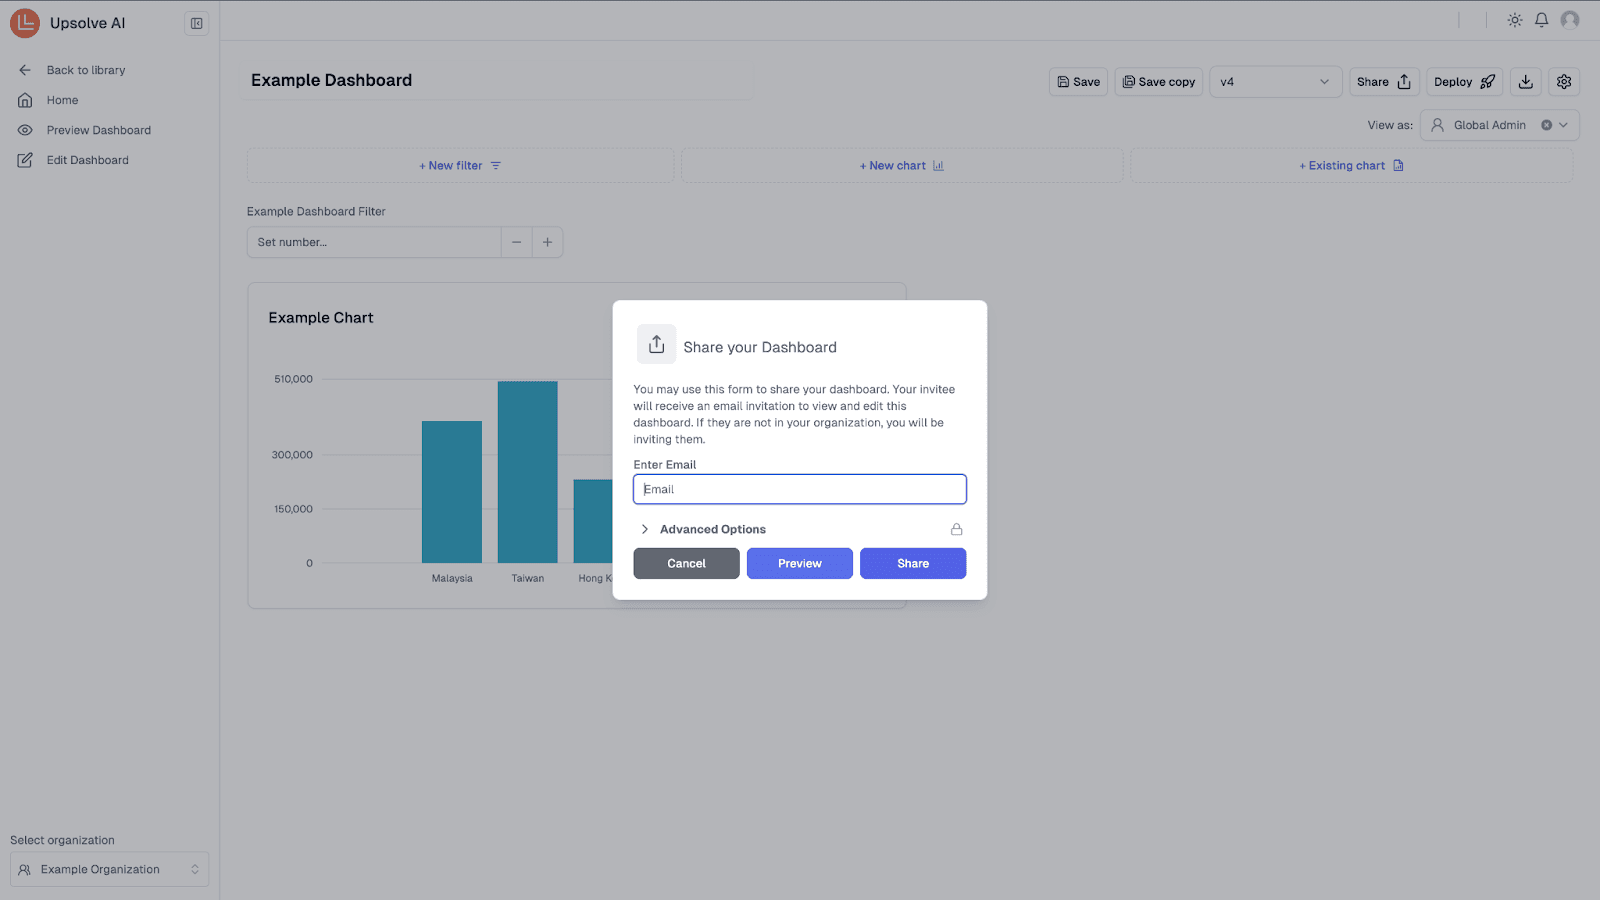
Step 6: Share and Collaborate
Once your dashboard is ready, share it with your fintech team or investors so everyone can view real-time updates. If you are embedding for customers, set roles and permissions before rollout.
Following these steps, your fintech dashboard gives your team real-time insights to act on.
Common Pitfalls to Avoid
When creating your fintech business intelligence dashboard, certain common mistakes can slow down your progress.
Here are pitfalls you should avoid for a clear, useful, and effective dashboard:
Pitfall | Why It’s a Problem | What to Do Instead |
Tracking too many metrics | Creates confusion and hides what really matters | Focus only on 5 to 10 key, high-impact metrics |
Ignoring compliance data | Misses critical legal and audit requirements | Include KYC, AML, and regulatory metrics |
Delayed dashboard updates | Teams work with outdated information | Use real-time data sources and auto-refreshing |
Using generic BI tools | Requires too much setup, lacks fintech context | Choose a fintech-focused analytics platform |
Waiting on developers to build | Slows down decision-making and delivery | Pick a no-code tool your team can use directly |
Avoiding these common pitfalls makes your FinTech dashboard clear, helpful, and easy to use, ensuring your team always makes smarter decisions without delays or confusion.
Examples of Fintech BI Dashboards in Action [Case Study]
Now, you've seen how a business intelligence dashboard helps your fintech team track important metrics. But seeing how it works in real life helps you understand its real value.
See how Moonnox uses Upsolve AI to Embed Business Intelligence in their platform:
Moonnox provides an AI platform for professional services teams, helping them automate workflows.
But Moonnox needed a quick, secure way to show clients how their AI platform improved productivity.
Challenges Moonnox faced:
Needed secure integration with their existing PostgreSQL data
Wanted an easy setup without months of engineering work
Required customizable dashboards for different client needs
How Upsolve AI Helped:
Easy Data Security Integration: Automatically connected with Moonnox’s existing PostgreSQL security, requiring no additional engineering.
Rapid Deployment: Embedded BI dashboards deployed within 4 weeks, instead of the typical 3-4 months.
Customizable Dashboards: Provided easy, customizable analytics dashboards tailored specifically to each client.
Reduced Engineering Effort: Allowed engineers to focus on improving core AI features rather than building analytics tools.
With Upsolve AI, Moonnox quickly demonstrated clear value to their clients, saved significant engineering time, and easily tracked important customer-impact metrics in real-time dashboards.
👉 Read more success stories and learn how business intelligence dashboards have helped fintech teams grow faster.
Final Thoughts: Is the Future of Fintech Dashboards AI-Driven?
Previously, static dashboards were good enough for fintech teams to manually find and check important customer data, but as businesses grew, static dashboards became slow, confusing, and difficult to manage.
But AI has totally changed this. Now dashboards automatically track data, offer smart insights, and show clear alerts instantly, saving teams time and improving decisions.
AI business intelligence dashboards are becoming popular because:
They provide real-time insights instantly.
They predict important trends like churn or fraud.
They simplify complex data clearly for everyone.
They alert your team automatically about important changes.
To make it simple for you, you may use several business intelligence tools like Tableau, Power BI, or Metabase depending on your needs.
If you need to embed dashboards for customers without heavy engineering, an agentic, embeddable analytics platform like Upsolve AI can help you launch one.
FAQs
Still have questions about fintech business intelligence dashboards?
Here are quick answers to some common questions fintech teams often ask:
Q1: What KPIs matter most in fintech BI dashboards?
Important KPIs include revenue per user, churn rate, loan defaults, compliance metrics, funnel conversion rates, and fraud detection alerts for clear, actionable insights.
Q2: Are AI-powered dashboards expensive for startups?
Not always. Many AI-powered tools offer affordable plans that fit startups, with pricing that scales as you grow, keeping dashboards budget-friendly from day one.
Q3: Can I use multiple tools together?
Yes, you can. However, managing multiple tools often complicates integrations. Choosing one flexible tool that covers your key needs typically saves time and simplifies workflows.
Q4: What makes Upsolve different from Tableau or Power BI?
The tools take different approaches. Tableau and Power BI offer deep visualization and modeling with more setup and, often, developer involvement. Agent-driven platforms like Upsolve AI focus on natural-language dashboards and embedding, grounded in a context layer that keeps answers accurate. The right fit depends on your team's resources and whether you are embedding analytics for customers or building internal reports.
Q5: How long does it take to build a dashboard?
With simple, no-code tools, you can create and launch a fully working business intelligence dashboard in days or even minutes, not weeks or months.

Try Upsolve for Embedded Dashboards & AI Insights
Embed dashboards and AI insights directly into your product, with no heavy engineering required.
Fast setup
Built for SaaS products
30‑day free trial


