
Compare Tableau and Domo across features, pricing, ease of use, scalability, and integrations to decide which BI platform fits your business needs.

Ka Ling Wu
Co-Founder & CEO, Upsolve AI
10 min

Disclosure: This article is published by Upsolve AI. Where our product is mentioned alongside competitors, we aim to provide balanced coverage based on publicly available information. We encourage readers to evaluate all options independently.
Choosing between Domo and Tableau trips up a lot of teams, and the honest answer is that the right tool depends on what you actually need rather than which feature list runs longer.
Both platforms are established and widely deployed, but they were built around different centers of gravity.
Domo is positioned as an all-in-one platform that combines data integration, management, and visualization inside a single cloud environment.
Tableau is built around visual analysis and dashboard design, and it assumes your data pipelines are already in reasonable shape.
In this comparison, we break down:
What Domo and Tableau are each built to do well.
Which one your team is likely to get productive on faster.
Pricing: what each vendor publishes, and what it actually covers.
The limitations and trade-offs worth knowing before you commit.
There is no universal winner here. There is only the better fit for your team, your data, and your budget.
What Is Domo?
Domo is a cloud-based business intelligence (BI) platform that helps you manage and analyze your business data in one place. It’s like a big dashboard where you can see everything about your business in real-time.
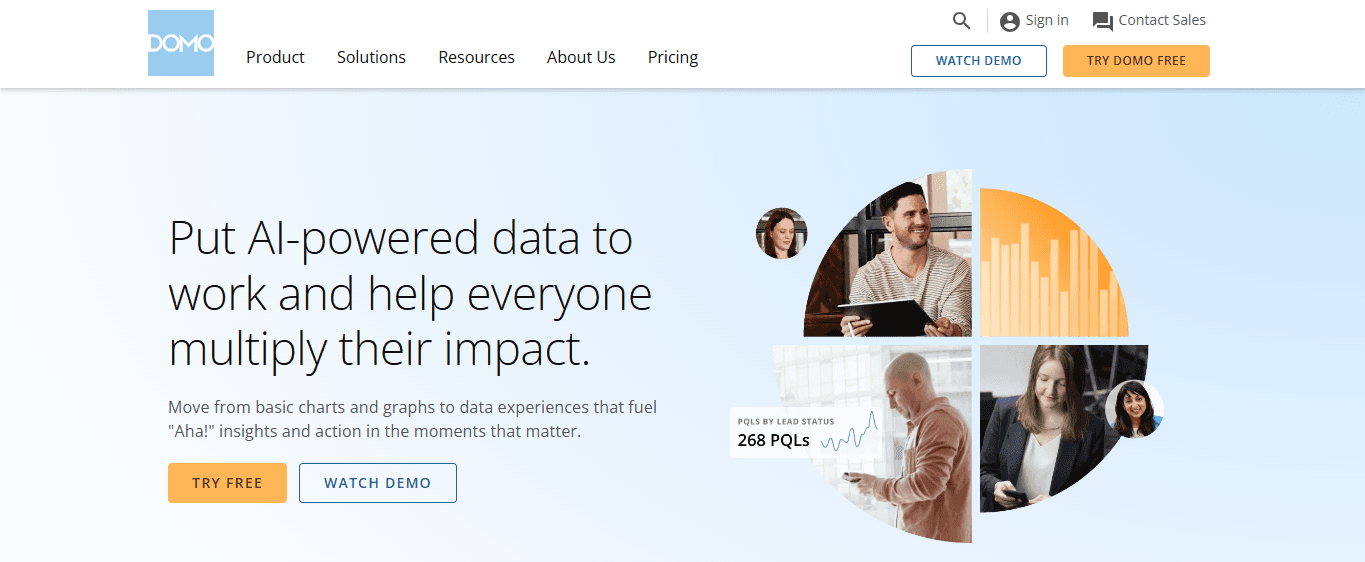
Whether you're tracking sales, marketing efforts, or customer data, Domo can show it all together.
Key Features of Domo
Here’s what makes Domo stand out:
All-in-One Platform: Domo provides a complete solution that includes data integration, business intelligence, and analytics.
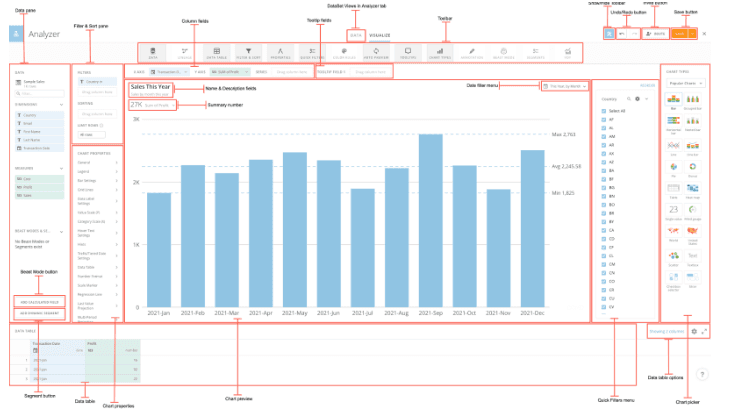
Real-Time Dashboards: You get live updates, so you always see the most current data.
Collaboration Tools: Domo lets your team work together by sharing insights and commenting directly within the platform.
Pre-Built Apps: It offers a variety of apps for specific industries and functions.
Mobile Access: Access your data anywhere with Domo’s mobile app.
Pros and Cons of Domo
Here’s a quick look at the pros and cons of Domo:
Pros:
User-Friendly Interface: The platform is easy to navigate, even for non-technical users. You don’t need to be a data expert to use Domo.
Cloud-Based: Domo is entirely cloud-based, which means no installation headaches, and your data is accessible from anywhere.
Strong Data Visualization: With interactive visuals, charts, and graphs, you can understand your data instantly.

Scalability: Domo is great for businesses of all sizes. As your business grows, Domo can scale along with you.
Cons:
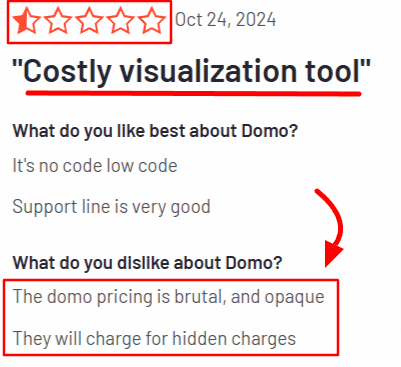
Expensive: Domo can be pricier than other BI tools, especially for small businesses.
Complex Setup: While it’s easy to use, setting up Domo can be a bit complicated, especially if you need to connect various data sources.
Learning Curve: Some advanced features may require some time to understand fully, especially if you are new to business intelligence platforms.
Domo Pricing
Domo does not publish list pricing. Its pricing page offers two paths: a 30-day free trial and custom pricing quoted by sales.
The free trial covers the full platform with unlimited users, onboarding support, self-service education, and one training session, with no credit card required.
Custom pricing includes everything in the trial plus a dedicated account team, volume discounts, custom add-ons, support packages, AWS private link, and a HIPAA compliant environment. Cost scales with user count, data volume, and the features you enable, so the only way to get a real number is a sales conversation.
What Is Tableau?
Tableau is a data visualization platform for building interactive charts, graphs, and reports. Whether you’re analyzing sales, marketing data, or customer trends, Tableau helps you turn your numbers into visuals that are easy to understand.
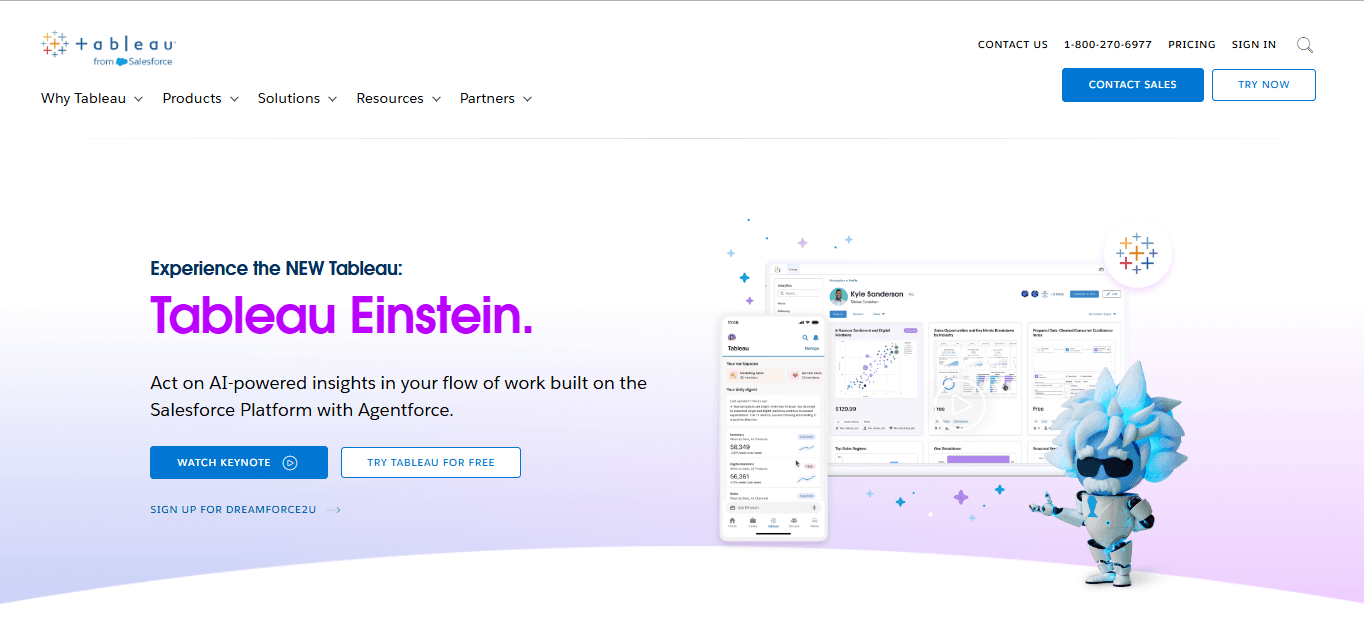
Tableau is focused on visual analysis and dashboard design. It is widely used by data analysts and business intelligence teams who need to explore data and publish findings to stakeholders.
Key Features of Tableau
Here are some standout features that make Tableau a go-to tool for data visualization:
Advanced Data Visualization: Tableau supports a wide range of chart types and interactive dashboard behaviors.
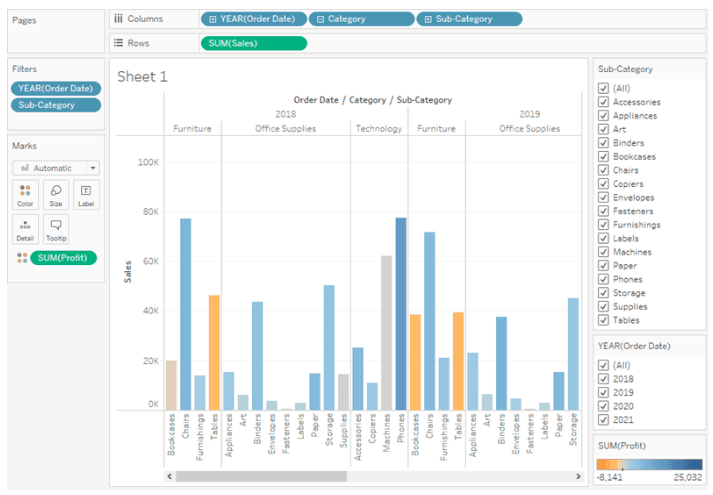
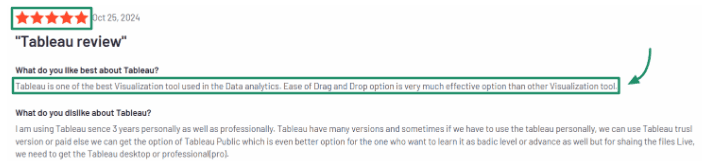
User-Friendly Interface: With drag-and-drop functionality, you can build dashboards without coding.
Data Blending: Combine data from multiple sources easily.
Extensive Analytics: Perform complex calculations and statistical analysis.
Community Resources: Tableau has a large user community and plenty of learning resources.
Pros and Cons of Tableau
Now, take a look at the pros and cons so you can decide if Tableau is the right fit for you:
Pros:
User-Friendly: Even if you have little experience with data, Tableau’s drag-and-drop interface is easy to use.
Deep Visualization Control: Tableau gives you fine-grained control over chart types, formatting, and interactivity, which is why it is common in teams publishing analysis to a wide internal audience.
Advanced Features: Tableau offers advanced analytics and customization options for teams that need more than standard charting.
Flexible Data Integration: Tableau can connect to almost any data source, including spreadsheets, databases, cloud services, etc.
Cons:
Pricey: Tableau can be quite expensive, especially for small businesses or individuals just starting.
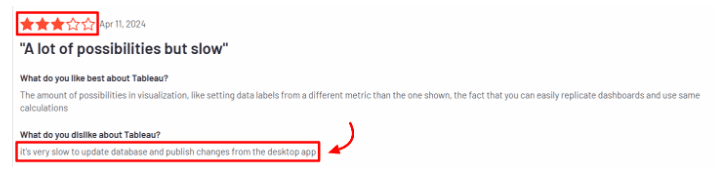
Steep Learning Curve: While the interface is easy to use, mastering Tableau’s features can take time, and sometimes can be slow to process data.
Lighter Built-In Collaboration: Tableau supports sharing, commenting, and subscriptions, but it does not include the social and workflow layer Domo builds in by default, so cross-team collaboration often leans on separate tools.
Tableau Pricing
Tableau publishes list pricing, though the structure is edition-based and takes a moment to parse. Current published rates, all billed annually:
Tableau Standard: from $15 USD per user/month. Browser-based web authoring, Tableau Desktop and Prep Builder, and Tableau Pulse.
Tableau Enterprise: from $35 USD per user/month. Everything in Standard, plus Advanced Management and Data Management.
Tableau Cloud+: contact sales. Everything in Enterprise, plus Tableau Agent in Tableau Cloud and Pulse, Premier Success, 50 sites, and Release Preview access.
Tableau+ Bundle: contact sales. Everything in Cloud+, plus Tableau Next.
Two things to keep in mind. Every deployment requires at least one Creator license, and Creator, Explorer, and Viewer licenses are still sold separately for additional users. All tiers require an annual contract.
Domo vs Tableau: 5 Key Differences
Here are the five key differences between Domo and Tableau. This should help you determine which tool best suits your needs.
What Features Do Domo and Tableau Offer?
Both Domo and Tableau have many features, but they shine in different areas.
So, what's the difference?
Feature | Domo | Tableau |
|---|---|---|
Use Case | All-in-one platform combining analytics, visualization, and collaboration | Advanced visualization and customizable dashboard design |
Pricing | Quote only, no published rates | Published per-seat rates from $15 per user/month, billed annually |
Ease of Use | Approachable for beginners with a business-user interface | Suits experienced data users; steeper learning curve for advanced features |
Scalability | Scales within its cloud environment as your business grows | Scales for data-heavy teams across both cloud and on-premises |
Integration | Over 1,000 pre-built connectors for business applications | Broad connector range; custom sources may require configuration |
Real-Time Data | Real-time data access and live dashboards | Supports live connections and scheduled extracts; refresh behavior depends on the data source |
Collaboration | Built-in collaboration, commenting, and sharing | Sharing, commenting, and subscriptions; lighter built-in collaboration than Domo |
Deployment Options | Cloud only | Cloud and on-premises |
Domo consolidates more of the stack in one place, while Tableau goes deeper on the visualization layer itself.
Which Tool Is More Affordable?
Pricing can be a big deciding factor. Let's compare the costs of Domo and Tableau.
Domo Pricing:
Custom Pricing: Domo doesn't list prices publicly. You need to contact them for a quote.
Considerations: Pricing is based on factors like the number of users, data volume, and required features.
Potential Costs: Because pricing is quoted rather than published, small teams in particular should confirm the total before assuming it fits the budget.
Tableau Pricing:
Published Pricing: Tableau lists per-seat rates by edition, starting at $15 per user/month billed annually.
Higher Tiers: Cloud+ and the Tableau+ Bundle are quoted by sales rather than listed.
License Requirement: Every deployment needs at least one Creator license, which affects the true entry cost.
Pricing Comparison Table of Domo and Tableau:
Tool | Starting Cost | Pricing Model | Best For |
|---|---|---|---|
Domo | Quote only | Custom, scales with users, data volume, and features | Teams wanting integration, management, and visualization in one platform |
Tableau | From $15 per user/month | Published, edition-based, billed annually | Teams focused on visual analysis and dashboard publishing |
So, which is more affordable?
Tableau is the more transparent of the two. Entry pricing is published, so you can model per-seat cost before talking to anyone.
Domo cannot be compared like for like without a quote in hand. Budget for a sales conversation before you can put the two totals side by side.
Which Tool Is Easier to Use?
Ease of use is crucial, especially if you're new to data tools.
Domo Usability:
User-Friendly: Domo is designed for business users without technical backgrounds.
Quick Start: You can set up dashboards quickly with minimal training.
Learning Resources: Offers tutorials and support to help you get started.
Tableau Usability:
Intuitive Interface: Tableau’s drag-and-drop features make it easy to create visualizations.
Learning Curve: Basic functions are easy, but advanced features might take time to master.
Training Available: Plenty of online courses and a strong community to help you learn.
So, which is easier to use?
Domo might be easier for complete beginners due to its all-in-one approach.
Tableau is user-friendly but may require more time to explore advanced capabilities.
Which Tool Scales Better with Business Growth?
If your business is growing, scalability matters.
Domo Scalability:
Cloud-Based: Domo is entirely cloud-based, making it easy to scale up as your data and user base grows.
Flexible Licensing: You can add more users and features as needed.
Performance: Designed to handle large volumes of data without slowing down.
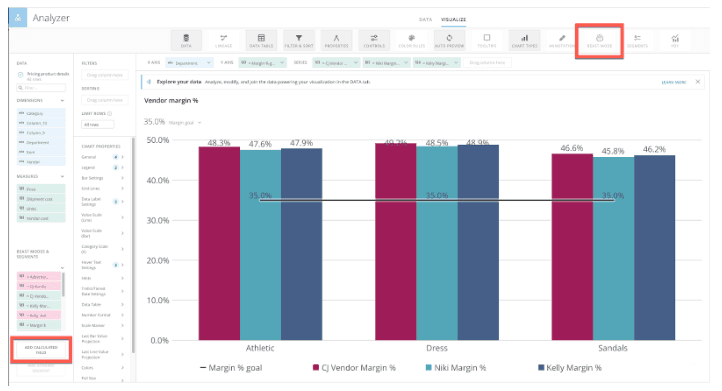
Tableau Scalability:
Scalable Solutions: Tableau offers both cloud-based and on-premises solutions.
Server Options: With Tableau Server, you can manage scalability internally.
Resource Needs: Scaling may require additional hardware or cloud resources.
So, which tool scales better?
Domo offers seamless scalability in the cloud, which might make rapid growth easier.
Tableau also scales well but may require more planning and resources.
Which Tool Integrates Better with Other Platforms?
Integration capabilities are essential for a smooth workflow.
Domo Integration:
Over 1,000 Connectors: Domo connects to many data sources like databases, cloud services, and third-party apps.
Easy Setup: Pre-built connectors make integration straightforward.
APIs Available: Domo provides APIs for custom integrations.
Tableau Integration:
Wide Range of Connectors: Tableau connects to various data sources, including spreadsheets, databases, and big data platforms.

Customizable: You can set up custom connections if needed.
Third-Party Support: Many tools offer direct integration with Tableau.
So, which tool integrates better?
Both tools offer robust integration options.
Domo might have a slight edge with more pre-built connectors for business applications.
This breakdown of the key differences between Domo vs Tableau helps you see which tool fits your needs better. Remember, the best choice depends on what features matter most to you, your budget, and how you plan to use the tool.
When to Choose What: Domo or Tableau?
So, you're probably asking yourself, "Should I choose Domo or Tableau?" Let's figure this out together.
When to Choose Domo | When to Choose Tableau |
|---|---|
You want data integration, visualization, and collaboration in one platform. | You need detailed, interactive charts and deep visual analysis. |
Real-time dashboards matter for your operating rhythm. | Your team includes data specialists who need advanced analysis tools. |
You want collaboration built in rather than bolted on. | You need both cloud and on-premises deployment options. |
A fully cloud-based setup fits how your team works. | Published per-seat pricing helps smaller teams model cost upfront. |
But let's be honest, neither tool is perfect. You might face some challenges with both Domo and Tableau.
Challenges with Domo vs Tableau
Challenges with Domo | Challenges with Tableau |
|---|---|
Cost can climb quickly, particularly for small businesses or large user counts. | Advanced features carry a real learning curve for non-specialists. |
The interface is approachable, but mastering the full platform takes time. | Built-in team collaboration is lighter than Domo's. |
Customization options can feel constrained for some use cases. | Add-ons and integrations can raise total cost beyond list price. |
So, while both Domo and Tableau have real strengths, they also carry trade-offs: cost, ramp time, and gaps in what each covers natively.
Those trade-offs matter more now that analytics evaluations increasingly involve agent capabilities layered on top of dashboards, and the criteria for judging those are different from the criteria for judging a dashboard tool. If that is part of your evaluation, this guide to evaluating AI agent builder platforms for analytics covers what to look for.
Where Agentic Analytics Fits
Domo and Tableau are built on the same assumption: a person builds the dashboard, and a person reads it. That assumption held for twenty years. It is the thing currently under pressure.
Upsolve AI builds context infrastructure for analytics agents. The problem it exists to solve looks like this. Point any AI tool at your warehouse and it will write valid SQL in seconds. It will also pick the wrong revenue table, apply the calendar quarter instead of your fiscal one, and count the test accounts nobody remembers excluding. The SQL is correct. The number is wrong. Nobody notices until someone senior asks why two reports disagree.
That gap is not a model problem. It is missing institutional knowledge: which table is authoritative, how your company defines a qualified account, what the exception rule was last quarter. That knowledge lives in analysts' heads, in Slack threads, and in a dbt file someone last touched two years ago. An agent cannot reach any of it.
Agent Studio is where a data team writes that knowledge down in a form an agent can actually use: metric definitions, validated query patterns, business rules, and guardrails on what the agent is allowed to answer. The Agentic Dashboard is the other side of it, where someone in sales or finance asks a question in plain language, or describes the dashboard they want built, and gets it without filing a ticket.
That knowledge gets organized into three layers:
Structure: what data exists and how it connects.
Meaning: what a term like revenue means at your company specifically, not in general.
Trust: which answers have been checked by someone who would know.
Most tools cover one layer well. Agents break down in production when any of the three is missing, and the one usually missing is Trust.
Pricing: free tier, Pro from $500/month, Team at $2,000/month, which adds embedding, role-based access control, multi-tenant support, and semantic layer generation. Enterprise is custom. Annual billing is 20% off. Compliance controls for regulated environments are available.
None of this replaces Domo or Tableau on a like-for-like basis, and it is not ranked against them here. If what you need is a dashboard authoring tool, the comparison above is the relevant one. If what you keep hitting is that answers take three days and still get questioned when they land, that is a different purchase entirely.
Conclusion: Which Is Right for You?
Deciding between Domo vs Tableau comes down to what your business really needs. Here’s a quick recap of the key differences to help you decide more easily:
Features: Domo bundles integration, management, and visualization in one platform. Tableau goes deeper on visual analysis and dashboard design.
Pricing: Tableau publishes per-seat rates starting at $15 per user/month billed annually. Domo quotes custom, so a sales conversation comes first.
Ease of Use: Domo tends to suit business users without a technical background. Tableau rewards teams with analysts who will invest in learning it properly.
Scalability: Domo scales within its cloud environment. Tableau scales across cloud and on-premises, with more infrastructure planning involved.
Integration: Domo ships more pre-built connectors for business applications. Tableau connects broadly but may need configuration for custom sources.
If neither feels like a clean fit, that is a legitimate signal rather than a failure to decide. It often means the constraint is not the dashboard layer at all, but the context a tool has about your business: which metric definition is current, which table is authoritative, what the business rule says about this quarter.
That is worth naming before you sign either contract, because no amount of dashboard capability solves it.

Try Upsolve for Embedded Dashboards & AI Insights
Embed dashboards and AI insights directly into your product, with no heavy engineering required.
Fast setup
Built for SaaS products
30‑day free trial