
Compare the best B2B SaaS analytics tools across features, pricing, real-time dashboards, and use cases to choose the right solution for your growth stage.

Ka Ling Wu
Co-Founder & CEO, Upsolve AI
10 min

Disclosure: This article is published by Upsolve AI. Where our product is mentioned alongside competitors, we aim to provide balanced coverage based on publicly available information. We encourage readers to evaluate all options independently.
Most B2B SaaS teams rely on dashboards to track product usage, revenue, and customer behavior. But in practice, many analytics setups fall short of answering the questions that matter most.
Common issues include dashboards that show metrics without context, limited visibility into how product usage connects to revenue, and reports that are reviewed once and then ignored. When insights are delayed or fragmented across tools, teams struggle to make fast, confident decisions.
That’s where the right B2B SaaS analytics tool makes a real difference. Instead of simply displaying charts, it helps teams understand why users churn, where engagement drops, and which actions actually drive growth.
In this guide, we’ll help you:
Understand what makes a B2B SaaS analytics tool effective
Compare six leading analytics tools used by SaaS teams
Identify tools that support real-time dashboards and actionable insights
Focus on the metrics that matter for product and revenue decisions
By the end, you’ll have a clearer view of which tools fit your current stage, which ones to avoid, and how to choose an analytics setup that supports sustainable SaaS growth.
What Is B2B SaaS Analytics?
B2B SaaS analytics means tracking and analyzing subscription, product, and customer metrics to understand business performance, improve retention, and scale more effectively.
With B2B SaaS analytics, you can:
Track monthly recurring revenue (MRR) and churn
Analyze customer behavior across product features
Measure customer lifetime value (CLTV)
Identify patterns that drive sustainable growth over time
Spot trends early for better decisions
For example, if churn rises after a new feature release, analytics can reveal if the feature was hard to use or failed to deliver value.
B2B SaaS analytics are particularly helpful for SaaS founders, product teams, and growth marketers who need to make informed decisions quickly.
SaaS Business Intelligence: 7 Things You Need To Know
What Makes a Good B2B SaaS Analytics Tool?
To choose the perfect SaaS analytics tool, you need to look for features that translate your data directly into actionable insights and growth opportunities.
Key features to look for include:
Real-time dashboards: Get live metrics instantly so you can respond quickly to changes rather than waiting for weekly or monthly reports.
Seamless integrations: Easily connect with your CRM, billing systems, and product databases to avoid manual data entry and maintain accuracy.
Easy segmentation: Segment users based on behavior, subscription, or engagement to understand exactly who your most valuable customers are.
Cohort analysis: Identify user groups based on specific events or timelines, making it easier to track long-term customer trends and retention.
Scalability: Choose analytics software designed to grow with your business, ensuring it remains effective from startup through enterprise.
To keep it even simpler and help you choose a perfect fit, you also have to consider:
Feature | Early-stage SaaS | Growth-stage SaaS | Enterprise SaaS |
Ease of use | ✅ High | ✅ Medium | ✅ Low (deep, complex insights) |
Pricing | ✅ Flexible | ✅ Scalable | ✅ Enterprise-level custom pricing |
Setup & onboarding | ✅ Plug-and-play | ✅ Requires some setup | ✅ Full implementation team |
Analytics depth | ✅ Essential revenue analytics | ✅ Detailed product & revenue insights | ✅ Advanced, customizable insights |
By carefully matching these factors with your current growth stage and needs, you'll select an analytics tool that empowers your team to scale confidently and effectively.
Supply Chain Dashboard: 5 Examples + Template
6 Best B2B SaaS Analytics Tools
To help you choose a preferred B2B SaaS analytics tool, here’s a complete comparison of the top options worth trying today.
Tool | Use Case | Ideal For | Pricing | Real-Time SaaS Dashboards |
|---|---|---|---|---|
ChartMogul | Revenue analytics | Finance, RevOps, early-stage teams | Free plan, then from $99/month | ✅Yes |
Mixpanel | Product analytics & user behavior | Product, growth & data-driven SaaS teams | Free plan + usage-based pricing | ✅Yes |
InnerTrends | Retention + onboarding analytics | Growth and product teams | Custom pricing | ✅Yes |
Heap | Full-journey product analytics | Mid to large SaaS with data teams | Free plan + custom paid plans | ✅Yes |
Amplitude | Product analytics & experimentation | Scaling and enterprise SaaS teams | Free; Plus from $49/month | ✅Yes |
Upsolve AI | Embedded, agent-driven analytics | Scaling SaaS teams | Free tier; from $500/month | ✅Yes |
Now, let’s explore what each of these tools does, how they’re different, and which one fits your current growth needs best.
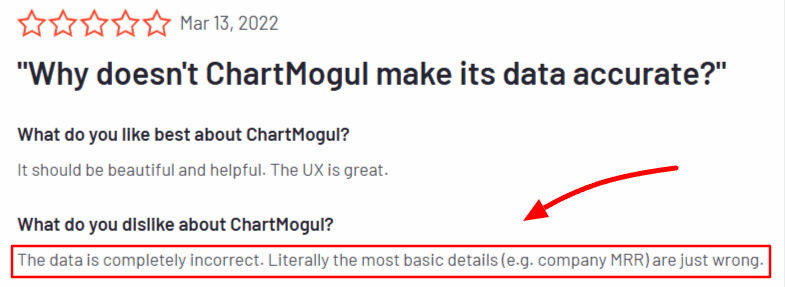
1. ChartMogul – Best for Revenue Analytics Tracking
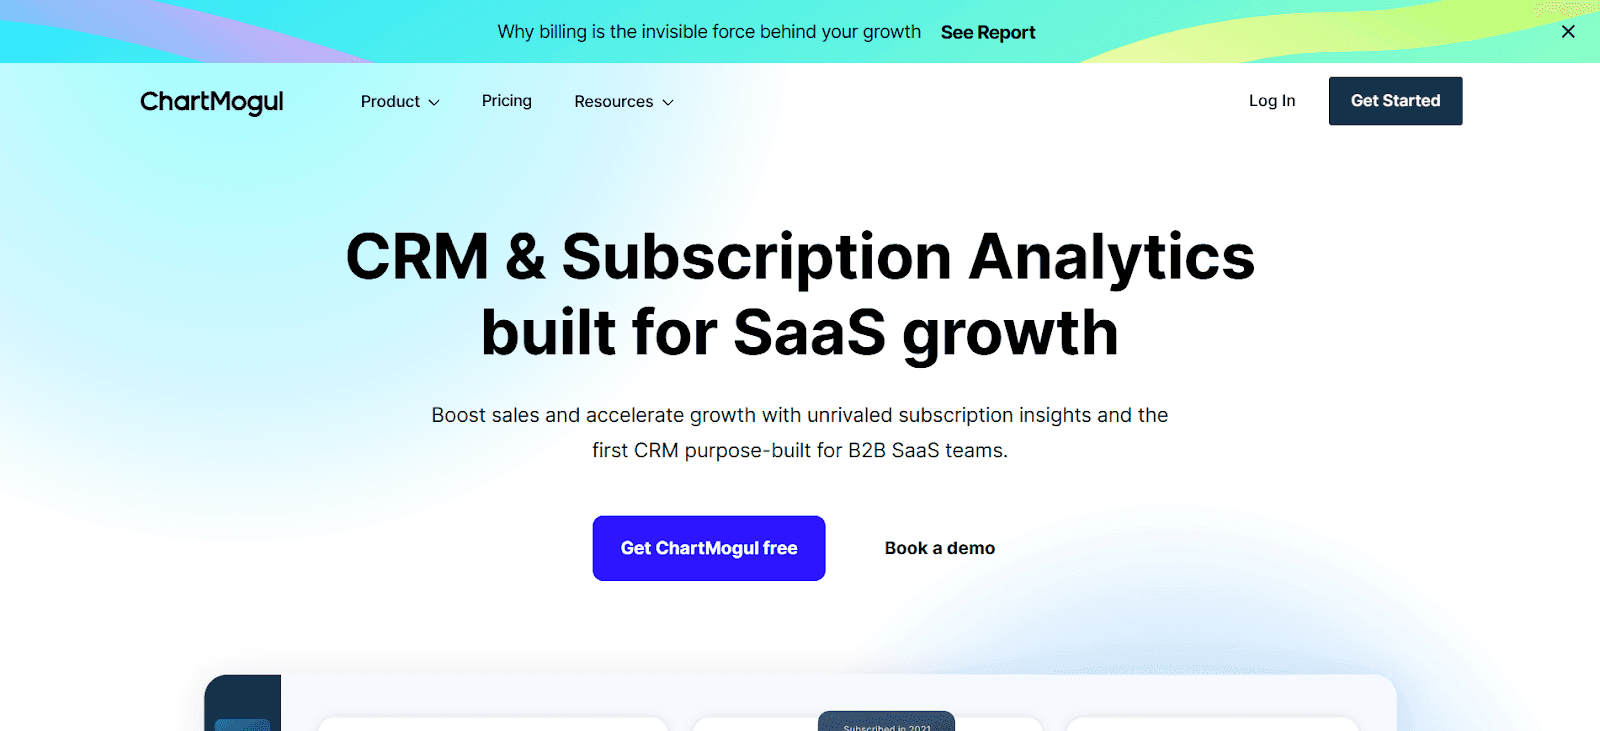
ChartMogul is a SaaS analytics software focused on subscription metrics.
It helps you track MRR, churn, LTV, and other critical revenue KPIs with clarity and ease.
It’s especially helpful for finance and RevOps teams looking to get investor-ready metrics without complex spreadsheet workflows or engineering support.
ChartMogul pulls billing data from Stripe, Chargebee, and other platforms to deliver clean, accurate revenue insights right out of the box.
Features
Subscription Analytics: Track MRR, ARR, churn, expansion, and contraction with real-time revenue analytics tools.
Customer Cohort Reports: Understand retention trends across signup cohorts and subscription events.
Segmentation & Filters: Drill into data by region, plan, or acquisition source to uncover hidden trends.
Custom Metrics & Enrichment: Enrich customer profiles with external data using integrations and APIs.
Pros
Accurate billing and revenue data without manual work
Clean, visual reports ready for investor decks
Easy integration with Stripe, Recurly, and Chargebee
Cons
No product analytics or usage insights
Limited self-serve capabilities for non-finance users
Cohort features could be more customizable
ChartMogul Pricing
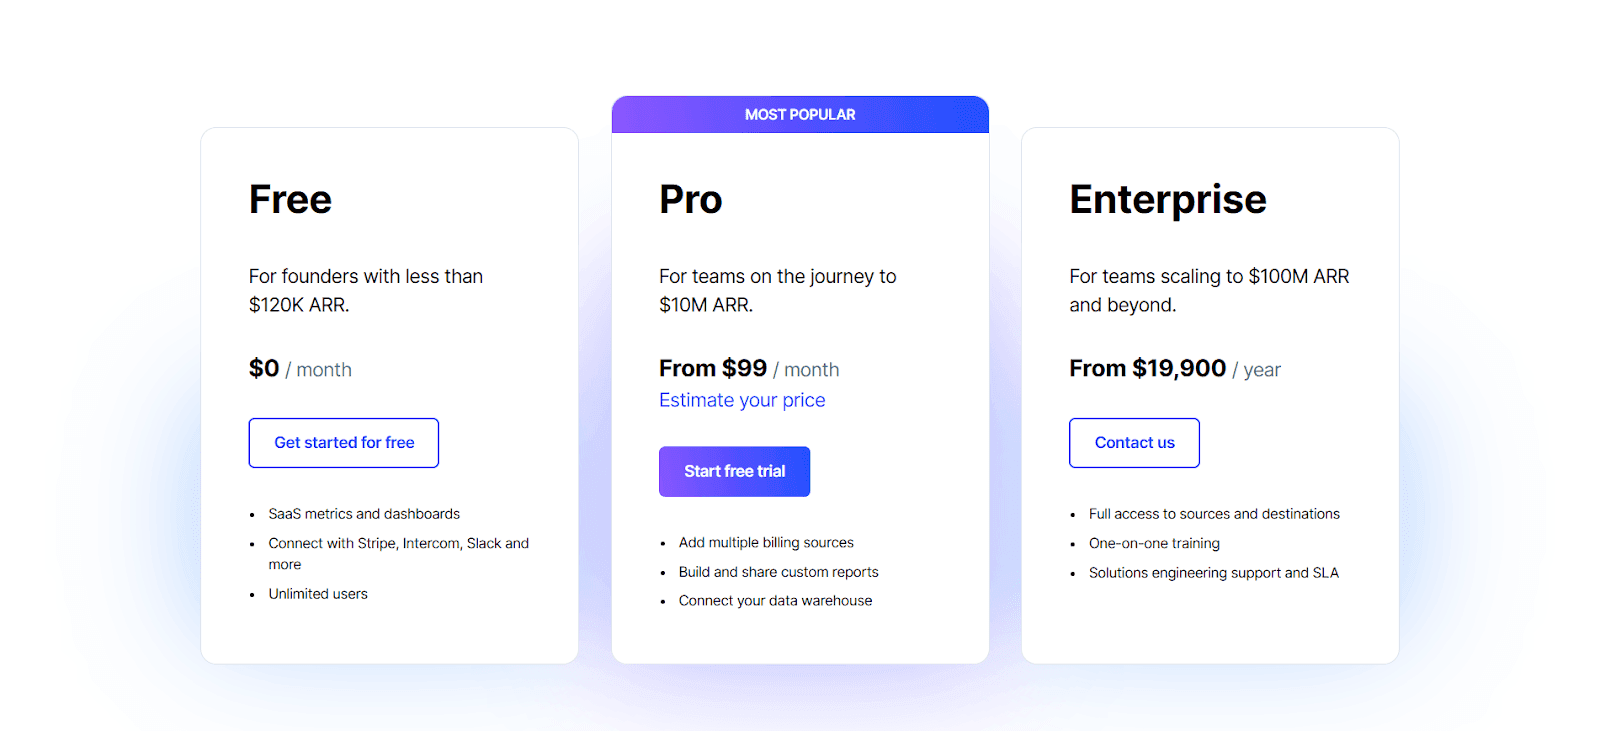
FreePlan: Free for founders with less than $120K ARR
Pro Plan: Starts at $99/month
Enterprise Plan: From $19,900/year
When ChartMogul is Most Useful
Perfect for early-stage to mid-size SaaS companies that need clear revenue visibility, investor reporting, and subscription analytics without building custom dashboards.
2. Mixpanel – Product Analytics for Data-Driven SaaS Teams
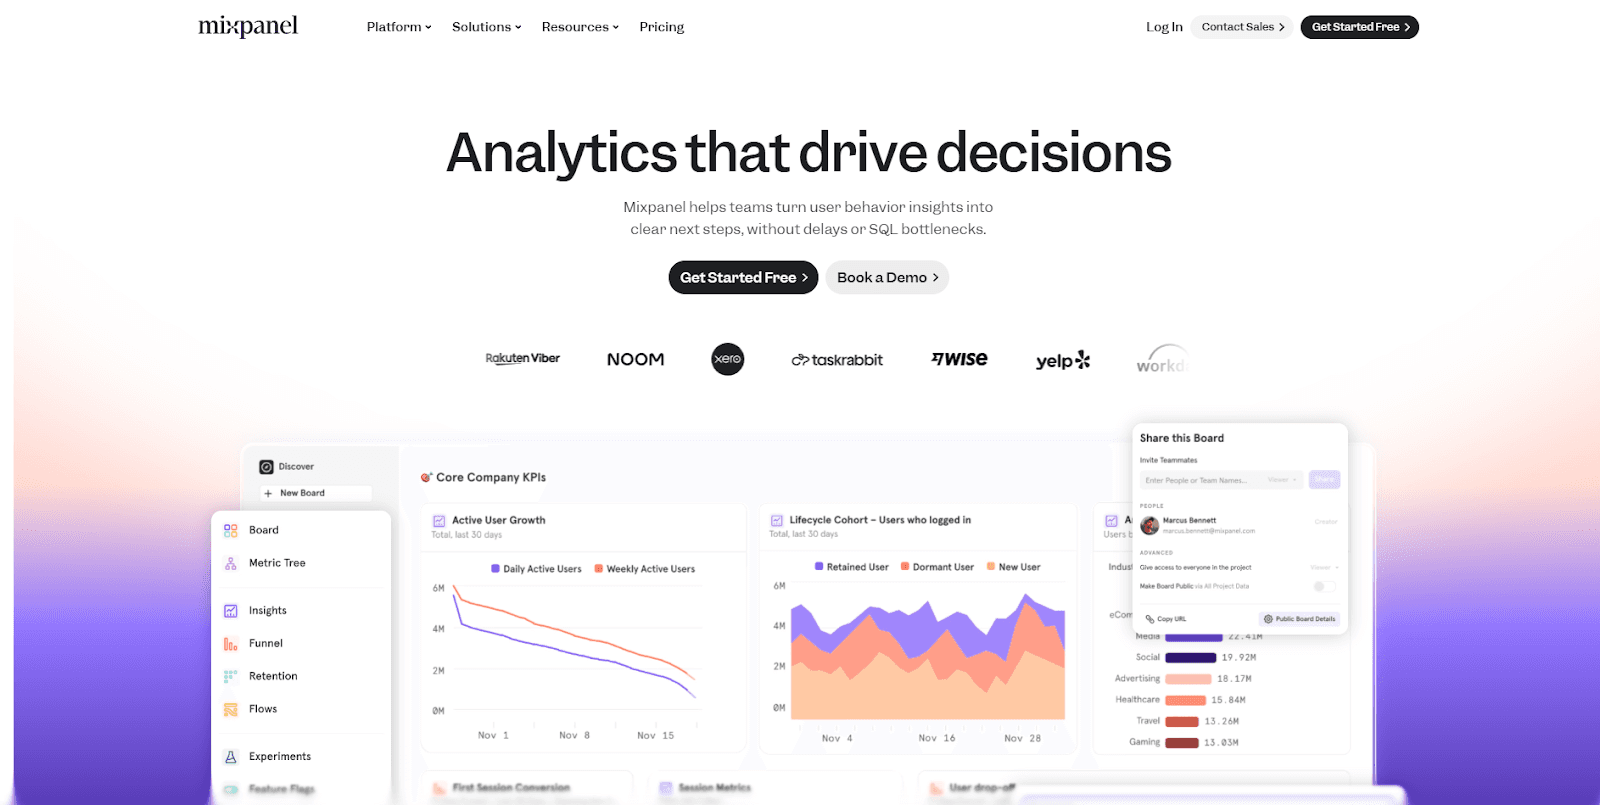
Mixpanel is a powerful product analytics platform designed to help SaaS teams understand how users interact with their product in real time.
It’s built for product managers, growth teams, and data-driven founders who want to track feature adoption, user behavior, funnels, and retention without waiting on weekly reports or heavy engineering support.
Unlike lightweight tools that focus only on surface-level metrics, Mixpanel allows teams to explore user behavior in depth while still keeping workflows fast and accessible.
Features
Event-Based Product Analytics: Track user actions such as signups, feature usage, conversions, and drop-offs with flexible event modeling.
Funnels & Retention Analysis: Understand where users convert, where they drop off, and what keeps them coming back over time.
Advanced Segmentation: Slice data by user properties, cohorts, plans, or behaviors to uncover meaningful patterns.
Real-Time Dashboards: Monitor product usage and engagement instantly as events happen.
Behavioral Cohorts: Build dynamic cohorts based on how users behave, not just static attributes.
Pros
Deep product analytics with real-time insights
Excellent funnel, retention, and cohort analysis
Scales well from early-stage to large SaaS teams
Cons
Requires thoughtful event design to get maximum value
Can feel complex for non-technical teams at first
Not focused on revenue analytics out of the box
Mixpanel Pricing
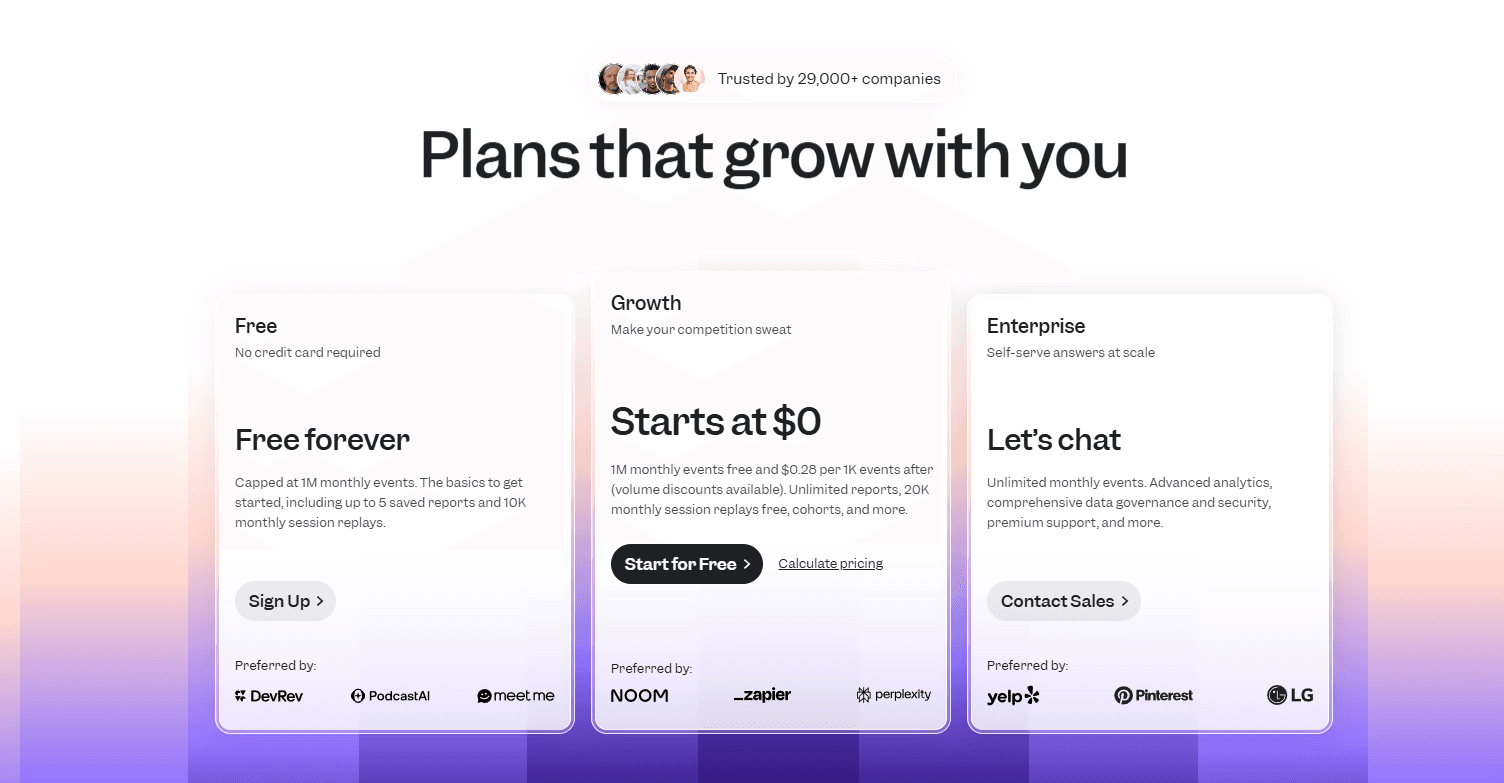
Free: Free forever plan with event-based usage limits
Growth: Usage-based pricing that scales with monthly event volume
Enterprise: Custom pricing with advanced analytics, governance, and support
When Mixpanel is Most Useful
Mixpanel is ideal for SaaS teams that want to deeply understand user behavior, optimize funnels, and improve retention through data-driven product decisions, especially when product usage insights matter more than surface-level metrics.
3. InnerTrends – Built for Onboarding, Retention & Growth Analysis
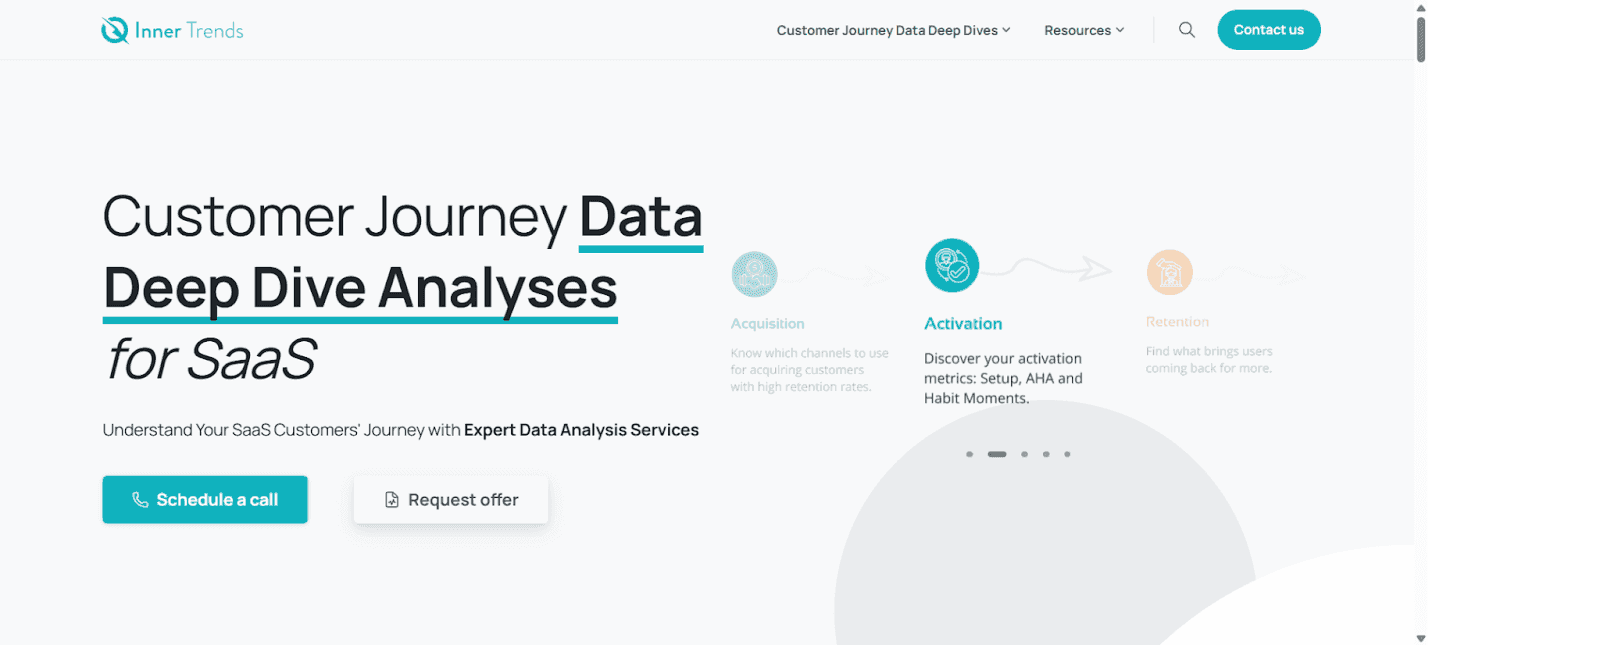
InnerTrends is a product analytics platform designed to help SaaS teams understand user behavior during onboarding, feature adoption, and long-term retention.
It’s ideal for teams focused on reducing churn, improving activation, and identifying why users drop off without needing to build complex queries.
InnerTrends turns raw event data into plain-English insights, so even non-technical teams can uncover what’s blocking growth.
Features
Onboarding Analysis: Pinpoint exactly where users drop off during onboarding and what steps drive activation.
Churn & Retention Reports: Identify the behaviors of loyal vs. churned users to reduce drop-offs.
Natural Language Insights: Get answers to questions like “Why are users not returning after sign-up?” in simple language.
Customer Journey Mapping: Visualize the full user experience from first touch to conversion and beyond.
Pros
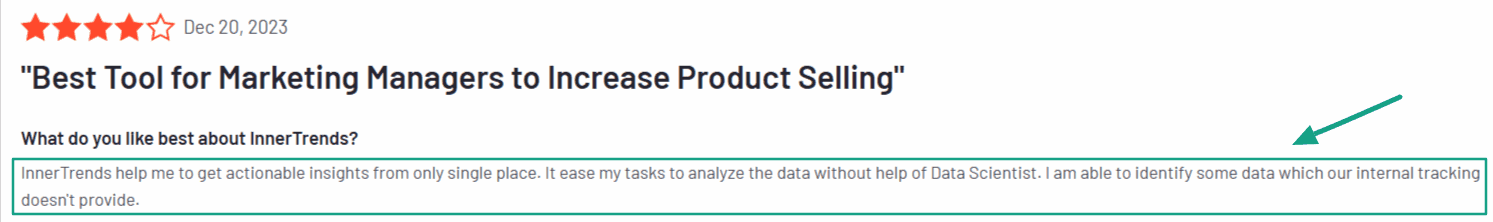
Actionable insights without SQL
Tailored for growth and onboarding teams
Great for reducing churn and improving retention
Cons
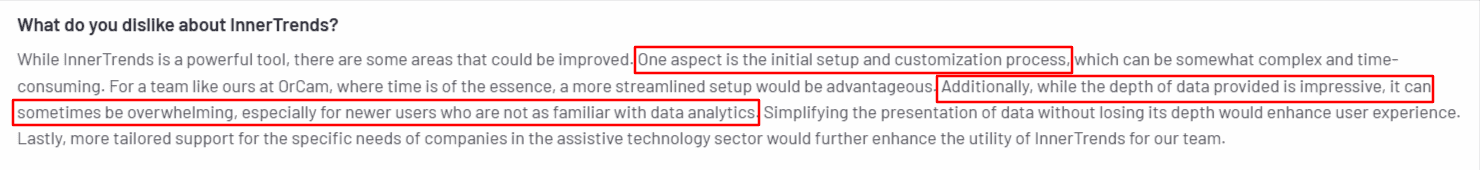
Requires event tracking setup upfront
Interface may feel complex for new users
Pricing is not transparent on the website
InnerTrends Pricing
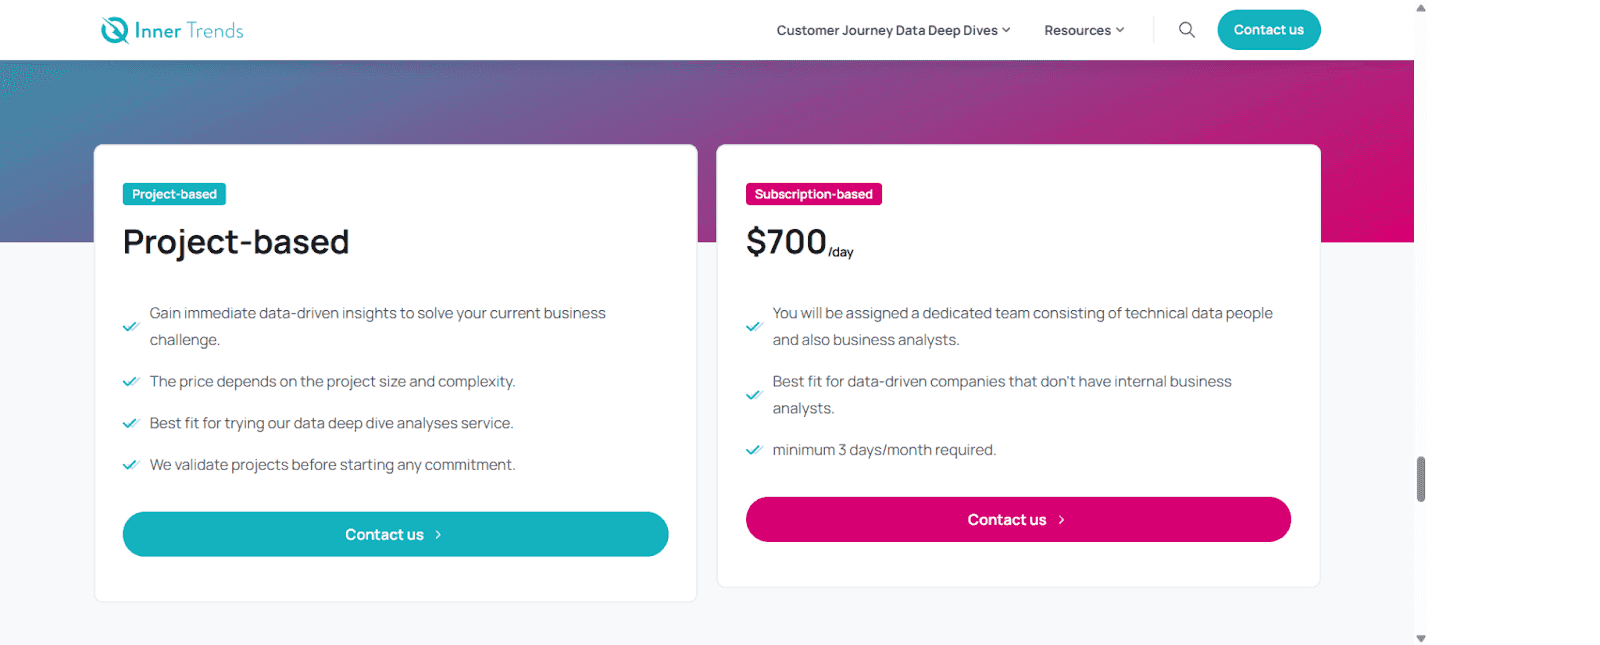
Project Based: Custom plan
Subscription Based: $700/day
Also, you can request for a custom offer based on needs in both pricing plans.
When InnerTrends is Most Useful
Best suited for SaaS teams trying to improve activation and retention by understanding exactly how users behave across the product journey.
4. Heap – Best for Full-Funnel Product Analytics
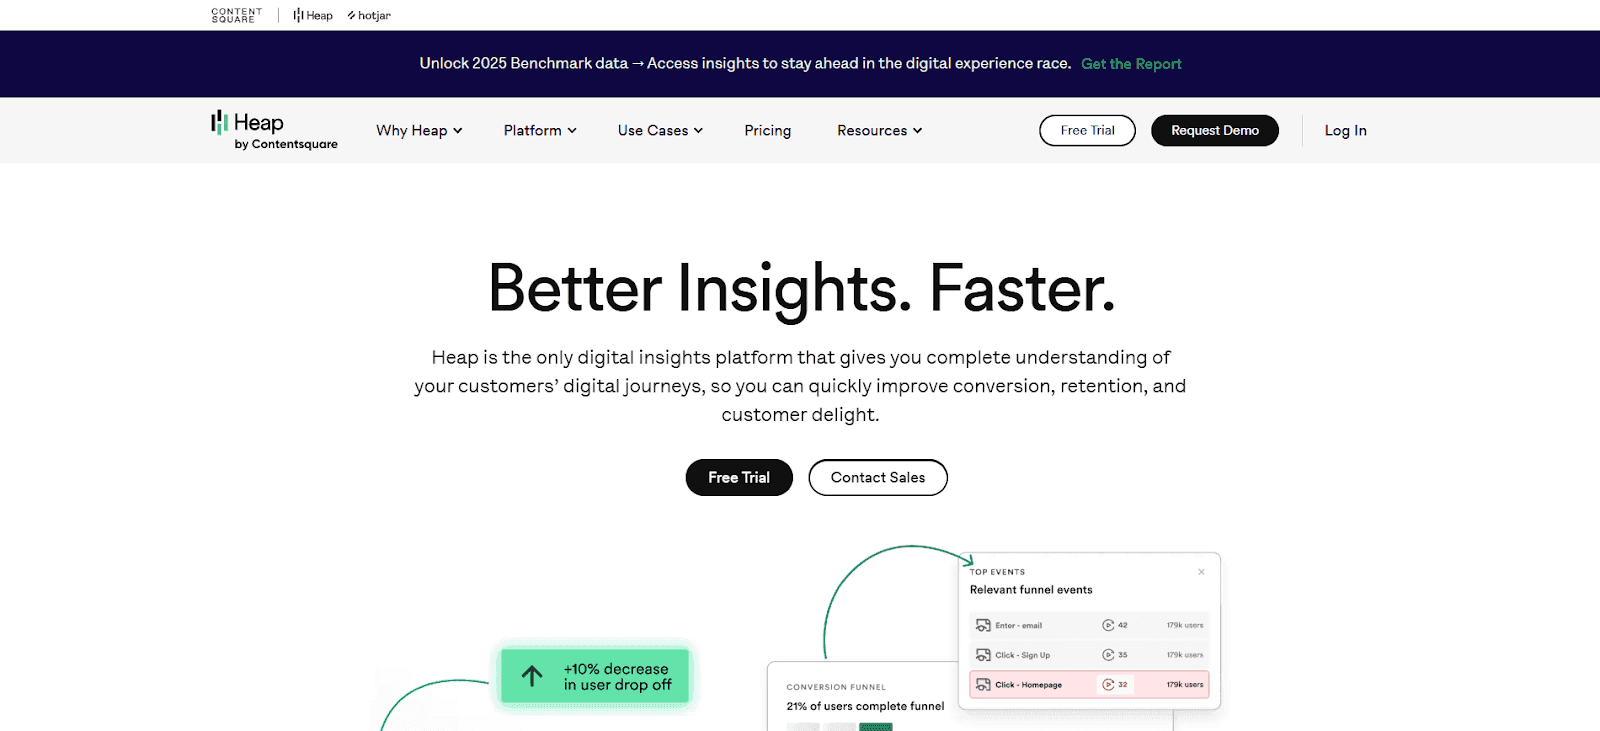
Heap is a powerful product analytics tool that automatically captures every user action across your app and there’s no manual tagging or tracking code required.
It’s ideal for data-driven SaaS teams that want deep visibility into user behavior, funnels, and drop-offs without relying on developers for every event.
Heap retroactively collects data, so you can analyze user journeys and trends even before you know what to track.
Features
Auto-Capture Everything: Tracks all clicks, page views, form submissions, and events automatically from day one.
Retroactive Analysis: Answer product questions instantly even if you forgot to tag something months ago.
Funnel & Path Reports: Visualize how users move through your product and where they drop off.
Advanced Segmentation: Drill into behavior by persona, plan type, or custom user properties.
Pros
No need to predefine events
Great for uncovering hidden user patterns
Scales well for growing data teams
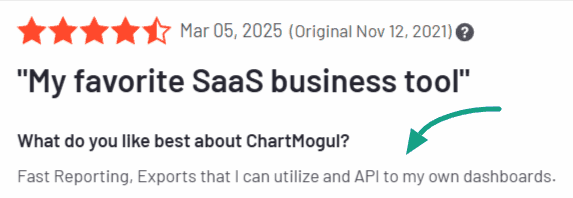
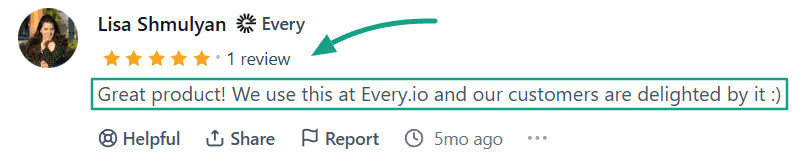
Cons
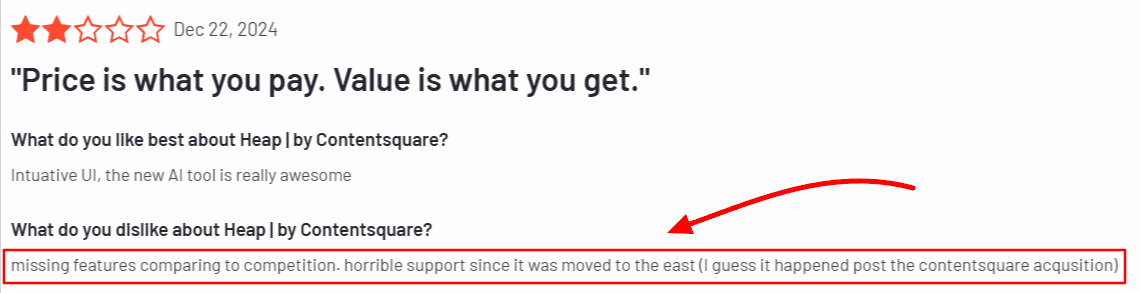
Alt tag: User review noting missing features and support concerns with Heap after the Contentsquare acquisition
Can feel overwhelming for non-technical users
Needs cleanup to avoid noisy data
Deeper analysis may require a data team
Heap Pricing
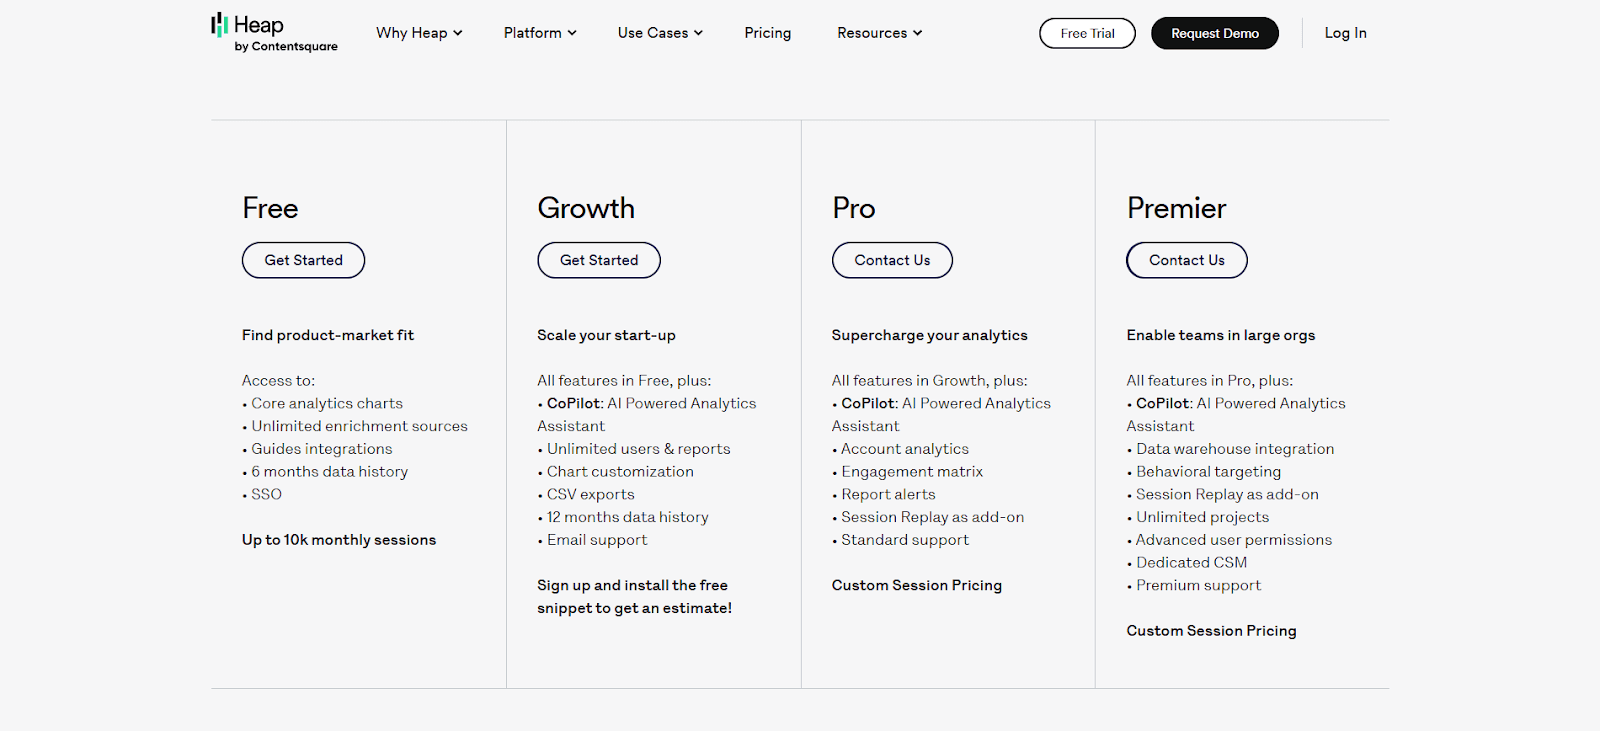
Free Plan: Up to 10,000 sessions/month
Growth Plan: Custom pricing (starts after free tier)
Premier Plan: Enterprise features, custom quote
When Heap is Most Useful
Perfect for mid to large SaaS teams that want to analyze user behavior across the entire product lifecycle especially if they need depth without complex tagging setups.
5. Amplitude – Advanced Product Analytics & Experimentation at Scale
Amplitude is a powerful product analytics platform designed for SaaS teams that need deep behavioral insights, experimentation, and governance as they scale.
Unlike tools focused purely on dashboards or basic event tracking, Amplitude is built to help product and growth teams understand how user behavior changes over time, measure the impact of features, and run experiments with confidence.
Amplitude is especially strong when analytics, experimentation, and decision-making need to work together across product, engineering, and leadership teams.
Features
Event-Based Product Analytics: Track detailed user behavior across features, journeys, and lifecycle stages.
Behavioral Cohorts: Build dynamic cohorts based on real usage patterns, not static attributes.
Funnels & Retention Analysis: Analyze conversion paths, drop-offs, and long-term engagement.
Experimentation & Feature Testing: Run A/B tests and measure feature impact directly inside the platform.
Advanced Governance & Permissions: Control data access and analytics workflows across large teams.
Real-Time Data Streaming: Monitor product activity as it happens.
Pros
Deep, enterprise-grade product analytics
Strong experimentation and feature impact analysis
Excellent cohort and behavioral segmentation
Built for collaboration across product, growth, and data teams
Cons
Steeper learning curve than lightweight analytics tools
Requires clean event tracking to unlock full value
Pricing can scale quickly for high-volume products
Amplitude Pricing
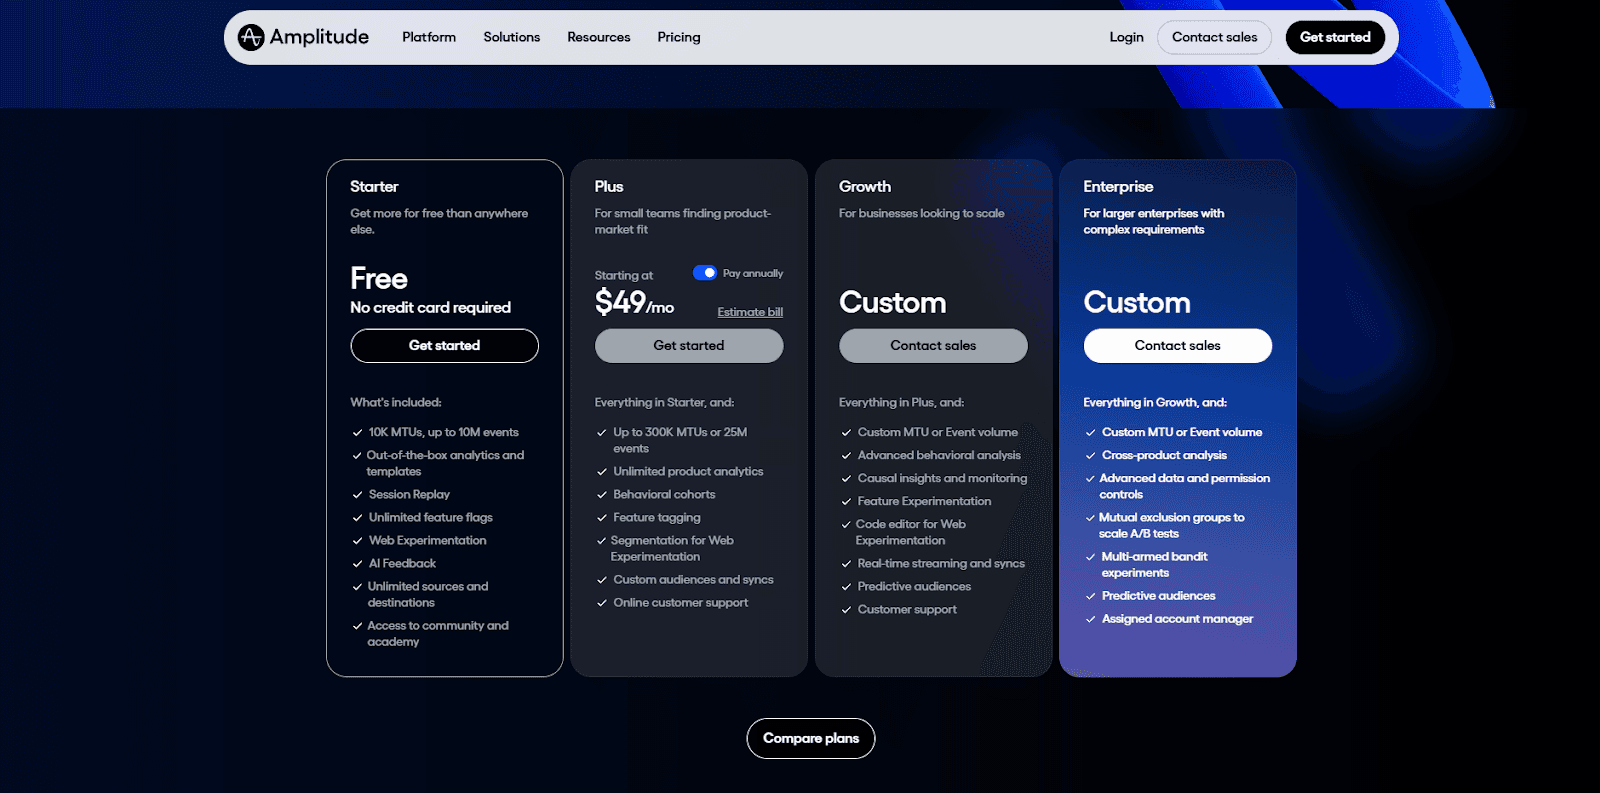
Starter: Free (up to 10K MTUs and 10M events)
Plus: From $49/month
Growth: Custom pricing
Enterprise: Custom pricing
When Amplitude Is Most Useful
Amplitude is best suited for scaling and enterprise SaaS companies that need advanced product analytics, experimentation, and behavioral insights to guide product strategy and growth decisions.
It’s a strong choice when teams want to move beyond surface-level metrics and understand why users behave the way they do, which features drive impact, and how experiments influence retention and conversion.
5 Popular Financial Analytics Tools for CFOs
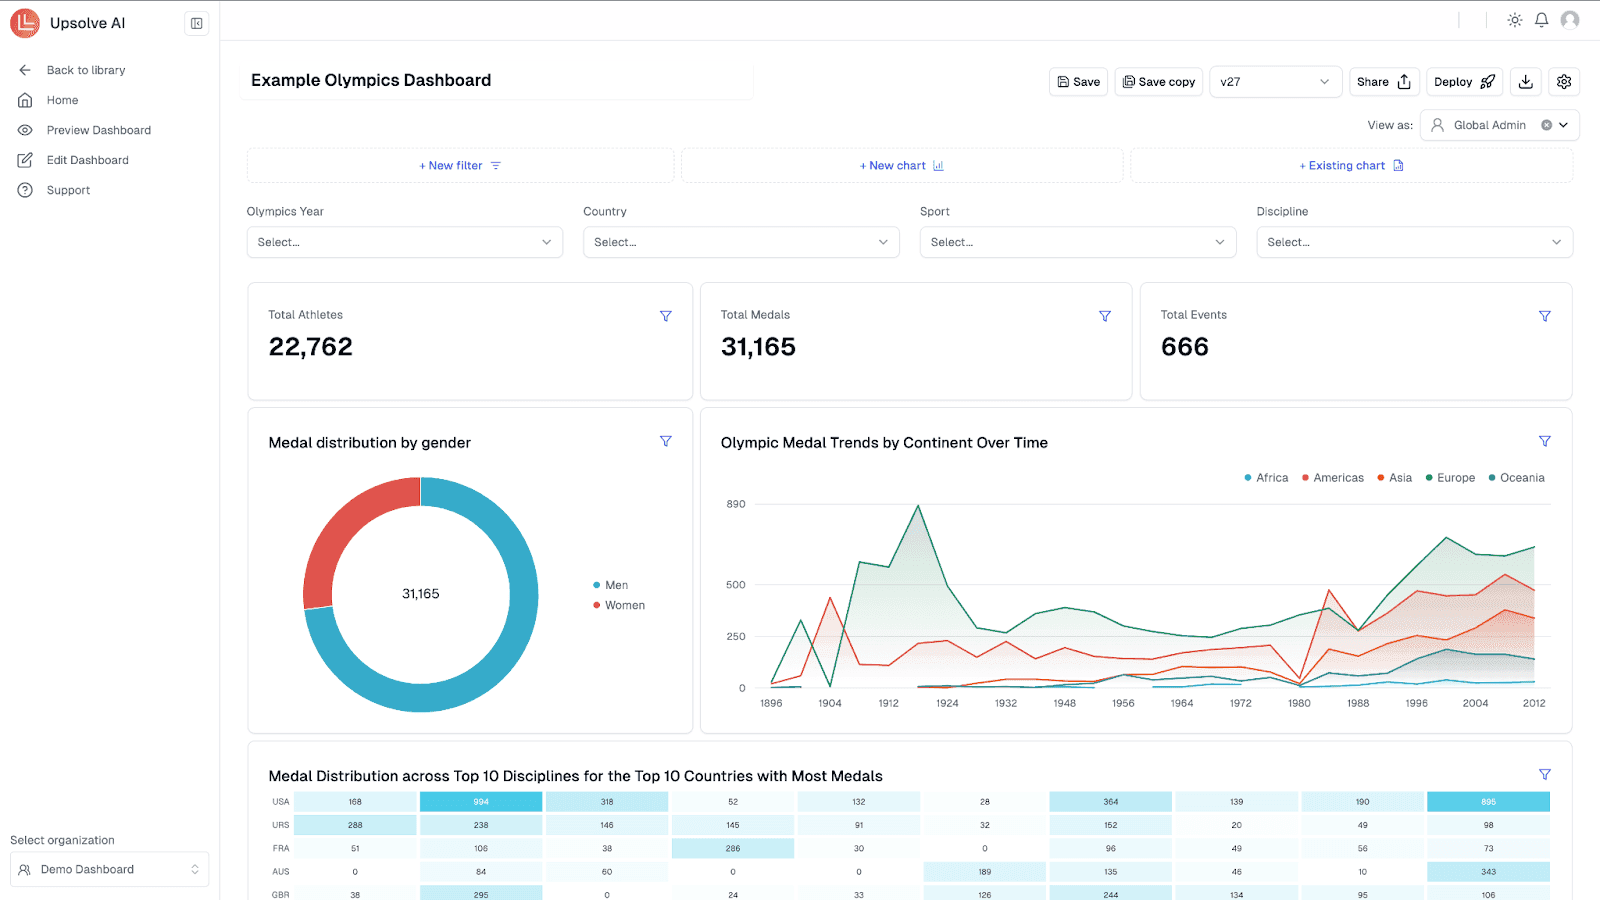
6. Upsolve AI – Embedded, Agent-Driven Analytics for SaaS Products
Upsolve AI is an agentic analytics platform that SaaS companies use to put analytics inside their products. Business users and your customers work through an Agentic Dashboard, asking questions in natural language and describing the charts they want for the agent to build, while your data team uses Agent Studio to encode the metric definitions and business rules that keep answers accurate.
Those agent-driven dashboards embed directly into your app, so customers get insights in context, and your team spends less time building one-off dashboards and more time on the core product.
Features
Agentic Dashboard: build dashboards by asking in natural language and describing the charts you want, no coding required.
Agent Studio: your data team encodes metric definitions and business rules so answers stay accurate.
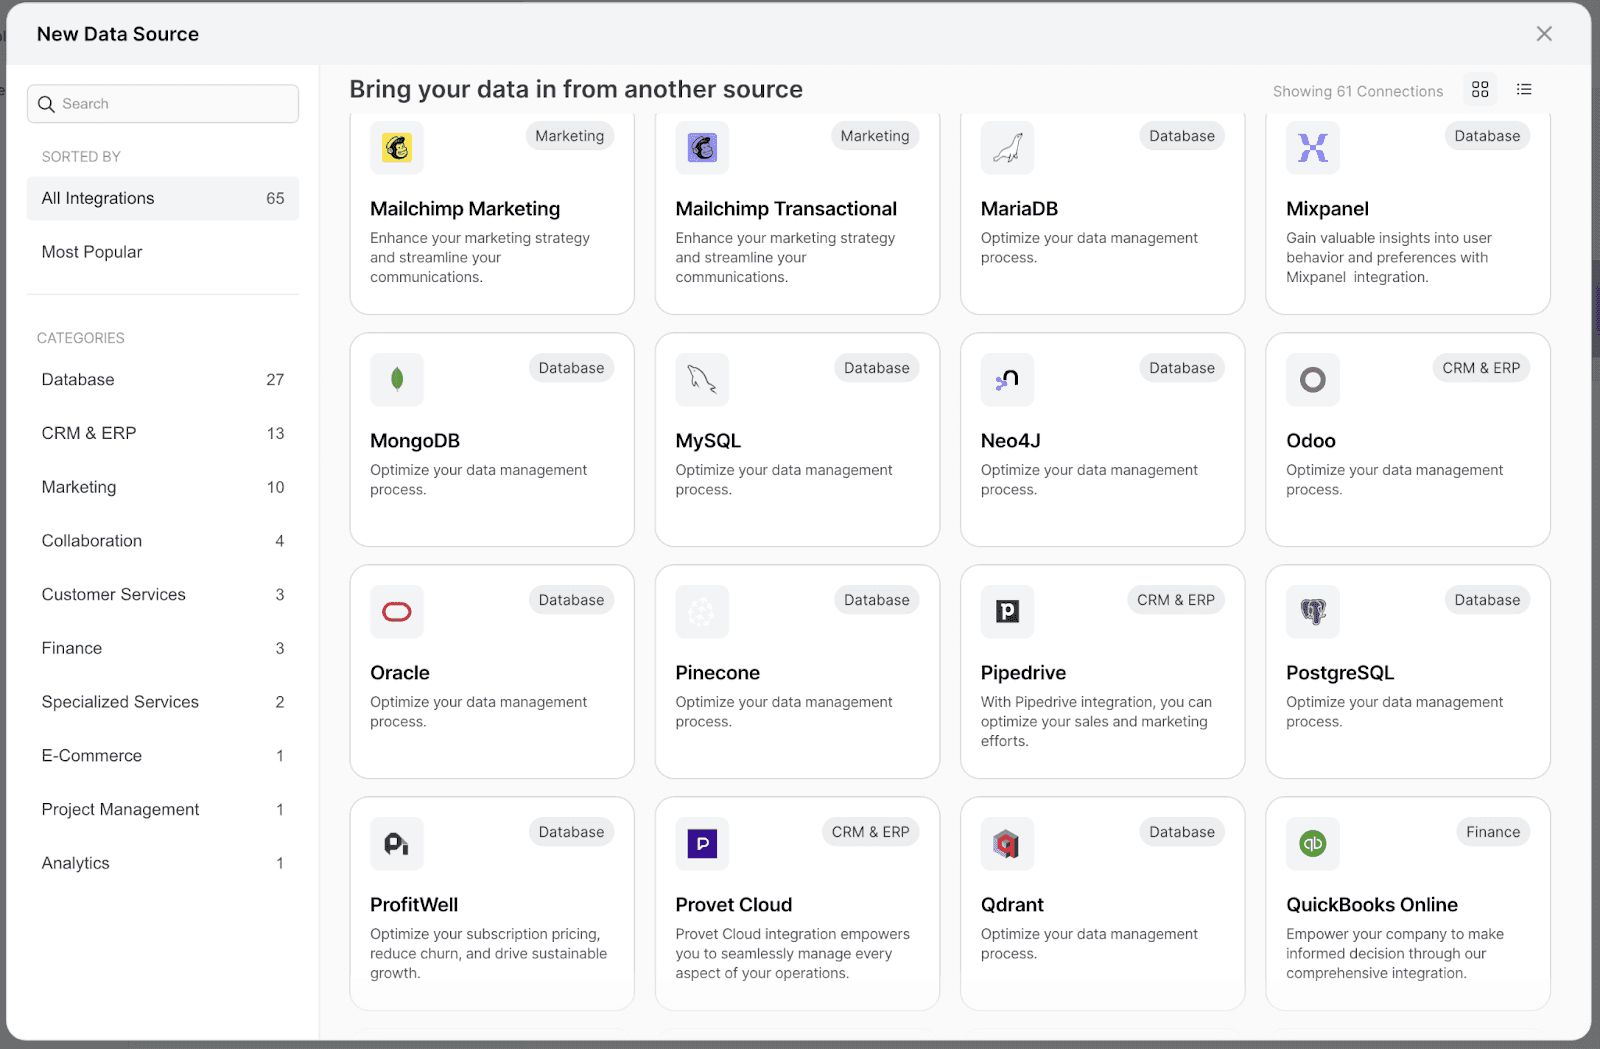
Data integration: connect to major databases and data warehouses for quick setup.
End-user personalization: customers tailor their own dashboards and views.
Embed options: drop dashboards into your app via React components or iFrame integrations.
Pros
Fast deployment with minimal engineering effort
Strong end-user engagement through in-product, self-serve analytics
Business users build and customize without code
Cons
Initial setup may require developer assistance
Advanced features have a moderate learning curve
Less suited to extremely specialized analytics needs
Upsolve AI Pricing
Upsolve AI offers a free plan plus three paid tiers, billed around monthly credit usage:
Free ($0): 2,000 one-time credits (~200 questions); all Pro features, to test-drive
Pro ($500/mo): 2,000 credits/month; 50+ data connections, unlimited agents, full observability
Team ($2,000/mo): 10,000 credits/month; adds embedding, RBAC/row-level security, multi-tenant, and semantic-layer generation
Enterprise (custom): on-prem/VPC, SAML SSO, HIPAA, SOC 2, and BYOM
Annual billing is 20% off.
When Upsolve AI is Most Useful
Upsolve AI is most useful for SaaS companies that want embedded, agent-driven analytics inside their products, giving customers self-serve insights without heavy developer involvement.
Now, after exploring each tool, you might get an idea about which tool might be a perfect choice, but selecting a preferred SaaS analytics tool for your B2B will always depend on your unique goals, current needs, and future growth plans.
KPIs to Track from a B2B SaaS Analytics Tool
To get maximum value from your SaaS analytics software, it’s crucial to track KPIs that truly measure your company's health and help drive smart, actionable decisions.
Here's a clear, structured breakdown of essential KPIs and why each matters:
KPI | What it Means | Why it Matters |
Monthly Recurring Revenue (MRR) | Revenue generated monthly from subscriptions | Shows predictable growth and revenue stability |
Customer Acquisition Cost (CAC) | Average cost to acquire a new customer | Indicates profitability and growth efficiency |
Churn Rate | Percentage of customers canceling their subscriptions | Reflects customer satisfaction and retention risk |
Activation Rate | How many new users become active customers | Highlights onboarding effectiveness and early value |
Feature Adoption Rate | How many users regularly use specific features | Helps you understand what’s driving customer value |
Tracking these KPIs consistently empowers you to proactively manage growth, optimize product experience, and keep your SaaS business on a healthy trajectory.
How to Use AI to Build an Analytics Dashboard in Minutes? [No Code]
Final Thoughts: What Makes a Great B2B SaaS Analytics Tool?
In the end, the best analytics tools for SaaS teams aren’t just about dashboards or complex charts. They’re tools that help teams make smarter, faster business decisions.
Great analytics software combines usability with powerful capabilities. It delivers real-time insights, connects product and revenue data, and helps teams understand not just what is happening, but why.
Strong analytics isn’t about collecting more data. It’s about turning data into clear actions. The right tool helps teams spot trends early, identify problems before they escalate, and uncover opportunities for growth.
When choosing a B2B SaaS analytics tool, focus on your current stage, your team’s workflows, and the decisions you need to make today, while ensuring the platform can scale as your business grows.
That’s how analytics becomes a true growth asset, not just another dashboard.
FAQs
What is the difference between product analytics and revenue analytics?
Product analytics tracks how users interact with your app.
Revenue analytics focuses on subscription metrics like MRR, churn, and LTV.
Which SaaS analytics tools are best for early-stage startups?
ChartMogul and Upsolve AI offer simple setups, clean dashboards, and affordable plans that work well for smaller, fast-moving teams.
Can I use multiple tools together?
Yes, many teams combine tools.
For example, you can use ChartMogul for billing data, Heap for product behavior, and Upsolve AI for real-time AI-driven insights which gives it a fuller view of the customer journey.
What should I look for in a SaaS dashboard?
Look for clarity, real-time updates, customization, and metrics that align with your team’s goals. Avoid dashboards overloaded with vanity data.
How often should I review SaaS metrics?
Ideally, key metrics should be reviewed weekly.
Some teams check daily, while others rely on alerts and monthly reviews for deeper trends.

Try Upsolve for Embedded Dashboards & AI Insights
Embed dashboards and AI insights directly into your product, with no heavy engineering required.
Fast setup
Built for SaaS products
30‑day free trial


