
We tested embedded BI tools across setup, pricing, scalability, and customer-facing analytics to help SaaS teams choose the right solution.

Ka Ling Wu
Co-Founder & CEO, Upsolve AI
10 min

Disclosure: Upsolve AI publishes this article and is included below as one option among several. We have kept the comparison balanced and left Upsolve out of any ranked "winner" position; evaluate all tools against your own requirements.
Embedded business intelligence allows SaaS products to surface dashboards, reports, and data insights directly inside the application, so users can make decisions without exporting data or switching tools. For many teams, embedded analytics is no longer optional. It has become part of the core product experience.
The real challenge is not whether to embed analytics, but how to choose the right platform. Embedded BI tools differ significantly in how they handle multi-tenant data, security, customization, and pricing as usage scales. Platforms that look similar in demos can behave very differently once they are embedded into a real SaaS environment.
This guide focuses on the practical factors that matter most when evaluating embedded BI today. It highlights the key trade-offs between leading solutions, helping you choose a platform that fits your product, your team, and your users rather than a generic feature checklist.
What Are Embedded BI Tools?
Embedded BI allows SaaS products to integrate analytics and reporting directly into the application, so users can access data insights as part of their normal workflow, without switching tools or exporting data.
Embedded BI vs Traditional BI
The key difference between embedded BI and traditional BI is where analytics live. Traditional BI tools are typically standalone platforms used by internal teams, while embedded BI delivers dashboards and reports inside the product itself.
For example, in a CRM with embedded BI, users can view customer performance or pipeline metrics without leaving the application, making analytics more accessible and relevant to day-to-day usage.
How Embedded BI Tools Integrate With SaaS Platforms
Embedded BI tools integrate with SaaS platforms using several technical approaches, depending on how much flexibility, customization, and engineering control a team needs. Common methods include:
API integration, which exposes analytics programmatically and allows dashboards or charts to be rendered directly inside the application.
iFrame embedding, a faster setup option that displays analytics within the app with minimal engineering effort.
SDKs and development kits, which let teams build analytics into the UI using front-end frameworks for a more native experience.
Single Sign-On (SSO), enabling secure access without separate credentials and simplifying user management.
These approaches allow teams to balance speed, customization, and security while delivering analytics that feel integrated into the product experience.
Now that the basics are clear, the next step is understanding why embedded BI is so important for SaaS products.
Why Are Embedded BI Tools Important For SaaS?
Embedded BI plays a different role in SaaS products than traditional analytics tools. Instead of supporting internal reporting, embedded analytics becomes part of the product itself, shaping how users interact with data on a daily basis.
Key reasons embedded BI matters for SaaS include:
More actionable decision-making: By surfacing relevant metrics directly inside the product, embedded BI helps users spot trends and act on data in real time. This reduces reliance on exported reports and enables faster, context-aware decisions within the workflow.
Stronger product experience and retention: When analytics feel native to the application, users are more likely to engage with data regularly. Clear, accessible insights increase perceived product value, which can directly influence retention and reduce churn over time.
Higher adoption of analytics features: Analytics that are embedded into core product flows are used more consistently than standalone dashboards. This makes data part of everyday usage rather than an occasional, expert-only activity.
Scalability for customer-facing analytics: As SaaS products grow, embedded BI tools must support multi-tenant data access, security controls, and increasing query volumes. Platforms built for embedded use cases are designed to scale analytics alongside your customer base without breaking performance or cost models.
Understanding these benefits is only the first step. The next challenge is choosing an embedded BI platform that aligns with your product architecture, team resources, and long-term growth.
Where Embedded BI Is Heading: From Dashboards to Embedded Agents
Most embedded BI tools were built around the same unit: a dashboard you configure once and embed. That model is shifting. The emerging expectation is that your customers should not just view a dashboard, they should be able to ask a question in plain language and get an answer inside your product.
That is the move from embedded dashboards to embedded analytics agents. Instead of building every view your customers might need, you embed an agent that answers their questions, builds the chart, and handles the follow-up, scoped to each tenant's data. It is the same shift internal analytics is going through, delivered to your end users.
The catch is accuracy, and it raises the bar for embedded analytics specifically. A wrong number shown to your own team is an internal problem; a wrong number shown to a paying customer is a trust problem. An agent is only as reliable as the context behind it: what each metric means, which table is authoritative, which customer may see which row. That is why context, not the model, determines whether an embedded agent is trustworthy, and why teams evaluating platforms now weigh what to look for in an agent builder alongside the traditional embedded-BI checklist below.
What Should You Consider When Considering An Embedded BI Tool?
Here are 11 key factors you should consider when choosing an embedded BI tool:
Feature | Explanation |
Integration | Ensure the tool integrates seamlessly with your existing SaaS platform or other tools like CRMs and ERPs. |
Cost per User / Report | Understand pricing, whether it’s per user, per report, or usage-based. This is especially important if you plan to scale to many external users. |
Scalability | Check how well the tool can grow with your business. It should handle increasing data volumes and user counts as your platform expands. |
Customization | Look for the ability to customize dashboards, reports, and user experiences so analytics match your product’s look and use cases. |
Ease of Use | The tool should be easy to use for both your internal team and end users. A steep learning curve can slow adoption. |
Support & Documentation | Ensure the vendor provides strong customer support and clear documentation to help with setup, troubleshooting, and long-term use. |
Mobile Access | Confirm whether the tool supports mobile access, which is important if users need to view reports on the go. |
Security Features | Verify that the platform includes robust security such as encryption, role-based access, row-level security, and data governance. |
Data Connectivity | Check whether the tool can connect to all relevant data sources, including cloud databases, warehouses, and spreadsheets. |
Speed of Setup | Some tools are quick to deploy while others require more configuration. Consider how fast you need analytics live in your product. |
Visualization Options | Look for clear, interactive visualizations that help users interpret data easily without advanced analytics skills. |
Top 6 Business Intelligence Tools For Embedded Analytics
Here's a quick comparison table of all the tools to see which one best meets your needs.
Factor | Upsolve AI | Holistics BI | Tableau | Looker | Microsoft Power BI | Qlik Sense |
Primary Focus | Customer-facing analytics for SaaS apps (external users). | Modern BI + embedded analytics with dev-first workflows. | General BI & data visualization with embedded options. | API-first BI with strong semantic layer & embedding. | Broad self-service BI with an “Embedded” SKU for apps. | Associative analytics engine with strong embedded & self-service. |
Best For | SaaS teams that want ready-to-ship customer dashboards without heavy engineering. | SaaS products that want governed metrics + mini BI inside the app with strong reuse. | Companies that want premium visuals and can afford per-user enterprise pricing. | Teams in/around Google Cloud that want a semantic layer + embedded workflows. | Teams already in the Microsoft ecosystem needing affordable BI + embedded. | Orgs with many data sources who want to explore relationships & embed insights. |
Embedding Style | React / Vue component + iFrame embedding for customer-facing dashboards. | Secure iFrame-based embedding (public/signed) + embedded “portal” UX. | JavaScript API, iFrames, and embedded views inside web apps/portals. | API-first embedding (iframed experiences + programmable data experiences). | Power BI Embedded (REST + JS SDK) for app embedding. | iFrames, mashups, and Qlik’s web embedding options. |
Time to Production | Very fast – positioned for rapid setup using templates. | Moderate – requires semantic modeling + Git workflow, then scales well. | Medium–High – visual building is easy, but governance/infra takes time. | Medium–High – setup of models, permissions, and infra is needed. | Medium – especially fast if you already use Azure/M365. | Medium–High – powerful, but setup & modeling can take longer. |
Engineering Effort | Low – built to reduce load on engineering; drag-and-drop + simple embed. | Medium–High – analytics-as-code, Git, RLS, tenants; devs heavily involved. | Medium – creators need BI skills; embedding devs handle integration. | Medium–High – strong for data teams; requires modeling & API work. | Medium – easier for teams familiar with Microsoft stack & Azure. | Medium–High – flexible but more complex for advanced use cases. |
Multi-Tenancy & RLS | Supports multi-tenant customer analytics & per-tenant dashboards (via plans & setup). | Strong: row-level security, multi-tenant isolation, dynamic parameters baked in. | Possible via row-level security and advanced admin setup. | Strong: semantic layer + permissions for multi-tenant data. | Supported via RLS and workspace design, esp. in Embedded. | Strong: section access / security rules for multi-tenant scenarios. |
Customization / White-Labeling | Good: simple theming and embedded components that feel native, but not ultra-deep custom viz control. | Strong: custom themes, CSS, styling – good for native-feeling dashboards. | Strong visual customization, but full white-labeling can be complex. | Good: API-first lets you build custom data experiences around it. | Good: can match app styling, but some limits on ultra-granular control. | Good, but some users feel layout and design options are a bit constrained. |
Self-Service for End Users | Focused on pre-built customer dashboards + usage analytics; not a full self-service BI workbench for internal analysts. | Very strong: explore, filter, drill, and build dashboards inside embedded portal. | Strong: interactive dashboards & ad-hoc exploration for business users. | Strong: governed self-service on top of semantic model. | Strong: users can self-serve with reports and dashboards. | Strong: self-service dashboards + associative exploration. |
Semantic Layer / Metrics Governance | Light – more about quick customer-facing insights than deep internal metric modeling. | Core strength – governed semantic layer for reusable, consistent metrics. | Limited semantic layer vs Looker/Holistics; relies more on data models & calc fields. | Major strength – universal semantic model (single source of truth). | Measures & models via DAX/tabular models, but less “semantic layer first” by design. | Uses associative model; governance possible but not branded as “semantic layer.” |
AI / Smart Insights | AI-powered data suggestions & insights focused on customer-facing dashboards. | AI chat + smart exploration for end users (on top of modeled data). | Tableau AI / Pulse for smart recommendations (in higher tiers/Tableau+). | Google’s AI-backed insights & ML integrations. | AI features (e.g., quick insights, smart visuals) within the Power BI stack. | AI-powered suggestions & predictions in higher plans. |
Deployment Options | Cloud SaaS; focuses on embedding into your existing SaaS product. | Cloud-only (no on-prem). | Cloud & on-prem options via Tableau Server/Cloud. | Cloud-focused (Google Cloud) with enterprise-grade hosting. | Cloud-first (Power BI Service, Fabric) with embedded capacity. | Cloud, on-prem, and hybrid options (esp. at Enterprise tier). |
Pricing Model (High Level) | Free tier + paid plans (Pro $500/mo, Team $2,000/mo for embedding/multi-tenant/RBAC, Enterprise custom); usage-based credit billing rather than per viewer | Starts around $800/mo; usage-based (queries/compute), not per viewer – good for many embedded users. | Per-user licensing (Creator/Explorer/Viewer) + enterprise SKUs – can get expensive at scale. | Custom quotes per edition (Standard/Enterprise/Embed); priced by users + API usage. | Very affordable per-user (Pro/PPU); Power BI Embedded priced by capacity. | Standard/Premium/Enterprise tiers from $825/mo+, capacity-based and relatively premium. |
Cost Efficiency for Embedded (Many Users) | Good: credit-based billing rather than per-viewer; embedding lives at Team plan ($2,000/mo) so cost scales with usage, not seat counts. | Very good: usage-based, no per-viewer tax. | Weaker: per-user pricing makes large external audiences costly. | Depends on deal; Embed Edition can scale, but pricing is opaque. | Good: capacity-based Embedded is cost-effective for many external users. | Good but premium: capacity-based with higher starting price. |
Internal vs External Analytics Fit | Best for external/customer-facing analytics; not a full internal BI replacement. | Good for both internal & embedded, especially where engineering owns analytics. | Strong for internal BI; embedded is solid but not its only focus. | Strong for both internal and embedded enterprise use cases. | Great for internal BI; embedded is strong if you’re already in Microsoft land. | Great for internal analytics + embedded where associative exploration matters. |
Learning Curve | Low–Medium for PMs/analysts; minimal setup for core use cases. | Medium–High: analytics-as-code & Git require technical maturity. | Medium: easy basics; advanced modeling/optimization can be complex. | Medium–High: semantic modeling + APIs + governance. | Medium: easy to start; advanced DAX/modeling takes time. | Medium–High: associative model & advanced features require learning. |
Who Should Seriously Consider It? | SaaS teams who want fast, low-engineering customer-facing dashboards with AI insights. | Product/data teams who want dev-friendly, governed embedded BI without paying per viewer. | Data-driven orgs that want top-tier visuals & enterprise governance and can pay for it. | Teams already on Google Cloud needing a central semantic layer + embedded. | Orgs living in Microsoft 365/Azure that want low-cost BI + embedded in their stack. | Orgs with complex, multi-source data who value associative exploration and can invest in a premium BI stack. |
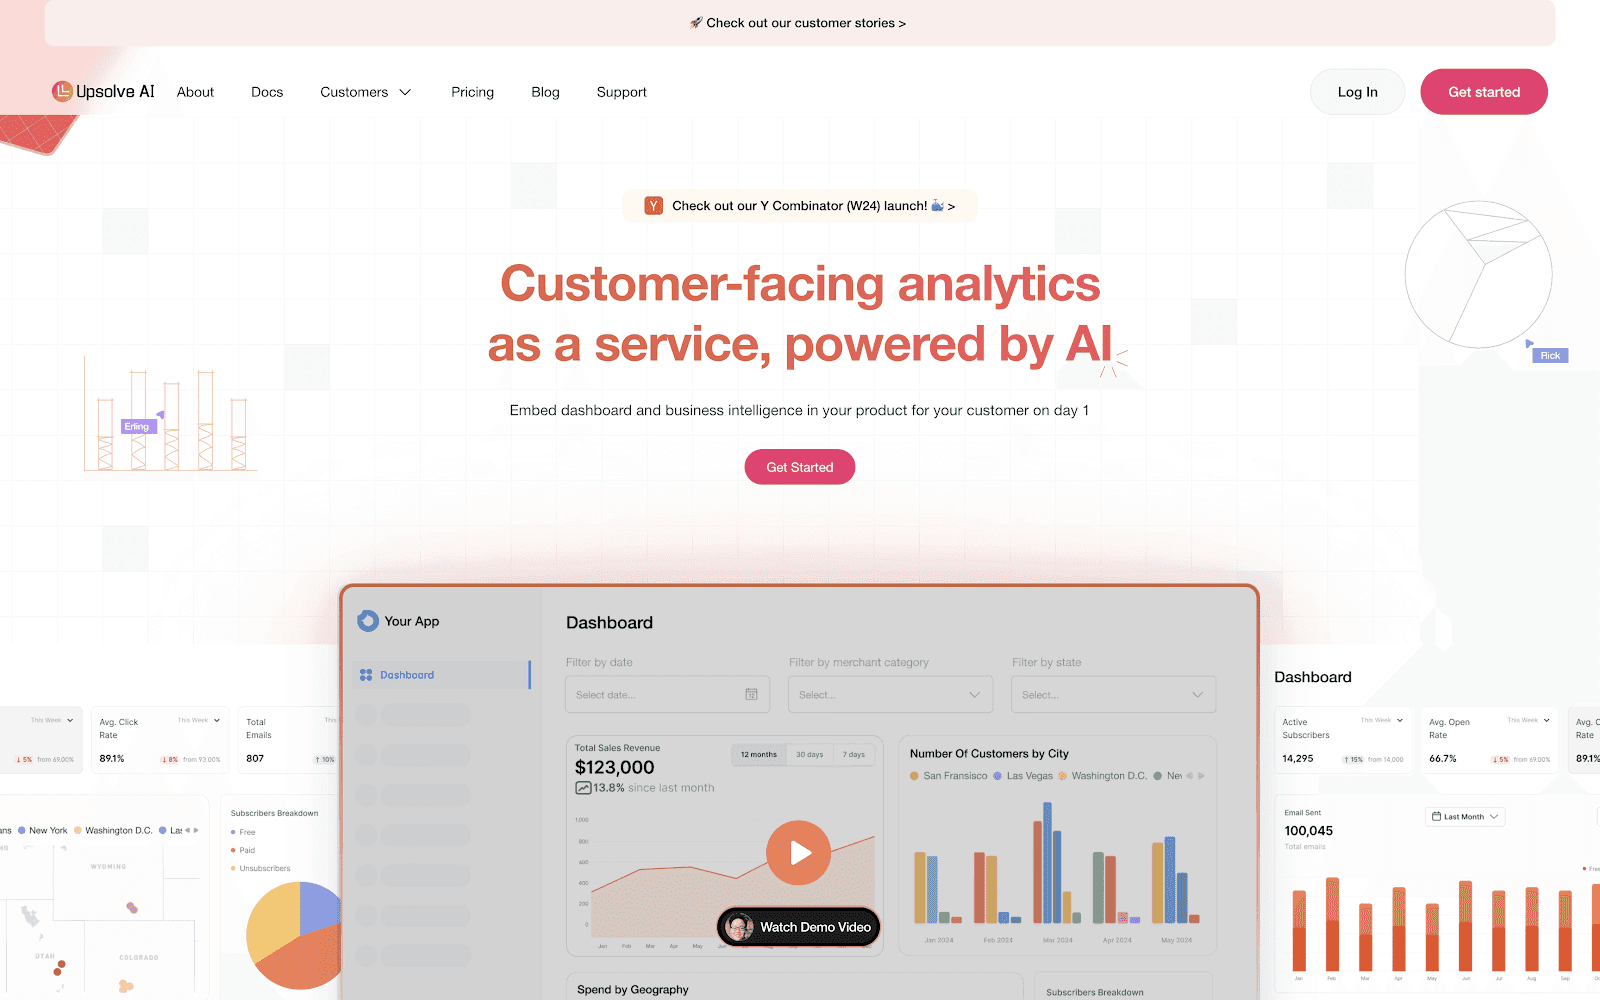
Upsolve AI
If you're looking for customer-facing analytics, Upsolve AI is an agentic analytics platform that helps SaaS teams embed dashboards and an analytics agent directly into their products. Business users ask questions in plain language and the agent builds the view, while your data team encodes the metric definitions and access rules in Agent Studio.
It is built for external, customer-facing use cases, delivering analytics that feel native to the product. For the underlying approach, see how analytics agents deliver personalized, per-customer dashboards.
Key Features
Fast deployment: Pre-built templates and an analytics agent get customer-facing analytics live quickly, without long implementation cycles.
Natural-language answers: End users ask questions in plain language and the agent builds the chart, surfacing patterns and anomalies without manual dashboard work.
Encoded context: Metric definitions, business rules, and access controls are encoded once in Agent Studio, so answers stay consistent and trustworthy across tenants.
Embedded delivery: Upsolve embeds via iFrame or React and Vue components, integrating analytics directly into SaaS applications.
Usage analytics: Teams can track how customers interact with dashboards to inform product and analytics decisions.
Pricing
Upsolve AI offers a free test-drive plan and three paid tiers; embedding and multi-tenant analytics start on the Team plan ($2,000/month). Paid plans are structured around monthly credits, with $0.05/credit overage.
Free — $0
A full test-drive of Upsolve with Pro features unlocked.
2,000 one-time credits (~200 analytical questions)
All Pro features unlocked
Community support
Pro — $500/month
For teams getting started with AI-powered analytics.
2,000 credits/month (~200 questions/mo), $0.05/credit overage
50+ data connections, unlimited agents
Charts & visualization, context management suite, full observability & eval
MCP App, priority email support
Team — $2,000/month
For teams that need embedding, RBAC, and a semantic layer. Everything in Pro, plus:
10,000 credits/month (~1,000 questions/mo), $0.05/credit overage
Row-level security / RBAC, embed Upsolve in your product, multi-tenant support
AI Cockpit for data modeling & semantic-layer generation
AI dashboards + email scheduling, dedicated support, bulk credit discount
Enterprise — Custom
For custom deployment, security, and model-routing. Everything in Team, plus:
Custom base platform fee + credits, or BYOM + surcharge
On-prem / self-host / VPC, SAML SSO, compliance controls for regulated environments
Model routing (BYOM), Forward Deployed Engineering, 24/7 support + shared Slack
Annual billing is 20% off across all plans.
Upsolve AI’s pricing structure is designed to support customer-facing analytics at scale without introducing per-viewer costs as usage grows.
Pros and Cons (User Reviews)
Pros:
Optimized for customer-facing analytics: Upsolve AI is designed around external, end-user dashboards rather than internal BI reporting.
Fast time to value: Pre-built templates and simple embedding help teams ship customer-facing analytics quickly.
Low engineering overhead: Dashboards can be configured without heavy ongoing involvement from engineering teams.
Cons:
Limited deep customization: The platform prioritizes speed and usability over highly bespoke or experimental visualizations.
External analytics focus: Upsolve AI is best suited for customer-facing use cases and is not intended to replace internal BI tools.
Upsolve AI helps make analytics more accessible to end users by reducing technical setup and surfacing insights directly inside the product experience.
Additionally, while it is ideal for external analytics, some users find its focus limits a user's option with regard to internal data analysis.
Summary
Upsolve AI is a customer-facing analytics platform built for SaaS teams that want to embed dashboards into their products with minimal engineering effort. It emphasizes fast deployment, embedded delivery, and free-tier-plus-credit pricing that scales with usage instead of per-viewer seats.
For teams focused primarily on delivering analytics to customers rather than internal analysts, Upsolve AI offers a practical and focused solution.
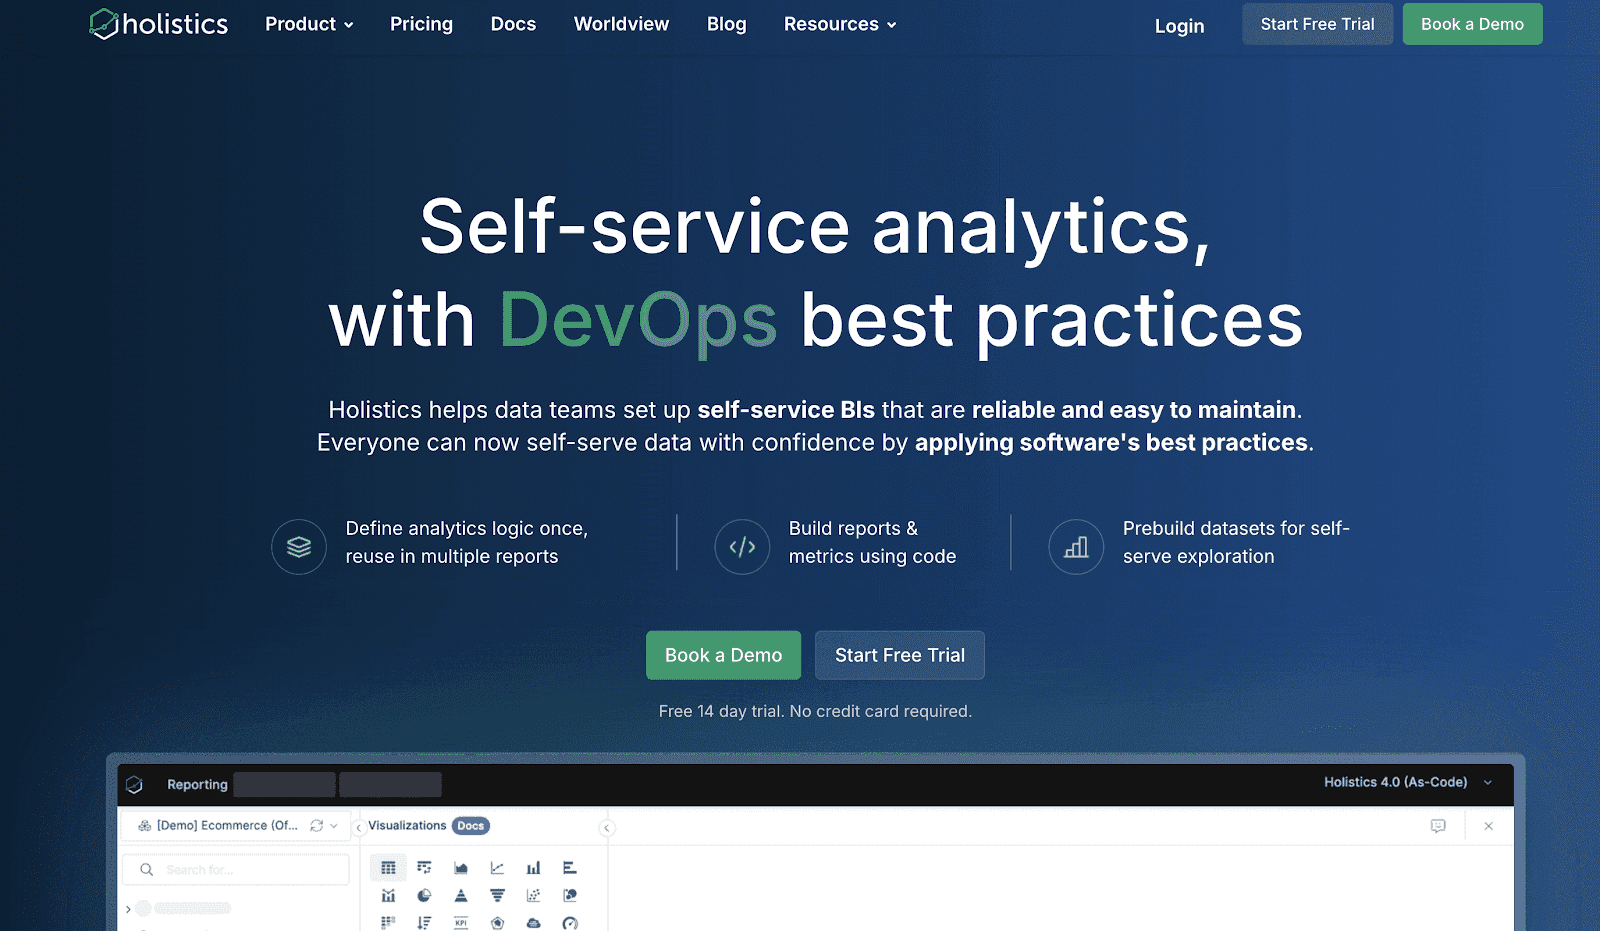
Holistics BI
Holistics BI offers a developer-friendly embedded analytics platform designed for SaaS teams that need flexible, customizable customer-facing analytics with strong governance.
It is well suited for teams that want governed metrics, dev-friendly deployment workflows, and lightweight embedded dashboards that integrate cleanly into their product experience.
Key Features
A governed semantic layer: Allows metrics to be defined, extended, and reused across the organization, helping ensure consistent and accurate reporting across teams and customers.
Embed Portal: Enables teams to embed a mini BI environment inside their app, providing an organized catalog of dashboards and datasets that users can explore, customize, and build directly within the product UX.
Fine-grained access control: Supports row-level security (RLS), multi-tenant data isolation, and dynamic parameter injection for secure, per-customer data access.
Dev-friendly, Git-native workflow: Dashboards, datasets, and rules are managed in code and governed through Git, allowing teams to test changes in sandbox environments and deploy updates safely.
Holistics Pricing
Holistics’ embedded analytics pricing starts at $800 per month, with final costs depending on usage and deployment requirements. Exact pricing is provided through sales.
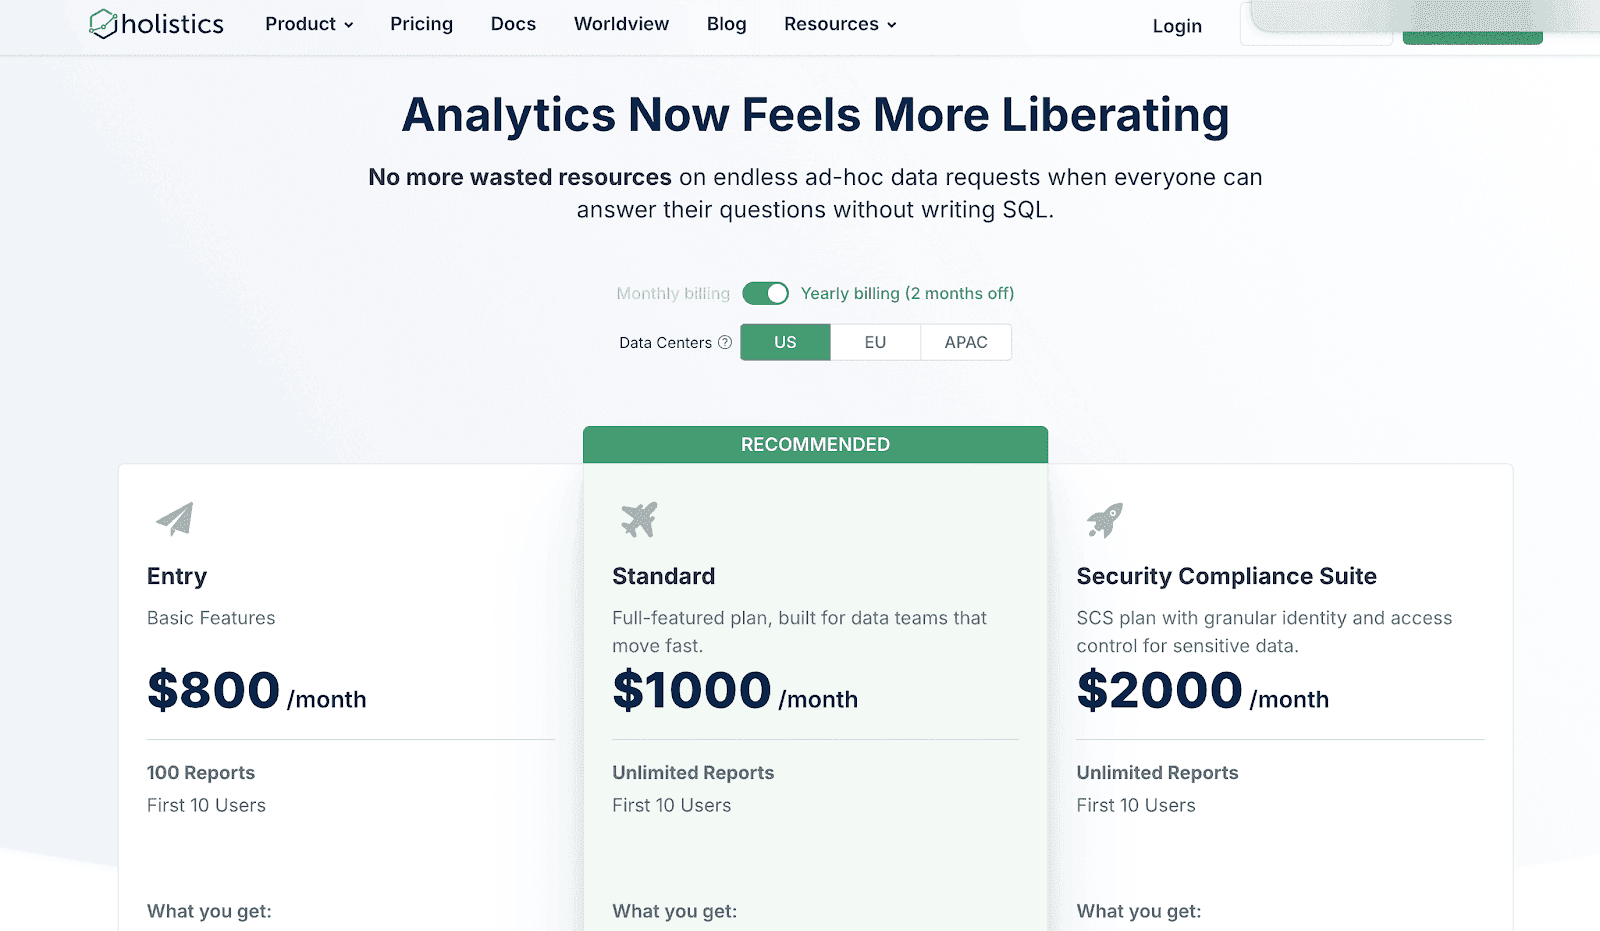
Holistics uses a usage-based pricing model designed to scale with analytics consumption rather than the number of viewers.
Instead of charging per seat, pricing is typically based on factors such as query usage and compute resources, making it suitable for products with many embedded or occasional users.
Pros and Cons (User Reviews)
Pros
Robust customization: Supports custom visualizations, themes, styling, and CSS, allowing embedded dashboards to better match the host application.
Strong self-service experience: End users can filter, drill, explore, and build dashboards in personal or shared workspaces using either AI-assisted exploration or a drag-and-drop interface.
High reusability: Engineers can parameterize dashboards, filters, and widgets across tenants and product modules, reducing repetitive work.
Pricing fit for embedded use cases: Usage-based pricing avoids per-viewer licensing, helping control costs as external usage grows.
Cons
Primarily iframe-based embedding: Holistics focuses on secure iframe embedding (public and signed) rather than a fully headless/component SDK. If you need ultra-granular control over every UI element or want to compose charts directly into your front-end components, you may find this more constrained than some JS-SDK–first competitors.
As-code approach requires some technical maturity: Data modeling, permissions, and embed configuration are all code-driven and Git-oriented. This is great for software engineering teams, but it may feel heavier for less technical teams.
Cloud-only deployment: Holistics is a fully cloud-hosted platform with no on-premise edition, which can be a blocker for organizations with strict data residency or on-prem-only policies.
Summary
Holistics is a modern, cloud-based business intelligence platform that helps teams turn raw data into trusted, reusable metrics, reports, and dashboards.
Built around an analytics-as-code approach, it lets data teams define business logic in a central semantic layer, so everyone works from the same single source of truth.
Holistics supports both internal analytics and embedded use cases, with strong self-service exploration, Git-based workflows, and flexible customization so your dashboards can feel native to your app.
While its code-driven modeling and Git integration can introduce a short learning curve for teams used to purely drag-and-drop tools, Holistics’ combination of maintainability, governance, and scalable self-service makes it a compelling choice for organizations that want engineering-grade embedded BI without heavy infrastructure.
Tableau
Tableau is a leading embedded BI tool that helps you turn complex data into simple, interactive visuals. It’s well-known for its ease of use and powerful data visualization capabilities.
Key Features
Drag-and-Drop Interface: You can easily build interactive dashboards and reports with a few clicks; no coding needed.
Real-Time Data Updates: Tableau integrates with various data sources to provide up-to-date insights, so you always have the latest information.
Advanced Visual Analytics: It offers in-depth visual analytics, helping you quickly discover trends and patterns in your data.
Collaboration Tools: Tableau makes sharing reports and dashboards with your team or clients easy, enhancing collaboration.
Cloud and On-Premise Options: Whether you prefer the cloud or on-premise solutions, Tableau offers flexible deployment.
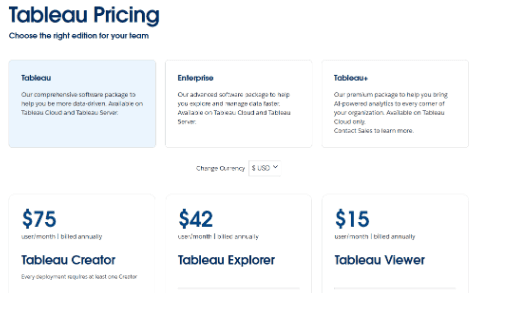
Tableau Pricing
Tableau offers several pricing options based on your team’s data needs. Their plans are majorly classed into:
Tableau
Enterprise
Tableau+
Here’s a breakdown with an example to give you a clearer picture:
Tableau Plan
Creator Plan ($75/user/month):
Includes Tableau Desktop, Tableau Prep Builder, and essential analytics tools.
Ideal for those building and publishing dashboards.
Annual cost per user: $900.
Example: If your team has 3 Creators, the total cost per year would be:
$75/user/month x 3 users x 12 months = $2,700.
Explorer Plan ($42/user/month):
Designed for users needing to explore and analyze data without creating dashboards.
Annual cost per user: $504.
Example: For a team of 5 Explorers, your total yearly cost would be:
$42/user/month x 5 users x 12 months = $2,520.
Viewer Plan ($15/user/month):
Ideal for users who only need to view existing dashboards and reports.
Annual cost per user: $180.
With 20 viewers, the annual cost adds up to:
$15/user/month x 20 users x 12 months = $3,600.
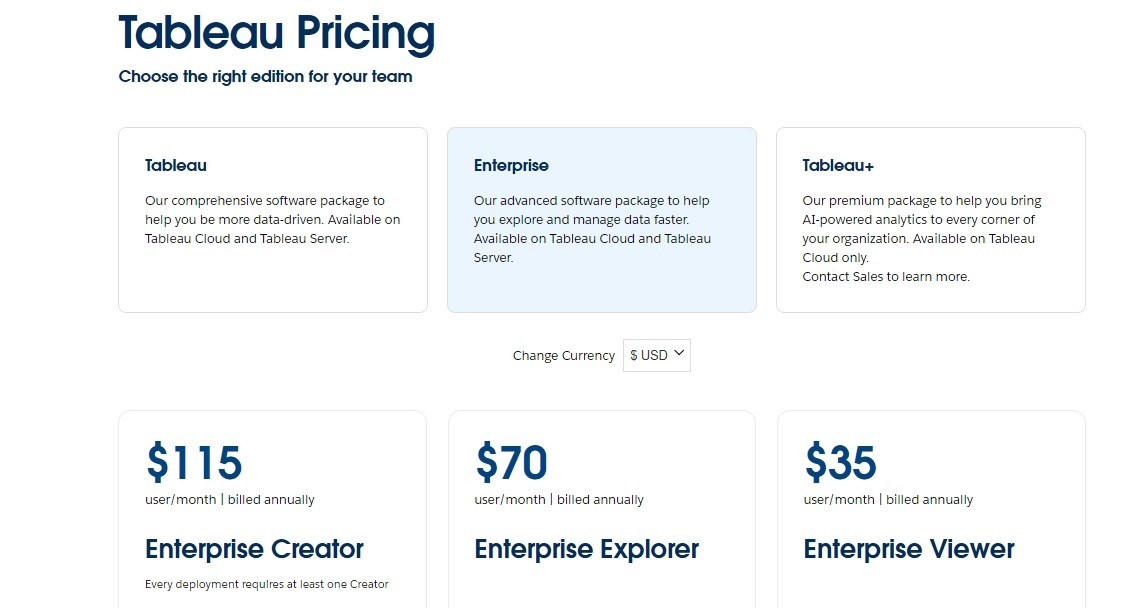
Enterprise Plan
Enterprise Creator ($115/user/month):
Provides all features from the Creator plan plus advanced data management.
Annual cost per user: $1,380.
Example: For a team of 3, you’re looking at:
$115/user/month x 3 users x 12 months = $4,140.
Enterprise Explorer ($70/user/month):
Expands on the Explorer plan with enhanced management tools.
Annual cost per user: $840.
Example: If you have 5 Enterprise Explorers, the yearly cost would be:
$70/user/month x 5 users x 12 months = $4,200.
Enterprise Viewer ($35/user/month):
Similar to Viewer but with added enterprise-level features.
Annual cost per user: $420.
Example: For a team of 20 Viewers, your annual cost would total:
$35/user/month x 20 users x 12 months = $8,400.
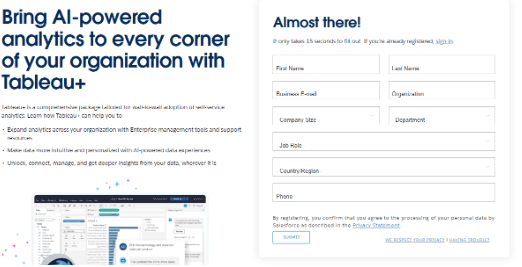
Tableau+ Plan
Tableau+ provides all standard Tableau features and adds cutting-edge AI insights, customizable data alerts, AI-powered analytics, and exclusive Tableau Pulse capabilities.
With Tableau+, teams can access predictive analytics and deeper data insights tailored to specific business needs, enhancing decision-making across departments.
Ideal for: Large enterprises seeking maximum analytics depth, customized reporting, and powerful, organization-wide data management.
Contact sales for pricing.
Total Annual Cost Of Using Tableau
Let’s say a team with 3 Creators, 5 Explorers, and 20 Viewers are using the Enterprise plans.
Then you have:
Creators: 3 x $1,380/year = $4,140
Explorers: 5 x $840/year = $4,200
Viewers: 20 x $420/year = $8,400
Overall Total Annual Cost:
$4,140 + $4,200 + $8,400 = $16,740
This setup gives you full access to advanced analytics tools, strong data management, and top-tier enterprise features.
It’s a complete but premium option for growing your team’s data skills and reach.
Pros and Cons (User Reviews)
Based on user reviews on G2, here are the pros and cons of Tableau.
Pros
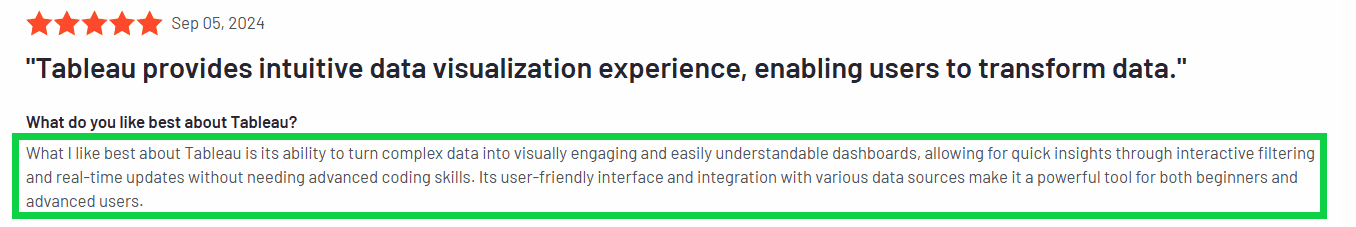
1. Drag-and-Drop Interface: Tableau’s drag-and-drop setup is praised for its simplicity. This feature saves time and works well for users who aren’t technical experts, making it ideal for both beginners and seasoned analysts.
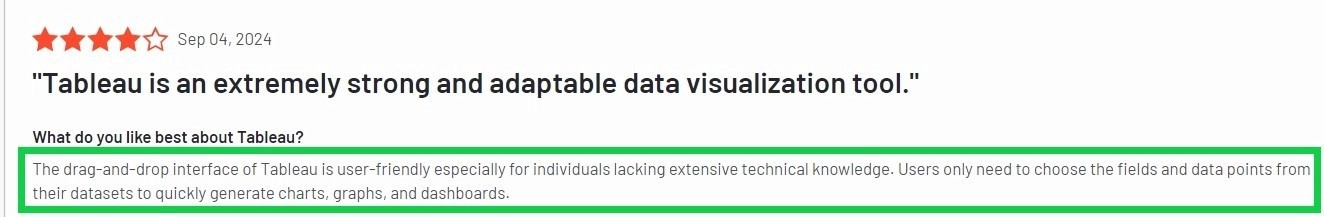
2. Data Integration Flexibility: Tableau connects seamlessly to various data sources, from Excel files to large enterprise databases. Users find this feature essential, as it lets them combine data and uncover insights all in one place.
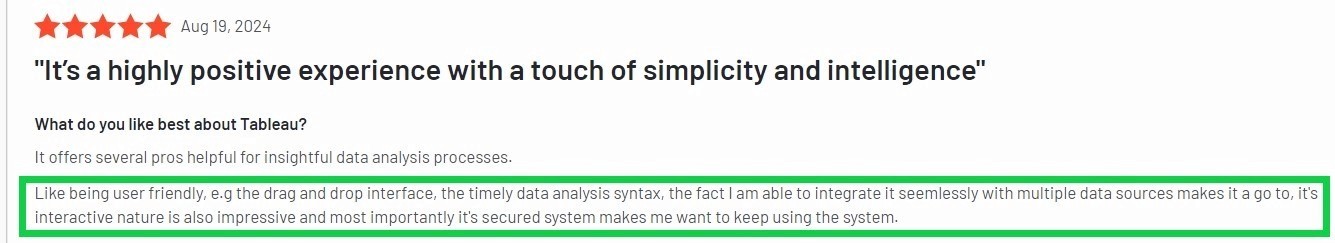
3. Interactive Dashboards: Tableau's interactive dashboards allow you to explore data more deeply. This real-time customization is a favorite because it helps users present data stories clearly and effectively engage stakeholders.
Cons
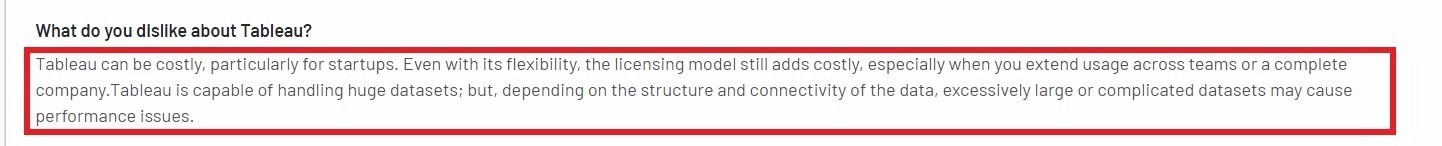
1. High Cost: Tableau’s pricing can be a barrier, especially for small businesses or startups. With packages starting at $70 per user per month for certain plans, costs can add up quickly when scaling across larger teams.
2.Steep Learning Curve for Advanced Features: Users often mention needing extra training or support to fully utilize Tableau's complex analytics capabilities.

3. Performance Issues with Large Datasets: Tableau can occasionally slow down or lag when handling extremely large or complex datasets, which impacts efficiency.

So generally, users appreciate Tableau's simple drag-and-drop interface, which makes creating complex visuals easy, even for beginners.
This feature cuts down on setup time and requires no coding.
Another highlight is Tableau’s real-time data integration which helps users always have the latest insights without needing to refresh data manually.
Finally, Tableau’s interactive dashboards allow users to explore data in-depth, perfect for teams who need clear, engaging ways to present findings.
Platform | Tableau Rating |
G2 | 4.4 / 5 |
Product Hunt | 4.4 / 5 |
Capterra | 4.5 / 5 |
GetApp | 4.6 / 5 |
TechImply | Not Available |
Summary
Tableau is a top embedded BI tool known for its powerful data visualization capabilities, making it easier to transform complex data into interactive visuals.
It’s ideal for organizations aiming to enhance their data-driven insights. It offers real-time data updates, an intuitive drag-and-drop interface, and flexible deployment options across cloud and on-premises.
Though it may be expensive, Tableau’s range of analytics options and enterprise-level management make it a valuable choice for businesses focused on scaling their analytics capabilities.
Looker
If you’re struggling to get clear, real-time insights from your business data, Looker might be the solution you’re looking for.
As a Google-backed tool, Looker offers AI-powered analytics and a flexible data modeling layer, letting you dig deep into your data without leaving your workflow.
Let’s take a closer look at what makes Looker stand out.
Key Features
AI-Driven Insights: Looker leverages Google’s AI technology, making it easier to uncover patterns and trends in your data.
It helps you move beyond basic reporting by highlighting insights that could otherwise go unnoticed.
Customizable Data Experiences: Looker's API-first approach allows you to build custom dashboards and embed data visualizations directly into your applications.
This way, you can create an intuitive, data-driven user experience.
Universal Semantic Layer: Looker’s semantic model is a single source of truth, ensuring that all your data queries return consistent results.
This is especially helpful for businesses managing large datasets across departments.
Looker Pricing
Looker offers three main pricing editions to fit different needs:
Standard Edition
Enterprise Edition
Embed Edition
What do they offer?
Standard Edition
Designed for smaller teams with fewer than 50 users.
Includes:
One main setup (production instance).
10 Standard Users.
2 Developer Users.
1,000 query-based API calls per month.
1,000 admin API calls per month.
Pricing: Contact Looker’s sales team for custom pricing.
Enterprise Edition
Built for larger teams needing enhanced security features.
Includes:
One main setup (production instance).
10 Standard Users.
2 Developer Users.
100,000 query-based API calls per month.
10,000 admin API calls per month.
Pricing: Custom quote available through Looker’s sales team.
Embed Edition
Ideal for embedding analytics in customer-facing applications.
Includes:
One main setup (production instance).
10 Standard Users.
2 Developer Users.
500,000 query-based API calls per month.
100,000 admin API calls per month.
Pricing: Requires a custom quote from Looker’s sales team.
Overall, Looker’s pricing is structured to meet a wide range of business needs, from simple analytics to extensive, embedded BI solutions.
Choosing the right plan depends on your team size, security requirements, and the scale of insights you want to deliver.
Pros and Cons (User Reviews)
Based on the reviews, here are the pros and cons of Looker.
Pros
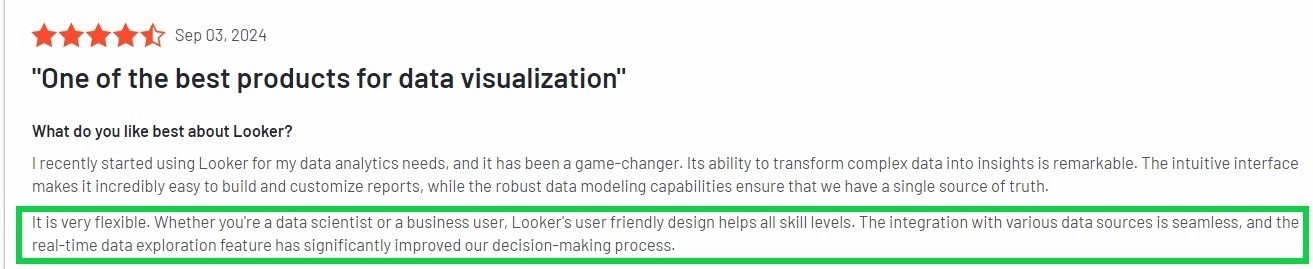
1. Seamless Data Integration: Looker connects with tools like Google Analytics and BigQuery, letting you view all data in one place for easy analysis.
2. Drag-and-Drop Interface: The drag-and-drop setup allows anyone, even beginners, to quickly build dashboards without coding.

3. Real-Time Data Insights: Looker's real-time updates instantly lets one see fresh data, helping you make fast, informed decisions.
Cons
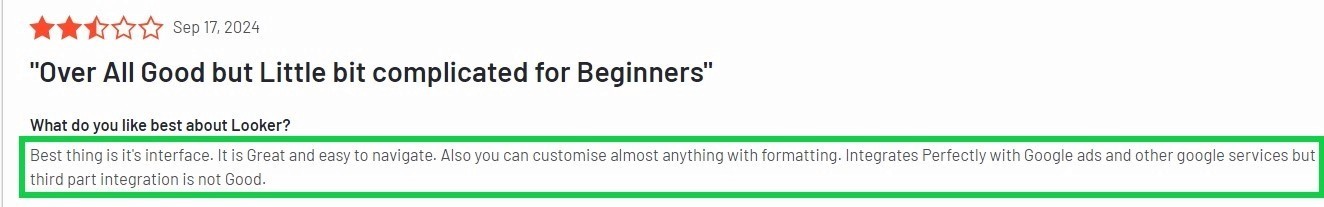
1. Limited Customization Options: While Looker’s interface is straightforward, advanced users might find the customization options a bit restricted, especially for creating complex visuals.

2. Steep Learning Curve: Looker can be challenging to master for those new to business intelligence tools, particularly when building more detailed dashboards.
On the whole, users appreciate Looker for its easy data integration with sources like Google Analytics and BigQuery.
Its drag-and-drop interface is also a big plus, allowing non-technical users to quickly create engaging, clear dashboards.
However, some find customization for advanced visuals a bit limited and could benefit from more flexibility.
Platform | Looker Rating |
G2 | 4.4 / 5 |
Product Hunt | 5.0 / 5 |
Capterra | 4.6 / 5 |
GetApp | 4.6 / 5 |
TechImply | Not Available |
Summary
Looker offers a smart BI solution for businesses needing quick, detailed insights. Built with Google’s AI, it’s especially useful for teams who want to analyze data without complex setups.
While Looker is user-friendly for beginners, advanced users may find its options for customizing visuals a bit limited.
Overall, it’s a solid tool for teams that need real-time insights with easy access to Google-backed data integration.
5. Microsoft Power BI
Ever tried to quickly gather insights from scattered data? It’s tough, especially when your team’s data is spread across multiple sources.
Microsoft Power BI tackles this head-on by connecting data from various platforms, transforming it into interactive visuals that are easy to understand and act on.
Key Features
Real-Time Data Tracking: Connects to live data sources, giving you up-to-the-minute insights on sales and customer behavior metrics.
AI-Powered Analytics: Detects patterns and trends automatically, helping you uncover shifts and opportunities without manual analysis.
Customizable Dashboards: This feature lets you design dashboards around specific metrics so you can keep track of what's most relevant to your goals.
Seamless Microsoft Integration: Works with Microsoft apps like Excel and Teams, keeping data accessible across the tools you already use.
Strong Security and Governance: Built-in security features ensure data is protected and compliant when managing sensitive business information.
Microsoft Power BI Pricing
Microsoft Power BI offers a range of pricing options to meet different business intelligence needs.
These plans are:
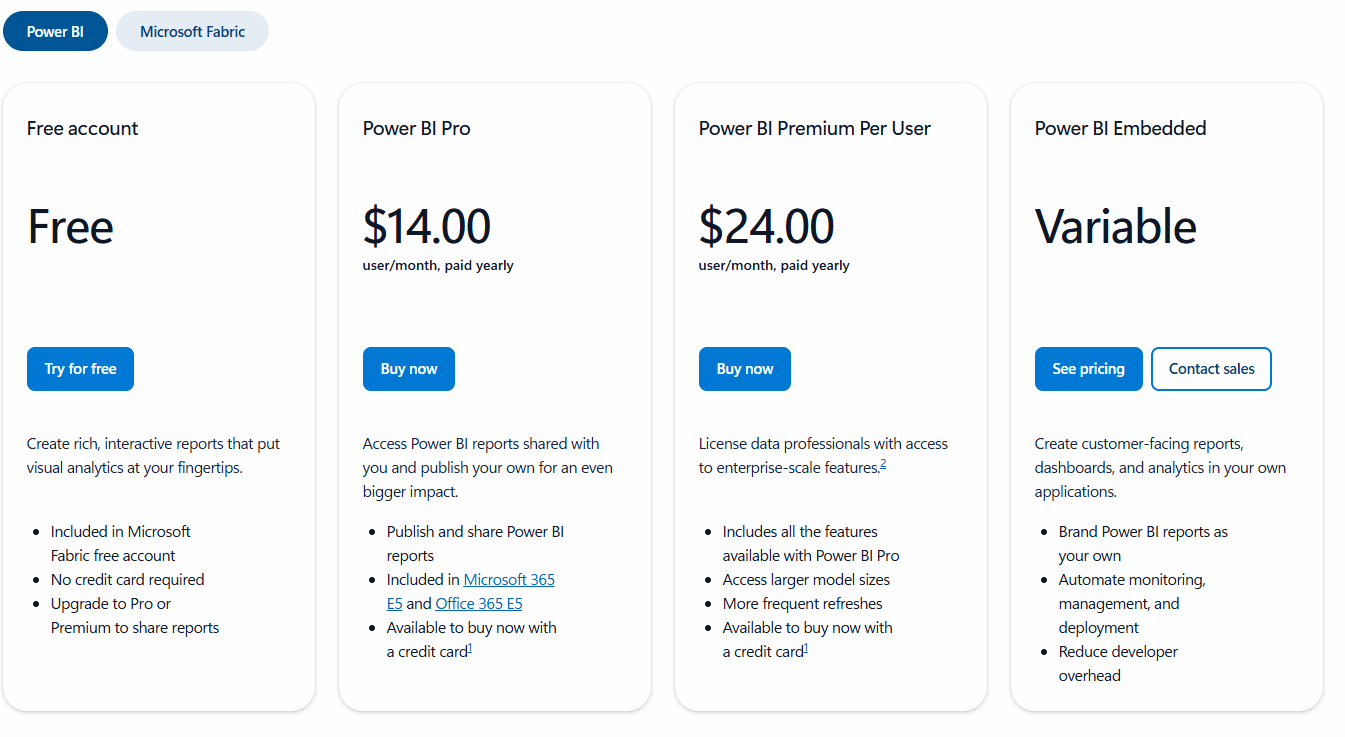
Power BI Free
Power Bi Pro
Power BI Premium Per User
Power BI Embedded
Here’s a clear breakdown of Microsoft Power BI’s pricing plans:
Power BI Free
Free
Ideal for beginners who want to create interactive reports at no cost.
Note: Sharing reports requires an upgrade to a paid plan.
Power BI Pro
$14/user/month
Allows publishing and sharing reports for better team collaboration.
Already included in Microsoft 365 E5 and Office 365 E5.
Can also be purchased separately for flexible access.
Power BI Premium Per User
$24/user/month
Ideal for professionals needing enterprise-level features.
Includes larger model sizes and more frequent data refreshes.
Includes all Power BI Pro features with added capacity, perfect for high-demand projects.
Power BI Embedded
Variable Pricing (Contact Sales)
Tailored for developers who need to embed reports in customer-facing applications.
Custom pricing based on usage; contact sales for a personalized quote.
Each plan offers specific benefits tailored to different needs, from simple reporting in the free version to high-capacity, enterprise-ready features in Premium.
Pros and Cons (User Reviews)
Here are the reviews Microsoft Power BI has received.
Pros
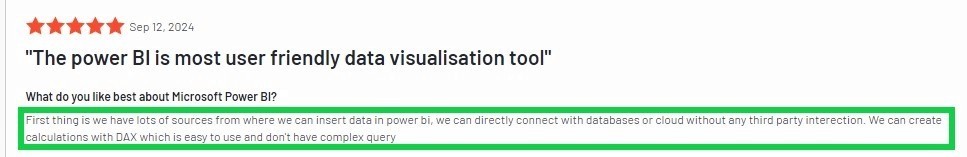
1. Microsoft Integration: Power BI connects easily with Excel, Azure, and Dynamics 365, making it ideal if you already use Microsoft tools.
2. Easy Drag-and-Drop: The simple drag-and-drop setup lets you build reports without advanced skills.
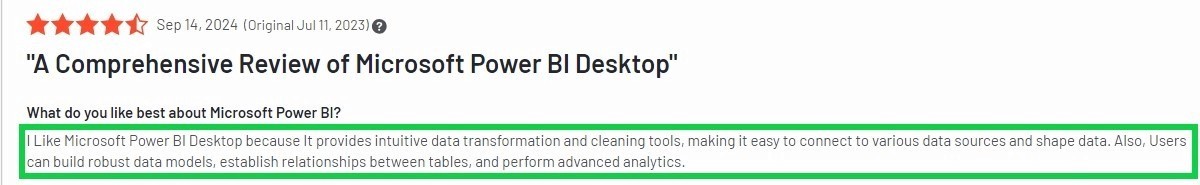
3. Advanced Data Modeling: With DAX, Power BI enables detailed calculations and custom reports.
Cons
1. Performance with Large Datasets: Power BI can slow down significantly with large or complex datasets.
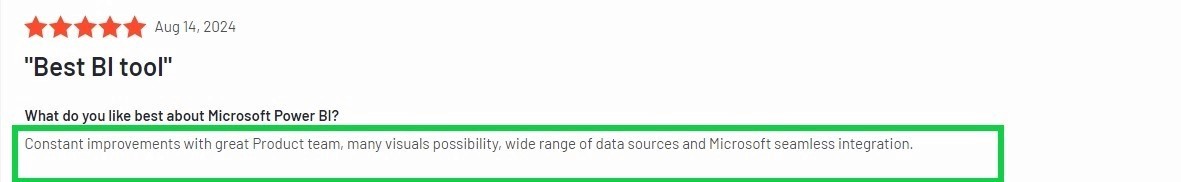
Users love its integration with Microsoft tools like Excel and Azure because it makes it simple for users to pull in data and create unified reports.
This is especially beneficial for teams in the Microsoft ecosystem.
Some users, however, feel there could be improvements about handling large datasets.
Platform | Microsoft Power BI Rating |
G2 | 4.5 / 5 |
Product Hunt | Not Available |
CapTerra | 4.6 / 5 |
GetApp | 4.6 / 5 |
TechImply | Not Available |
Summary
Microsoft Power BI is a powerful analytics tool that helps businesses turn data into actionable insights.
With its seamless integration into the Microsoft ecosystem, it’s designed to fit smoothly into existing workflows, enhancing collaboration and data accessibility.
Though the advanced features may take some time to master, Power BI’s robust capabilities make it a valuable asset for teams aiming to make data-driven decisions efficiently.
6. Qlik Sense
If you handle data from different departments and need a way to make sense of it all, Qlik Sense could be the solution.
It’s designed to pull data together from many sources, showing clear patterns and insights that are easy to use.
Key Features
Associative Engine: Unlike traditional BI tools, Qlik Sense lets you see unexpected connections in your data, helping you uncover insights that might otherwise go unnoticed.
No-Code, Self-Service Analytics: With Qlik Sense’s drag-and-drop dashboard, anyone on your team can create reports.
AI-Powered Suggestions: Qlik Sense uses AI to find trends, make predictions, and point out risks, making it especially useful for important business decisions.
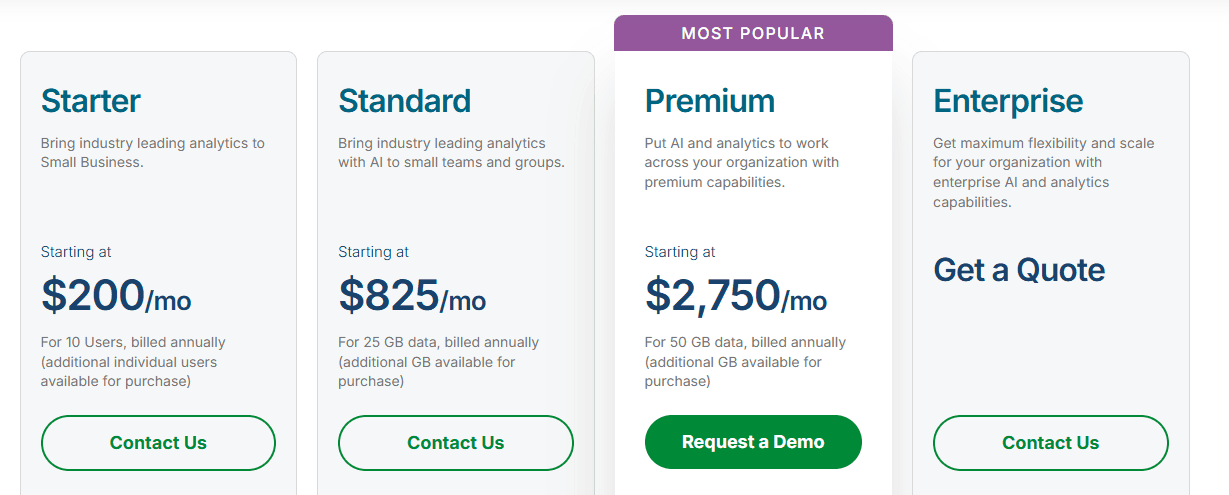
Qlik Sense Pricing
Qlik Sense offers a range of plans designed to support teams and businesses at different stages, from small deployments to large enterprise environments.
Starter Plan
Standard Plan
Premium Plan
Enterprise Plan
Here’s a breakdown of each option:
Starter Plan
Starting at $200/month (billed annually)
For 10 users (additional individual users available for purchase)
Includes:
10 users and 25 GB of fixed data for analysis (no additional data capacity available)
AI-powered analytics
Connect and combine hundreds of data sources using standard connectors
Interactive dashboards and visualizations
Team collaboration and sharing
5 GB max app size
Qlik Community Support
Standard Plan
Starting at $825/month (billed annually)
For 25 GB of data (additional GB available for purchase)
Includes:
AI-powered analytics
Automated report generation and delivery
No-code automation builder to trigger actions across systems
Connect and combine hundreds of data sources
Interactive dashboards and visualizations
Managed and shared spaces for governance and collaboration
24/7 critical customer support for added peace of mind
Premium Plan
Starting at $2,750/month (billed annually)
For 50 GB of data (additional GB available for purchase)
Includes everything in Standard, plus:
Predictive analytics powered by automated machine learning
Additional GenAI capacity
Anonymous (public) access
Expanded enterprise connectivity (cloud, SAP, mainframe, legacy systems)
Data lineage connectors
Guided customer success onboarding
Enterprise Plan
Custom Pricing
Starts at 250 GB of data for analysis
Includes everything in Premium, plus:
Scale for large customer deployments
Greater included limits for reporting, automations, public access, AI Assistant, ML models, and dataset size
15 GB apps as standard
Larger app support (up to 40 GB standard, up to 50 GB per app with additional purchase)
3 GB of personal space per user
Multi-region tenants
Personalized customer success plan and onboarding
Each plan provides flexible pricing based on a fixed capacity, allowing teams to predict costs upfront.
Pros and Cons (User Reviews)
Pros
1. Robust Data Integration: Offers seamless connections across databases, spreadsheets, and applications.

2. Flexible Associative Engine: Lets you freely explore data, uncovering hidden relationships across multiple fields.
3. User-Friendly, Self-Service Analytics: This tool empowers you to create and customize dashboards independently, making analytics accessible even without IT support.

Cons
1. Pricing: Relatively expensive when compared to other business intelligence tools.
2. Limited Customization Options: The platform's layout and design flexibility may feel restricted for advanced users
Qlik Sense offers data teams and analysts a straightforward tool for integrating multiple data sources and creating quick insights.
Users appreciate its ease of use and intuitive dashboards.
However, some reports lag due to large datasets and limited customization options, which can impact the flexibility of advanced users.
Platform | Qlik Sense Rating |
G2 | 4.4 / 5 |
Product Hunt | Not Available |
CapTerra | 4.5 / 5 |
GetApp | 4.5 / 5 |
TechImply | Not Available |
Summary
Qlik Sense is a versatile embedded BI tool that helps teams unify data from various sources to effortlessly discover insights.
Features like the Associative Engine, self-service analytics, and AI-powered suggestions allow users to create detailed reports without relying heavily on IT.
However, it can be pricey, and some users find customization options limited, especially for complex dashboards.
It is ideal for businesses needing robust data integration and user-friendly analytics at scale.
Conclusion: Which Embedded BI Tool Should You Choose?
Choosing the right embedded BI tool depends on how you plan to use analytics, who your users are, and how much control you need over data modeling and delivery.
Tableau is well suited for teams that prioritize high-quality visualizations and interactive dashboards, though its pricing can become a consideration at scale.
Looker stands out for teams already working within Google Cloud that want a strong semantic layer and API-driven analytics, but it may require more technical setup.
Microsoft Power BI is a natural choice for organizations in the Microsoft ecosystem, offering strong value and flexibility, with some performance trade-offs on very large datasets.
Qlik Sense excels in multi-source analytics and associative exploration, making it a solid option for complex data environments, albeit with higher costs at advanced tiers.
Upsolve AI takes a different approach from the rest of this list: rather than embedding a fixed dashboard, it embeds an analytics agent that answers customer questions in plain language, which suits SaaS teams that want customer-facing analytics without building every view by hand.
Rather than looking for a single "best" option, the right choice comes down to your product architecture, audience, and growth plans. If you are weighing the agent-driven approach against traditional embedded BI, our guide to evaluating AI agent builder platforms walks through the criteria that matter. Aligning the tool with how analytics will actually be used is what ultimately determines long-term success.

Try Upsolve for Embedded Dashboards & AI Insights
Embed dashboards and AI insights directly into your product, with no heavy engineering required.
Fast setup
Built for SaaS products
30‑day free trial


