
Honest breakdown of Looker Embedded Analytics, covering features, embedding options, pricing, performance limits, and when the complexity pays off.

Ka Ling Wu
Co-Founder & CEO, Upsolve AI
10 min

Embedded analytics is no longer optional. Users expect to explore real-time data directly inside the products they use, without switching tools or relying on static reports.
Looker is one of the most established platforms for embedded analytics. Built on Google Cloud, it’s known for strong data governance, API-first embedding, and semantic modeling through LookML. For organizations with complex data and experienced BI teams, Looker can power highly controlled analytics experiences.
However, Looker also comes with trade-offs. It requires technical setup, ongoing modeling, and a higher cost structure that may not suit every team, especially for customer-facing or product-led use cases.
This article breaks down how Looker Embedded Analytics works, where it performs well, where it adds friction, and when it makes sense to consider alternatives so you can decide if it’s the right fit for your product and users.
What Is Looker Embedded Analytics?
Looker Embedded Analytics is a business intelligence (BI) tool that allows companies to embed interactive dashboards, charts, and reports directly into their own software, websites, or internal systems.
This means your users can see important data without needing to open a separate analytics platform or log into another system.
It’s not a standalone product, but a feature within the broader Looker platform, which is part of Google Cloud.
How It Works
At the heart of Looker is a language called LookML.
It is used to define your data structure; things like metrics, dimensions, relationships, and business logic.
This helps to ensure consistent, accurate reporting across your entire organization or product.
Once your data is modeled in LookML, you can build dashboards and reports that can be:
Embedded directly into your app using iframes or custom code
Personalized for each user, with built-in row-level data security
Or Accessed through signed URLs, so users don’t need a separate Looker login
This setup allows you to create secure, interactive analytics experiences that feel like a natural part of your product.
How to Embed Looker in Your App
Looker offers several options to embed dashboards into your product or internal tool:
Private Embedding – This only works for users who log in through Looker. Best for internal teams.
Signed Embedding – It lets users access dashboards through your app’s login system. More secure and seamless for customer-facing analytics.
Public Embedding – For public embedding, anyone with the link can view the dashboard. Fast to set up, but not secure.
White-Labeling – White labeling allows you to customize the embedded dashboard to match your product’s look and feel. You can remove Looker’s branding, apply your own design, and create a fully branded experience.
Looker vs Looker Studio
Quick note: Looker and Looker Studio are not the same thing.
Looker is the full BI platform used for advanced modeling and embedding.
Looker Studio (formerly Data Studio) is a lighter, free tool for creating basic reports.
Key Features of Looker
Here are the key features of Looker’s embedded analytics that matter most this year:
API-First and Composable BI
Looker is built to be API-first.
That means you can do almost everything—dashboard creation, user access, theming—through APIs and SDKs.
This makes it ideal for teams who want to build fully custom, deeply integrated data experiences inside their apps.
AI-Powered Analytics with Gemini
Looker is backed by Gemini, Google’s AI assistant. It helps you:
Build visualizations faster
Create and edit formulas
Auto-generate reports
Interact with data using natural language
This AI layer is designed to speed up workflows for both technical and non-technical users.
Semantic Modeling with LookML
LookML is Looker’s modeling language.
It lets you define your business logic—metrics, relationships, dimensions—in one place.
This ensures consistent data definitions across all dashboards and embedded views.
White-Labeling and Theming
You can fully customize the embedded experience:
Match your brand’s colors and fonts
Remove Looker’s logos
Add your own navigation and UI elements
This helps you create a seamless experience where users don’t even know Looker is running under the hood.
Security and Row-Level Permissions
Looker supports strong security features like:
Row-level data access
Google Cloud IAM integration
Private Service Connect and VPC-SC
Data Integrations
Looker connects to:
Google BigQuery
Snowflake
Amazon Redshift
PostgreSQL, MySQL, and over 50 other SQL dialects
This flexibility is ideal for teams working in multi-cloud or hybrid environments.
In short: Looker gives you a lot of power, but you’ll need the right team to use it well.
Looker: Pros and Cons
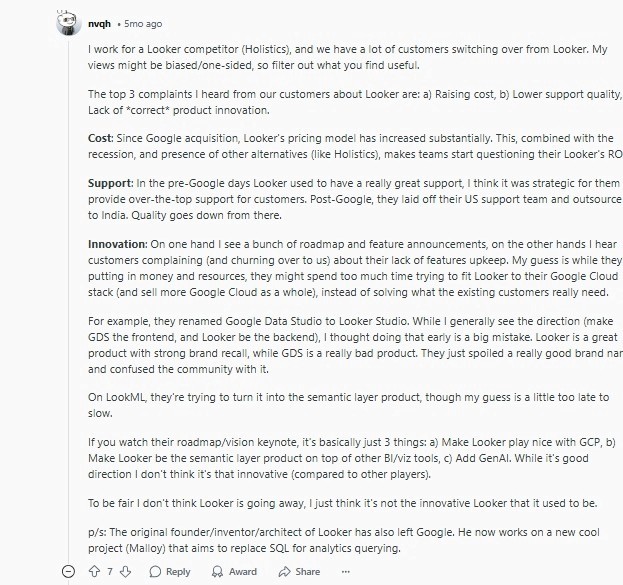
Let’s now look at some of the things users have to say about Looker embedded analytics as found on G2 and Reddit.
Pros | Cons |
Enables consistent metrics via LookML modeling | Steep learning curve for new users |
Easy reporting for non-technical users (after setup) | Custom dashboards often need technical help |
Strong integrations with major data warehouses | Can be slow with large or complex queries |
Web-based, scalable, and supports real-time collaboration | Limited built-in visualizations |
Flexible for developers with fine-grained control through LookML | Expensive for startups and large teams |
Declining support quality post-Google acquisition | |
Complex or limited advanced analysis features (e.g., blending, funnels) |
Pros
Looker allows teams to build a single source of truth by defining consistent metrics and business logic through its LookML modeling layer.
Once implemented correctly, Looker is user-friendly and enables non-technical users to explore and run reports without writing SQL.
Looker supports seamless integrations with major cloud data warehouses like BigQuery, Snowflake, Redshift, and more than 50 SQL dialects.
It scales well across teams, with role-based access controls and a fully web-based experience that supports real-time collaboration.
Developers and analysts appreciate Looker’s flexibility, as LookML gives them fine-grained control over data models, transformations, and permissions.

Cons
Looker has a steep learning curve, especially for teams unfamiliar with LookML or semantic modeling concepts.
Non-technical users often struggle to create custom dashboards without help from data engineers or analysts.
Performance can be slow when handling large datasets or complex queries, especially if the backend warehouse isn't optimized.
Some users report limited out-of-the-box visualizations compared to tools like Tableau or Power BI.
Looker's pricing is considered expensive, particularly for startups or companies needing many user licenses.
Support quality has reportedly declined after Google’s acquisition, with slower response times and more reliance on external documentation.
Advanced data blending, funnel analysis, and journey mapping are either limited or overly complex to implement.
Looker Embedded Analytics Pricing
Looker doesn’t publish its pricing publicly, and that alone can be frustrating if you’re trying to budget early.
But here’s what I could find from real users and company disclosures:
Pricing is based on usage and number of users, not a flat monthly fee. This includes viewer seats, developer seats, and potential add-ons like API access or white-labeling.
From user reports, small teams (10–15 users) have been quoted between $5,000 to $10,000 per month, depending on features and support levels.
Enterprise plans for larger teams or customer-facing use cases can reach $75,000–$100,000+ per year or more—especially if embedding at scale.
Some teams have mentioned hidden costs, such as needing additional Google Cloud services or infrastructure to support performance at scale.
Looker Studio, Google’s other BI tool, is free but not the same product—it lacks the semantic layer and enterprise-grade embedding capabilities.
In summary, Looker is not the cheapest option.
However, for teams with complex data needs, strong engineering support, and a Google Cloud setup, it might still be worth it.
Is Looker Embedded Analytics Worth It?
✅ Good Fit If... | ❌ Not Ideal If... |
You’re a large enterprise with complex data and strict governance requirements | You want quick setup and don’t have a technical BI team |
Your team is technically strong and familiar with LookML and data modeling | You need a simple, flexible UX for non-technical users |
You’re already using Google Cloud and need tight integration | You want to customize visuals or embed with ease |
You need governed, centralized reporting at scale | You prefer tools with faster performance on large datasets |
You can invest time and resources into ongoing maintenance and modeling | You want low-maintenance dashboards that don’t break easily |
A Simpler Alternative for Embedded Analytics: Upsolve AI
If Looker feels too heavy for your current needs, you’re not alone. Many teams exploring embedded analytics run into the same challenges: long setup cycles, reliance on data engineers, and ongoing maintenance tied to LookML.
Upsolve AI approaches embedded analytics from a different angle. Instead of requiring a semantic modeling layer and custom development upfront, it focuses on helping product teams embed dashboards quickly with minimal technical overhead.
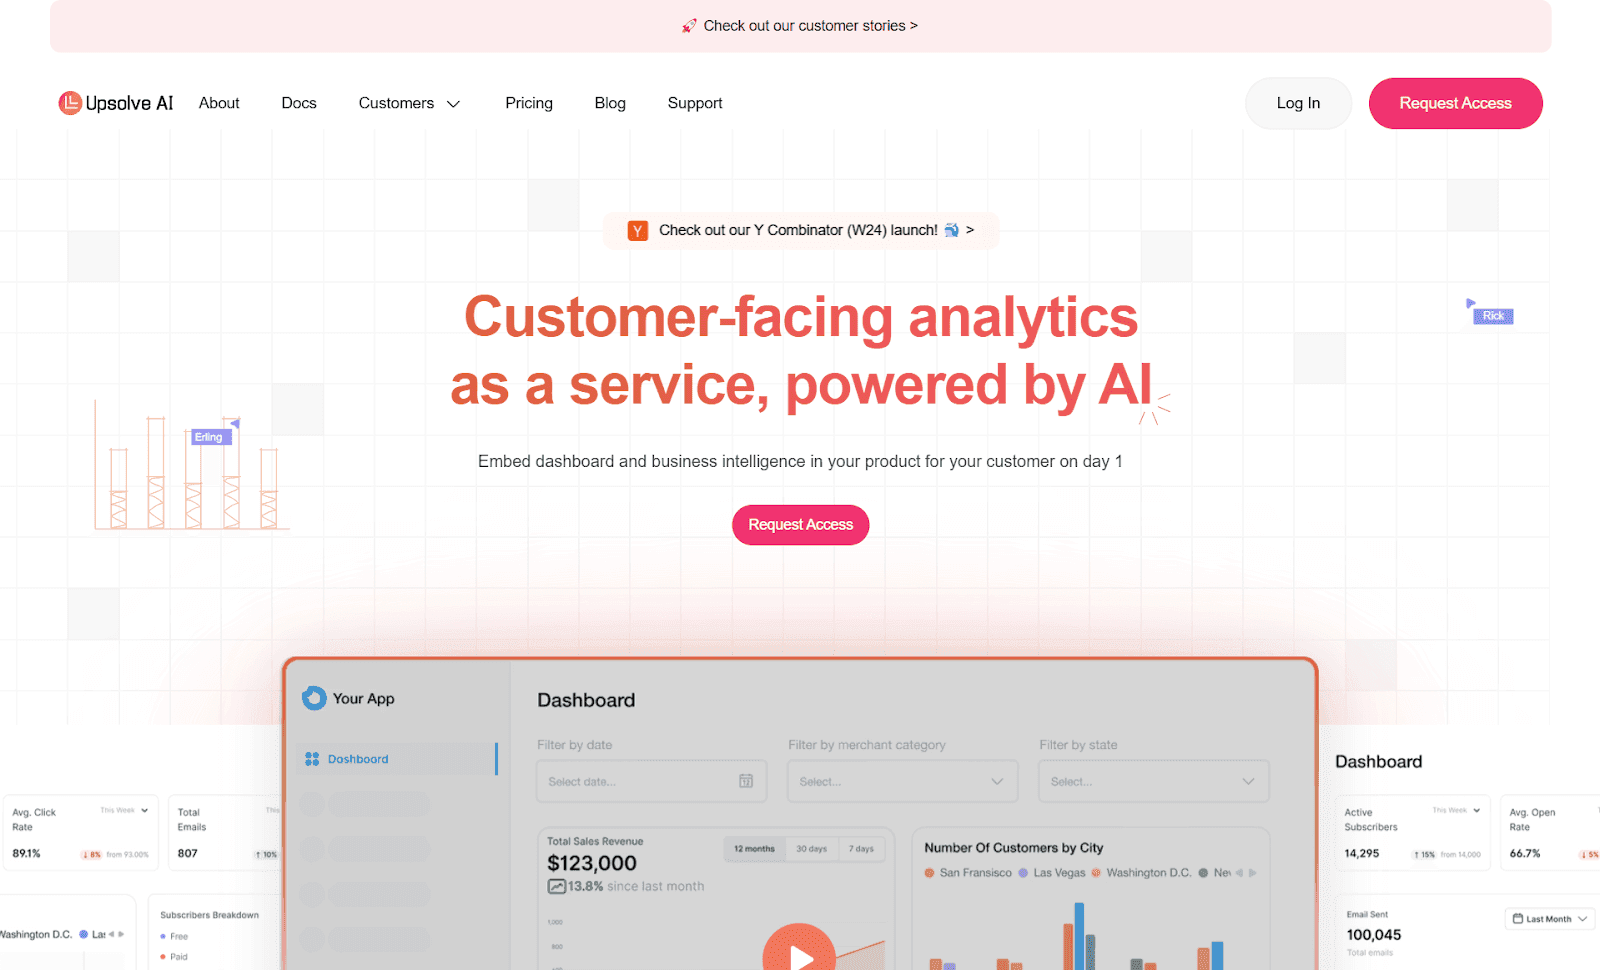
Upsolve is an AI-powered embedded analytics platform designed for customer-facing use cases, where speed to value and ease of iteration matter more than deep, centralized modeling.
Feature | Looker | Upsolve AI |
Ease Of Use | Complex setup; requires LookML and SQL | No-code builder; anyone can create dashboards |
Speed | Requires engineering + custom setup | One-click embed with React or iFrame |
Customization | Limited unless you master LookML | Fully customizable UI with drag-and-drop tools |
Real-Time Data | Slower on large datasets | Instant updates and AI-powered insights |
End-User Control | Changes need dev support | End users can self-serve, filter, and drill down |
Pricing | Starts at $40K+/year | Free tier; paid plans from $500/mo (Team $2,000/mo for embedding) — usage-based credits |
Best For | Enterprises with big data teams | Startups and growing businesses |
Unlike Looker, Upsolve is designed to reduce the operational overhead that often comes with embedded analytics. It focuses on fast implementation, simpler configuration, and giving product teams more control without requiring deep BI or modeling expertise.
Case studies with Guac and Fiber AI outline how teams moved away from more complex analytics setups and shortened the time from raw data to usable, embedded dashboards, cutting implementation from months down to days.
Conclusion
Looker Embedded Analytics is a capable and mature solution, but it comes with real trade-offs.
For large enterprises with dedicated data teams, complex governance requirements, and deep Google Cloud integration, it can be a strong long-term choice.
For startups, fast-moving teams, and product-led companies, that same complexity can become friction. It can slow down implementation, increase maintenance overhead, and limit how quickly analytics evolves with the product.
This is why many teams now evaluate lighter, more product-focused embedded analytics approaches that prioritize speed, ease of use, and faster time to value alongside flexibility.
If your goal is to embed analytics that customers actually use without turning analytics into a long-term engineering project, it is worth exploring alternatives designed specifically for that use case.

Try Upsolve for Embedded Dashboards & AI Insights
Embed dashboards and AI insights directly into your product, with no heavy engineering required.
Fast setup
Built for SaaS products
30‑day free trial


