
Power BI alternatives that deliver better dashboards and insights, with a breakdown of embedding, performance, pricing, and fit for different business needs.

Ka Ling Wu
Co-Founder & CEO, Upsolve AI
10 min

If you're here, you're likely exploring alternatives to Power BI, and for good reason.
Maybe Power BI feels limiting when building customer-facing dashboards.
Maybe you’re hitting performance issues with large datasets.
Or maybe you just want something that’s easier to embed, scale, or customize without relying heavily on DAX or the Microsoft ecosystem.
Whatever the reason, the good news is: there are better-fit options depending on your use case.
Here are 7 strong Power BI competitors worth considering:
Upsolve.ai – Best for Customer-Facing Analytics
Tableau – Best for Advanced Visualizations
Looker – Best for Cloud-Based Analytics
Qlik Sense – Best for Data Discovery
Sisense – Best for Embedded Analytics
MicroStrategy – Best for Enterprise-Scale Analytics
Mode – Best for Collaborative Analytics
In this blog, we’ll break down where Power BI falls short, what these bi alternatives do better, and how to choose the one that fits your product, users, and growth plans best.
Power BI Alternatives (Quick Comparison Table)
Tool | Best For | Strengths | Starting Price |
|---|---|---|---|
Power BI | Internal reporting (MS stack) | Excel/Azure integration • Low cost | Free – $24/user/mo |
Upsolve | Embedded, user-facing dashboards | No-code setup • End-user personalization • Built for SaaS | Free tier; from $500/mo (Team $2,000/mo for embedding) |
Tableau | Advanced visual dashboards | Deep customization • Strong visuals | $75/user/mo |
Looker | Scalable, cloud-based BI | LookML • Live DB access • Embedding APIs | Custom |
Qlik Sense | Self-service & AI insights | Associative model • GenAI features | $200/mo (10 users) |
Sisense | Embedded analytics at scale | Flexible deploy • Handles large data | Custom |
MicroStrategy | Enterprise-scale BI | Machine learning • Strong security | $2K–$20K+/mo |
Mode | Collaborative data teams | SQL + Python/R • Real-time sharing | Free – Custom |
What is Power BI?
Power BI integrates seamlessly with the Microsoft ecosystem, turning raw data into interactive reports and dashboards that drive smarter business decisions.
Think of it like this:
Non-technical users can simply drag and drop fields, and Power BI automatically updates visuals, providing instant insights.
With AI-powered Copilot, you can ask questions like “What’s driving sales growth?” and receive a full report with visuals and insights.
It works directly with Microsoft products, so you can access live data and real-time updates without leaving your familiar tools.
You can embed customized dashboards into your app or website using Power BI Embedded, giving your users the same powerful insights.
Set up automatic alerts to track your KPIs, and get notified via email or Slack when key metrics change.
In short: Power BI is perfect for teams who need an easy-to-use, powerful tool for reporting and data analysis, especially if you're already using Microsoft tools.
Power BI Pricing:
Plan Name | Price (Per User/Month) | Best For | Key Features |
|---|---|---|---|
Power BI Free | $0 | Individuals & small projects | Basic reporting, limited sharing, personal use only |
Power BI Pro | $14 (billed annually) | Teams needing collaboration | Report sharing, collaboration, export to Excel, app workspaces |
Power BI Premium (Per User) | $24 (billed annually) | Advanced users & growing teams | Larger model sizes, AI features, higher refresh rates |
Power BI Embedded | Custom (based on usage) | Developers embedding dashboards in products | White-labeled analytics, API access, pay-as-you-go via Azure pricing |
💡 Power BI Embedded pricing is usage-based and billed via Microsoft Azure. Contact sales for a custom quote.
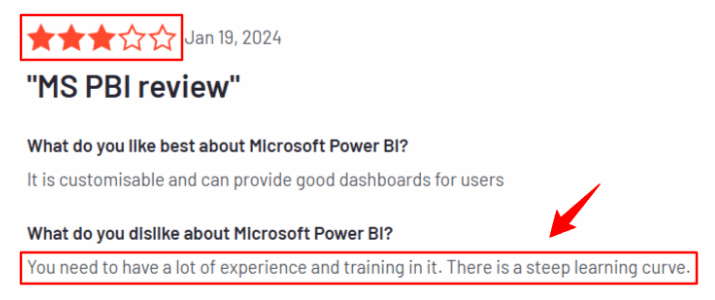
4 Limitations of Power BI You Should Know
Steep learning curve for beginners: If you're not familiar with data modeling or DAX, getting started with Power BI can feel overwhelming and slow down your workflow.
While Power BI integrates well with Microsoft tools, it might not connect seamlessly with non-Microsoft apps. This can be an issue if your business uses various tools.
Costs can scale quickly: Power BI Pro starts at $14/user/month, but if you need advanced features or have a large team, you’ll likely need the Premium plan, which can get expensive

Performance issues with large datasets: Handling massive or complex datasets may lead to slower load times and reduced responsiveness during analysis.
Limited customization for customer-facing dashboards: Power BI offers some customization options but can be limited when creating polished, customer-facing reports and dashboards.
7 Power BI Alternatives To Build BI Dashboards
Choosing the right Power BI competitor can significantly affect how quickly your business grows. After testing a variety of tools, here are my top picks for the best alternatives to Power BI, each excelling in different areas:
Upsolve.ai – Best for Embedded GenBI
Tableau – Best for Advanced Visualizations
Looker – Best for Cloud-Based Analytics
Qlik Sense – Best for Data Discovery
Sisense – Best for Embedded Analytics
MicroStrategy – Best for Enterprise-Scale Analytics
Mode – Best for Collaborative Analytics
Each tool has unique strengths, allowing you to choose the one that best suits your specific business needs. So, now, let’s explore each of these tools individually and find the best pick!
Upsolve: Best Power BI Alternative For Embedded GenBI
Upsolve AI is a fully hosted, white-label analytics layer that you drop into any SaaS product.
It auto-generates role-based dashboards, turns plain-English questions into charts, and pushes AI insights to each tenant, so you deliver “built-in BI” without writing BI code.
Think of it like this:
Choose CFO vs Product Manager; Upsolve instantly themes a dashboard to that persona.
Ask in plain English; the GenBI engine builds charts and alerts in seconds.
Embed with one React or iFrame tag; multi-tenant isolation is already baked in.
AI signals nudge users when a single client drives 50 % of revenue.
In short: Upsolve turns analytics into a native, hyper-personalized feature inside your app, no PowerPoint exports required.
Upsolve AI vs Power BI (Feature & Use Case)
Feature | Upsolve AI | Power BI |
|---|---|---|
Main Use Case | Embedded, persona-driven SaaS dashboards | Internal BI inside Microsoft 365 |
Target Users | Product & engineering teams | Business users & analysts |
Embedding | React/iFrame, white-label, 50 tenants in Growth | Power BI Embedded, Azure capacity |
Natural Language | Built-in GenBI chat for end users | Copilot in Fabric |
No-Code Builder | Ask-to-build + point-click UI | Power BI Desktop / Web |
AI Signals | Auto insights, push alerts | Copilot summaries, visuals |
Deployment | Cloud SaaS, optional on-prem | SaaS + optional Report Server |
Multi-Tenant | Tenant tokens out of the box | Workspaces & capacity SKUs |
Pros and Cons of Upsolve AI
✅ Pros
Hyper-personalized dashboards with zero code.
One-day embed; embedding and multi-tenant support are included on the Team plan.
Tenants and theming handled automatically.
❌ Cons
Lacks deep Excel/Teams tie-ins many orgs expect.
AI features are only available on higher tiers
Upsolve AI Pricing
Upsolve AI offers a free plan plus three paid tiers; embedding and multi-tenant analytics start on the Team plan ($2,000/mo).
Free ($0): 2,000 one-time credits (~200 questions); all Pro features, to test-drive
Pro ($500/mo): 2,000 credits/month; 50+ data connections, unlimited agents, full observability
Team ($2,000/mo): 10,000 credits/month; adds embedding, RBAC/row-level security, multi-tenant, and semantic-layer generation
Enterprise (custom): on-prem/VPC, SAML SSO, HIPAA, SOC 2, and BYOM
Annual billing is 20% off.
“Upsolve let us ditch Grafana and ship Fortune 100-grade dashboards in days.” — Arthur ML Ops team
When should you use Upsolve AI?
Your SaaS needs customer-facing analytics fast, with role-based views.
You lack BI engineers and want AI to build charts on demand.
Multi-tenant security and white-label UX are must-haves.
When not to use Upsolve AI?
Your priority is internal reporting across Excel, Teams, and Outlook, Power BI wins there.
Budget favors low per-user pricing over usage-based credit billing.
You need complex data modeling or pixel-perfect paginated reports.
In a nutshell, Upsolve makes embedded analytics a seamless part of your product, while Power BI remains the go-to for internal, 365-centric BI.
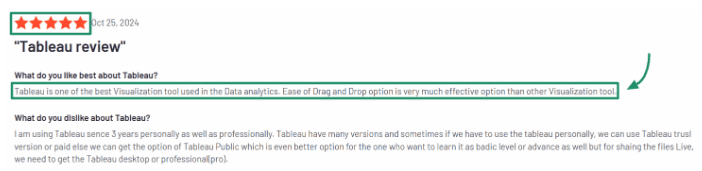
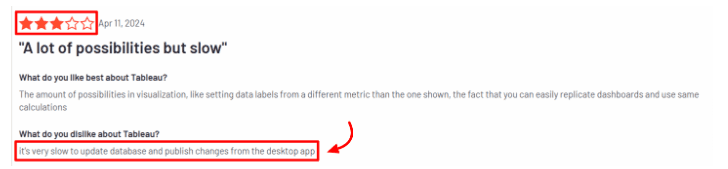
Tableau: Best Power BI Alternative For Advanced Visualizations
Tableau is a visual-analytics platform for teams that need complete control over how data looks and behaves.
Connect live or cached data, drag-and-drop fields, and build interactive dashboards that match any brand or reporting requirement—no code required.
Think of it like this:
Drop fields on a canvas; Tableau paints maps, animations, and parameter actions automatically.

Need a “finance vs sales” mash-up? Blend Snowflake, Excel, and Google Ads in one sheet.
Hit Live and the viz refreshes every few seconds on your 8-million-row postgres table.
Publish once—Teams, Slack, and mobile get the same interactive story.
In short: Tableau is for teams that want full creative control over rich, real-time visuals that wow stakeholders.
Tableau vs Power BI (Feature & Use Case)
Feature | Tableau | Power BI |
|---|---|---|
Main Use Case | Advanced, custom visual storytelling | 365-embedded self-service BI |
Target Users | Data viz designers & analysts | Office users & analysts |
Visual Depth | Animations, parameter actions, custom marks | Standard visuals + custom visuals marketplace |
Data Blending | Cross-database, in-memory or live | Dataflows & composite models |
Natural Language | Ask Data, Explain Data | Copilot chat |
Embedding | JS API, iFrame, Tableau Embedded | Power BI Embedded, Fabric |
Performance | Hyper engine, live query caching | Vertipaq, DirectLake |
Pricing | $75 Creator; $15 Viewer | $14 Pro; $24 PPU |
Pros and Cons of Tableau
✅ Pros
Unmatched control over look, feel, and interactivity.
Handles huge datasets via Hyper or live connections.
Broad connector library plus cross-database joins.
❌ Cons
Steeper learning curve for non-designers.
Creator seats start at $75/user—5× Power BI Pro.
Desktop authoring requires robust hardware; some features gated to Enterprise tier.
Tableau Pricing (billed annually)
Tier | Seat Type | Monthly Price | Yearly Cost* | What You’re Paying For |
|---|---|---|---|---|
Standard (Commercial) | Creator ( min 1 ) | $75 | $900 | Full authoring, Prep Builder, Pulse |
Explorer | $42 | $504 | Self-service build & explore | |
Viewer | $15 | $180 | View & interact only | |
Enterprise Edition | Creator | $115 | $1 380 | Standard Creator + Advanced Mgt + Data Mgt |
Explorer | $70 | $840 | Performance-tuned Explorer, governance extras | |
Viewer | $35 | $420 | Enterprise-grade viewing (row-level security, etc.) |
Minimum licence cost, explained
You must buy at least one Creator seat to spin up a Tableau deployment.
A single Creator licence costs $900 per year.
Need stakeholders to look, but not build? Add Viewers at $180 each.
A realistic starter setup (1 Creator + 5 Viewers) lands around $1 650/year—still far above Power BI Pro’s $14 pp/mo, but you get Tableau’s powerful visual layer.
Standard seats are cheaper and fine for departmental use.
Enterprise seats cost ~50 % more but bundle the admin, security, and catalog features large organisations need to run Tableau at scale.
If you only need a handful of highly polished dashboards, start with one Creator seat; if you need iron-clad governance across thousands of users, budget for Enterprise-grade licences.Ask ChatGPT
When should you use Tableau?
You need pixel-perfect, interactive visuals for exec decks or client-facing reports.
Real-time queries across mixed sources are critical.
Your team can invest in design skills and higher licensing costs.
When not to use Tableau?
You live in Microsoft 365 and want quick, Copilot-built reports—Power BI is smoother.
Budget or simple consumption dashboards trump custom design.
Embedded, multi-tenant SaaS analytics with strict theming is a higher priority (Upsolve or Sisense).
In a nutshell, Tableau is the Power BI alternative for teams that value artistic control and deep visual exploration above tight Office integration and low per-user pricing.

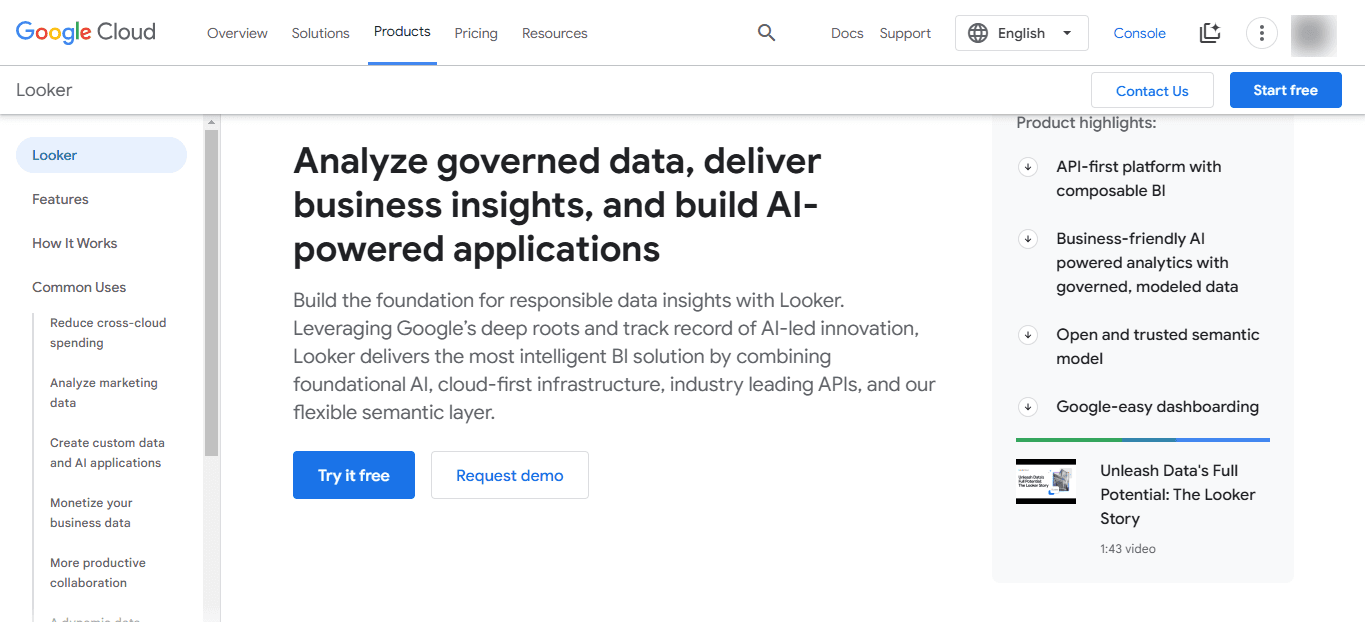
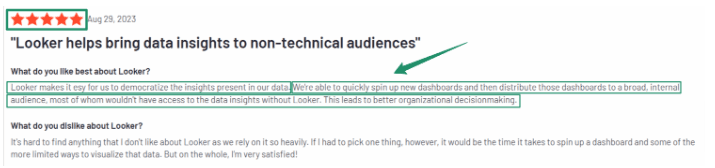
Looker: Best Power BI Alternative For Cloud-Based Analytics
Looker (Google Cloud core) is a semantic-layer BI platform: you model metrics once in LookML, run live queries on BigQuery or Snowflake, and embed the same governed dashboards in any web app, without managing servers or cubes.
Think of it like this:
Define revenue in LookML; every chart, API call, and embed shows the exact same number.
Product team drops a <LookerEmbed> component, customers now have white-label analytics.
Live mode hits your cloud warehouse, so execs see today’s sales in real time.
Ten Standard + two Developer seats come out of the box; scale to 50+ users or 500 K API calls as you grow.
In short: Looker is the Power BI alternative for companies that need a single semantic model, live cloud performance, and deep embed flexibility.
Looker vs Power BI (Feature & Use Case)
Feature | Looker | Power BI |
|---|---|---|
Main Use Case | Governed semantic layer & embeds | 365-embedded self-service BI |
Target Users | Data teams & product engineers | Office users & analysts |
Data Modeling | LookML version-controlled metrics | Power Query & DAX |
Embedding | JS SDK, iframes, quote-based Embed edition | Power BI Embedded / Fabric |
Live Queries | Always-live SQL on cloud warehouses | DirectQuery / DirectLake |
AI/NLQ | Gemini in Looker (Ask) | Copilot chat |
Governance | Central semantic layer + row ACLs | Azure AD + RLS/OLS |
Pricing | Quote-based platform + users | $14–$24 per user (PPU) |
Pros and Cons of Looker
✅ Pros
LookML enforces one source of truth across every dashboard and API.
Live, cloud-scale performance with no server upkeep.
Full white-label embeds for customer-facing analytics.
❌ Cons
LookML has a steeper learning curve for non-technical teams.
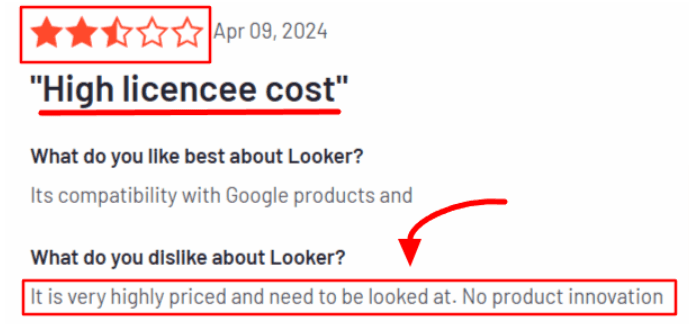
Quote-only pricing often starts >$60 K/yr, heavy for startups.
Looker Pricing (2025)
Edition | Best For | Key Limits |
|---|---|---|
Standard | Small teams <50 users | 1 000 API calls/mo |
Enterprise | Internal BI at scale | 100 000 API calls/mo, VPC-SC |
Embed | External analytics | 500 000 API calls/mo, white-label |
All editions include 10 Standard + 2 Developer users; additional seats and capacity are negotiated with Google Cloud sales.
When should you use Looker?
You need a central metric layer across dashboards, APIs, and embedded analytics.
Live, warehouse-scale queries matter more than desktop authoring.
You want to monetize data or add BI to a product with full white-label control.
When not to use Looker?
Your org lives in Microsoft 365 and wants quick Copilot-built reports—Power BI is cheaper and better integrated.
You lack engineering bandwidth to learn LookML or negotiate quote pricing.
Budget requires predictable per-user costs rather than six-figure platform deals.
In a nutshell, Looker is the go-to Power BI alternative for governed, cloud-native, and embeddable analytics, perfect when a single semantic layer and live SQL matter more than tight Office integration.
Qlik Sense: Best Power BI Alternative For Data Discovery
Qlik Sense is Qlik Cloud’s self-service analytics layer: its associative engine recalculates every chart as you click, while Qlik Answers and Predict add GenAI insights and no-code machine learning.
Subscriptions are capacity-based (Starter → Enterprise), so you pay for data limits instead of per-user seat math.
Think of it like this:
Make a selection anywhere; excluded values light up to reveal hidden relationships.
Qlik Answers explains trends in plain English, and Predict builds ML models without code.
Drag-drop a KPI, embed the sheet with a JS SDK or iFrame—your web app now has interactive analytics.
Starter tenants begin at 10 users/25 GB; Enterprise scales past 250 GB and 40 GB-sized apps.
In short: Qlik Sense gives non-technical teams Google-Maps-style exploration and GenAI explanations, all without local servers.
Qlik Sense vs Power BI (Feature & Use Case)
Feature | Qlik Sense | Power BI |
|---|---|---|
Main Use Case | Associative discovery & GenAI insights | 365-embedded BI & Copilot |
Target Users | Data-curious business teams | Office users & analysts |
Data Model | In-memory associative engine | Vertipaq + DirectLake |
Natural Language / AI | Qlik Answers NLQ + Predict ML | Copilot chat & visuals |
Embedding | JS/iframe, white-label | Power BI Embedded |
Pricing Model | Capacity tiers (GB) | Per-user / capacity SKUs |
Offline/Desktop | Browser only | Desktop authoring |
Governance | Section access, spaces | Azure AD + RLS |
Pros and Cons of Qlik Sense
✅ Pros
Associative engine finds insights SQL joins miss.

GenAI assistant and no-code ML speed discovery.
Predictable costs via capacity pricing; free viewers aren’t metered.
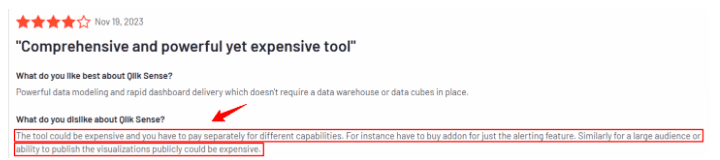
❌ Cons
Starter $200/mo still hefty for very small teams.
Browser-only; no offline desktop authoring.
Advanced governance (section access) needs admin training.
Qlik Sense Pricing (billed annually)
Plan | Price | Capacity | Highlights |
|---|---|---|---|
Starter | $200/mo | 10 users, 25 GB | AI insights, 5 GB app size, community support |
Standard | $825/mo | 25 GB + | Automations, 24/7 support, 1 GB personal space |
Premium | $2 750/mo | 50 GB + | Predict ML, anonymous access, SAP connectors |
Enterprise | Custom | 250 GB + | Multi-region, 40 GB apps, full-scale deployments |
All tiers include 100 + data connectors, mobile apps, embedded analytics, and GenAI exploration.
When should you use Qlik Sense?
You want click-anywhere exploration and AI-generated narratives.
Capacity-based pricing fits your budget better than per-user licenses.
Embedded, white-label dashboards are a roadmap must-have.
When not to use Qlik Sense?
Your org lives inside Microsoft 365, Power BI’s Teams/Excel tie-ins are smoother.
Offline desktop authoring or pixel-perfect paginated reports are essential.
Tiny startups may find the $200/mo entry still pricey.
In a nutshell, Qlik Sense is the Power BI alternative for associative discovery, GenAI insights, and capacity-based economics, ideal when fast, self-serve exploration beats tight Office integration.
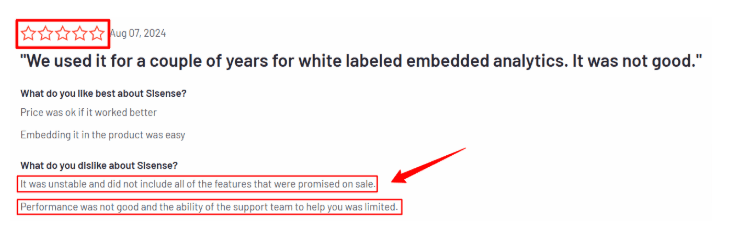
Sisense: Best Power BI Alternative For Embedded Analytics
Sisense is a code-friendly, high-performance analytics stack: its ElastiCube engine crunches billions of rows, while the Compose SDK lets developers drop white-label dashboards into any app, cloud, on-prem, or hybrid.

Think of it like this:
Point Sisense at Redshift + Salesforce, build an ElastiCube, and query sub-second.
Embed a chart with one
<ComposeChart>tag; customers get live, branded analytics.Elastic capacity scales from a 10 GB data mart to 40 GB app models without rewrites.
Set an alert: if margin drops 5 %, Sisense pings Slack and triggers a webhook.
In short: Sisense is the Power BI alternative for huge datasets, deep embedding, and composable analytics components.
Sisense vs Power BI (Feature & Use Case)
Feature | Sisense | Power BI |
|---|---|---|
Main Use Case | Embedded analytics & large-scale internal BI | 365-embedded self-service BI |
Target Users | Product engineers & data teams | Office users & analysts |
Data Engine | ElastiCube & live SQL | Vertipaq / DirectLake |
Embedding | Compose SDK, JS, iFrame, Embed SDK | Power BI Embedded / Fabric |
Alerts & Automations | Built-in, webhook triggers | Power Automate, data alerts |
Deployment | Cloud, on-prem, hybrid | SaaS + Report Server option |
Pricing Model | Quote-based, starts ≈ $10-60 K/yr | $14–$24 per user (PPU) |
Learning Curve | Higher (Elasticube, SDK) | Lower for Excel users |
Pros and Cons of Sisense
✅ Pros
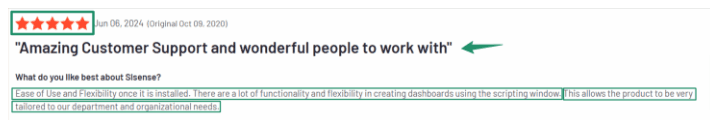
ElastiCube + analytic engine handle very large, complex datasets.
Compose SDK allows full white-label, code-first embeds.
Flexible deployment: cloud SaaS, self-hosted Linux, or hybrid.
❌ Cons
Steep learning curve for non-developers (modeling, SDK).
Quote-based pricing often starts at $10 K–$60 K/yr; higher tiers >$100 K.
Sisense Pricing Snapshot (2025)
Range | Typical Use Case | Notes |
|---|---|---|
$10 K–$25 K/yr | Small internal BI, self-hosted | Limited seats & connectors |
$25 K–$60 K/yr | Mid-size cloud or embedded | Most SaaS quotes fall here |
$60 K + /yr | Enterprise & OEM at scale | Extra for ML, multi-region |
Estimated pricing estimates through various sources. Prices vary by users, data volume, hosting, and AI add-ons.
When should you use Sisense?
You’re embedding analytics into a product and need full UX control.
Datasets are huge or complex, and query speed matters.
Hybrid/on-prem deployment or strict data residency is required.
When not to use Sisense?
Your org lives in Microsoft 365 and values Copilot/Excel synergy—Power BI fits better.
Budget favors low per-user pricing over quote-based contracts.
Business users need quick, no-code authoring without developer help.
In a nutshell, Sisense is the top Power BI alternative when composable embeds, big-data performance, and flexible deployment beat tight Office integration and simple seat licensing.
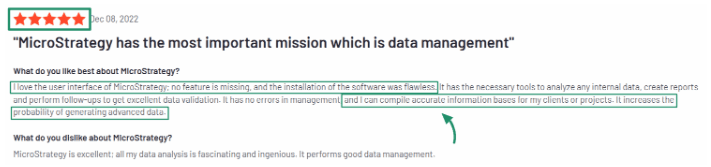
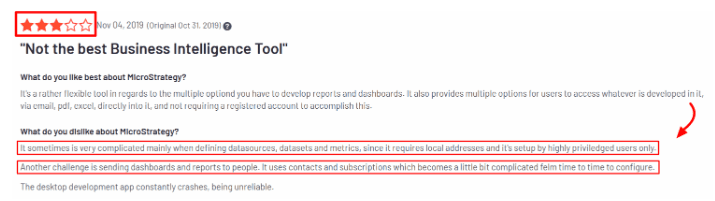
MicroStrategy: Best Power BI Alternative For Enterprise-Scale Analytics
MicroStrategy is an enterprise BI stack with an in-memory + live engine, layered security, and a REST/Embedding SDK that lets you model terabyte data, drop dossiers into web apps, and query it all with GenAI “Auto Answers.”

Think of it like this:
Model a 5-TB Snowflake mart; HyperIntelligence cards surface KPIs in Gmail and Salesforce.
Product team adds one
<mstr-dossier>tag—customers now have branded, role-aware dashboards.Exec types “Predict Q4 churn”; Auto Answers builds the predictive chart and emails it.
AES-256 encryption, row-level security, and SAML/LDAP keep auditors happy.
In short: MicroStrategy is the Power BI rival when you need iron-clad governance, huge data volumes, and deep embedding.
MicroStrategy vs Power BI (Feature & Use Case)
Feature | MicroStrategy | Power BI |
|---|---|---|
Main Use Case | Enterprise AI + embedded dossiers | 365-embedded self-service BI |
Target Users | Global data teams & product owners | Office users & analysts |
Data Engine | In-memory cubes + live SQL | Vertipaq / DirectLake |
Embedding | REST & Embedding SDK, HyperIntelligence | Power BI Embedded / Fabric |
AI / NLQ | Auto Answers, Auto Dashboard | Copilot chat |
Security | AES-256, row ACL, SAML/LDAP, VPC | Azure AD, RLS/OLS |
Pricing Model | Quote-based (tier + user) | $14–$24 per user (PPU) |
Deployment | Cloud, on-prem, hybrid | SaaS + Report Server |
Pros and Cons of MicroStrategy
✅ Pros
Handles multi-terabyte data and hundreds of concurrent users.
HyperIntelligence, Auto Answers, and predictive functions for rich AI analytics.
Deep security & compliance for regulated industries.
❌ Cons
Complex to stand up; developer skills essential.
Quote pricing starts ~$20 K+/mo at scale—steep for SMBs.
Overkill if you just need simple self-service dashboards.
MicroStrategy Pricing Snapshot (Estimated)
Based on data from Spendflo and NPI Financial. Actual pricing may vary depending on your needs.
Type | Est. Cost | Typical Scenario |
|---|---|---|
Small Teams | $2 K–$5 K/mo | Mobile/light deployment |
Enterprise Scale | $20 K+/mo | Full cloud/on-prem footprint |
Per-User (On-Prem) | $600–$5 000/yr | Reader → Architect seats |
Per-User (Cloud) | ~⅓ of on-prem | Discounted SaaS licenses |
Pricing is always customized, contact MicroStrategy for a formal quote.
When should you use MicroStrategy?
Global enterprise, strict security, multi-TB data, and 100 + departments.
Need AI-driven auto-insights plus fully white-label embeds.
Hybrid or on-prem deployment is mandated by compliance.
When not to use MicroStrategy?
You’re a small org that just needs quick Teams/Excel reports—Power BI is cheaper.
Limited BI headcount to learn and manage cubes, SDK, and security layers.
Budget favors predictable per-user SaaS pricing.
In a nutshell, MicroStrategy is the heavyweight Power BI alternative built for regulated, data-dense enterprises that want governed AI analytics everywhere—from dashboards to in-app cards.
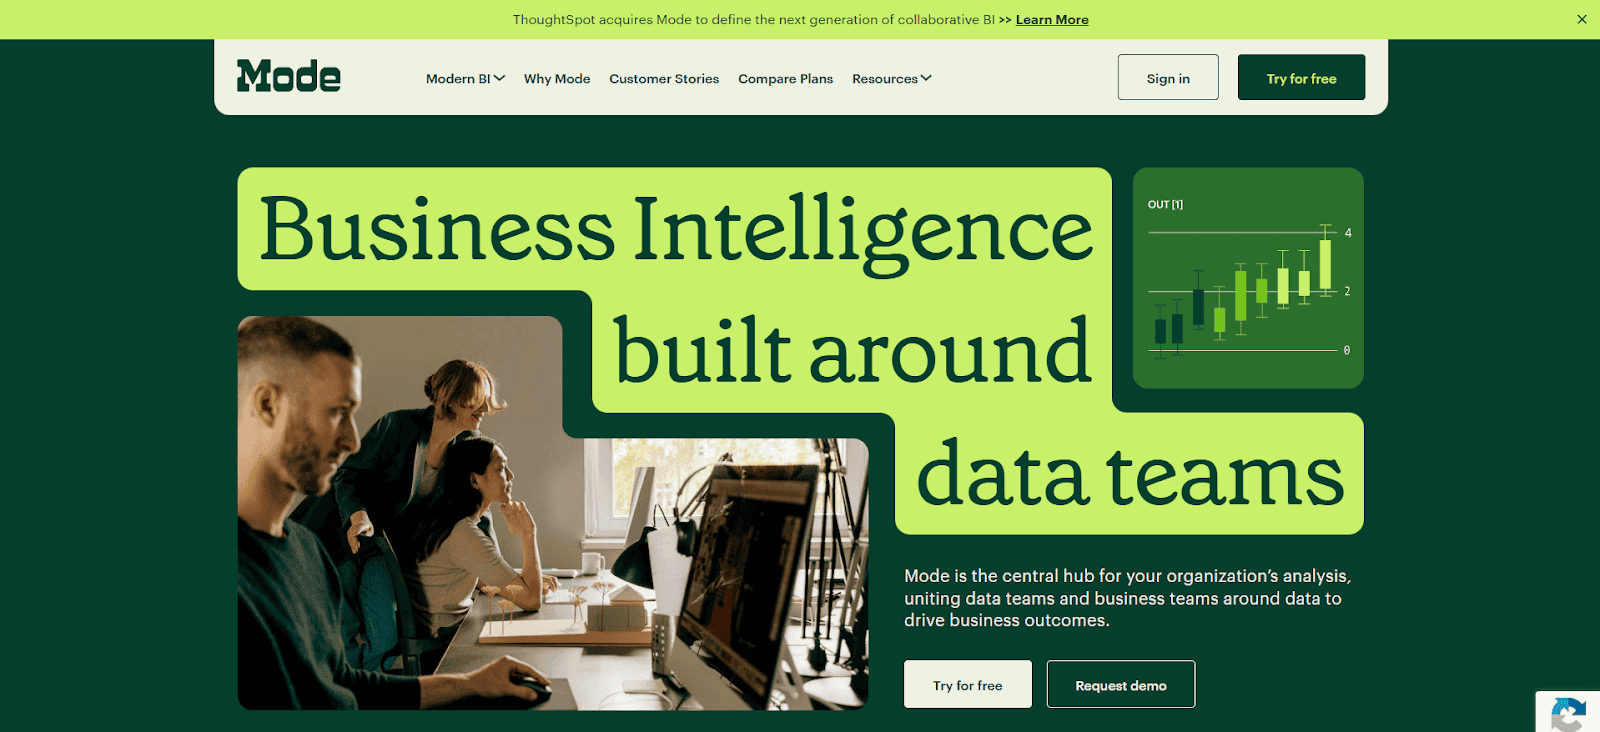
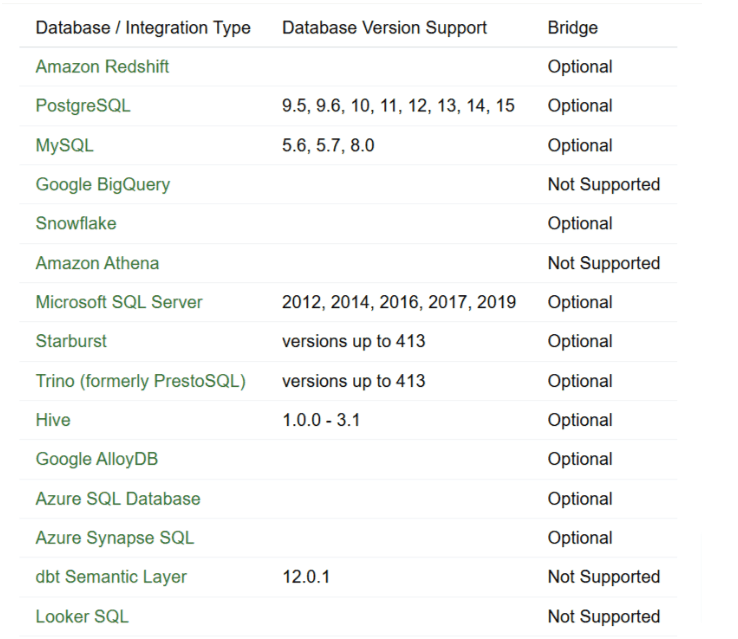
Mode: Best Power BI Alternative For Collaborative Analytics
Mode keeps all your analysis in one browser tab.
Write SQL.
Switch to Python or R to dig deeper.
Turn results into live, shareable dashboards.
Teammates can comment, edit, and get Slack or email updates right away—no waiting for files to bounce back and forth.
Think of it like this:
An analyst queries Snowflake, tweaks a chart in Python, and a PM comments on the draft—all before lunch.
Dashboards auto-refresh every hour and post highlights to a #metrics channel.
Studio is free for up to three users; Pro unlocks scheduling and API exports, Enterprise adds SAML and unlimited compute.
In short: Mode is the Power BI alternative when your team lives in SQL and notebooks and wants Git-style collaboration on data.
Mode vs Power BI (Feature & Use Case)
Feature | Mode | Power BI |
|---|---|---|
Main Use Case | Collaborative SQL + notebook analytics | 365-embedded self-service BI |
Target Users | Data analysts & PMs who code | Office users & analysts |
Authoring | In-browser SQL editor + Python/R | Power BI Desktop / Web |
Dashboards | Custom HTML/CSS, real-time edits | Drag-and-drop visuals |
Notebook Support | Native Python & R | Via Fabric Notebook / outside tools |
Collaboration | Live comments, version history | Teams/SharePoint integration |
Deployment | Cloud SaaS only | SaaS + Report Server option |
Pricing Model | Free Studio; quote-based Pro/Enterprise | $14–$24 per user (PPU) |
Pros and Cons of Mode
✅ Pros
Seamless switch between SQL results and Python/R for deep analysis.
Real-time commenting and versioning speed team workflows.
Custom HTML dashboards for advanced, interactive visuals.
❌ Cons
Coding orientation can be daunting for non-technical teams.
Fewer out-of-the-box visual types than Power BI or Tableau.
Requires cloud deployment—no on-prem option for strict compliance.
Mode Pricing (2025)
Plan | Price | Best For | Key Limits |
|---|---|---|---|
Studio | Free | Individual analysts | 3 users, 10 MB/query |
Pro | Contact sales | Small–mid teams | 5 GB/query, 250 GB/mo, scheduling, API |
Enterprise | Contact sales | 50+ users, SSO | Custom compute, SAML, premium support |
💬 Median buyers pay around $56,620/year, per Vendr's benchmark (based on 78 purchases).
When should you use Mode?
Your analysts live in SQL and Python/R and need notebook-grade flexibility.
Real-time collaboration and version control matter more than pixel-perfect design.
You’re fine with a cloud-only SaaS model.
When not to use Mode?
Your org revolves around Excel/Teams—Power BI integrates more naturally.
Business users need drag-and-drop authoring, not code.
Strict data-residency rules require on-prem deployment.
In a nutshell, Mode is the Power BI alternative for data teams that code together, blending queries, notebooks, and dashboards without the back-and-forth.
Conclusion
If you’re comparing the top 7 BI competitors, you’re probably trying to solve more than just a reporting need.
You want a solution that fits into your product, not one that sits on top of it.
Something fast to deploy, easy for users to explore, and flexible enough to grow with your business.
Tools like Tableau and Looker are powerful, but they weren’t built for embedded, user-facing analytics.
They work great internally, but can get complicated when you need to put insights in front of customers.
Upsolve is simple, helping teams ship customer-facing dashboards without the complexity.
Let's chat for a quick demo!
FAQs About Power BI and Its Competitors
Q1. What are the top competitors to Power BI?
Some of the strongest Power BI alternatives include Upsolve, Looker, Tableau, Qlik Sense, Sisense, Mode, and MicroStrategy. Each tool has its own strengths—like embedded analytics, AI-driven insights, or scalability for large datasets.
Q2. What is more advanced than Power BI?
Platforms like Looker and MicroStrategy offer more advanced data modeling and enterprise features, while tools like Upsolve are more modern and easier to embed into customer-facing products—no steep learning curve required.
Q3. What is Google’s equivalent to Power BI?
Google’s closest BI equivalent is Looker, which is now part of Google Cloud. It’s a cloud-native analytics platform with robust modeling (LookML), live connections, and embedded analytics support.
Q4. Is Power BI being replaced by AI?
Not exactly. Power BI is starting to include AI features, but it’s not being replaced. However, tools like Upsolve and Qlik now use AI more effectively to surface insights and automate analysis in real time.
Q5. Is Power BI better than Tableau or Qlik?
It depends on your use case. Power BI is cost-effective and integrates well with Microsoft tools. Tableau is better for data visualizations, and Qlik Sense excels in data discovery and AI-powered insights. For embedded use cases, Upsolve or Mode may be better choices.
Q6. Is Power BI similar to Salesforce or SAP?
No, Power BI is a business intelligence tool, not a CRM like Salesforce or an ERP like SAP. That said, Power BI can connect to both systems for reporting and analysis.
Q7. Is Power BI shutting down or losing market share?
No, Power BI is still widely used, especially by Microsoft-focused organizations. However, it's facing growing competition from newer, more specialized BI tools, especially in the embedded and product analytics space.
Q8. Are there free Power BI alternatives?
Yes. Tools like Looker Studio, Metabase, and Mode Studio offer free tiers. These are great for startups or individual analysts needing basic dashboards.
Q9. What’s the best BI tool in the market right now?
There’s no single “best” tool, it depends on your goals. For internal dashboards, Power BI and Tableau are strong. For user-facing embedded analytics, Upsolve stands out for ts simplicity, speed, and scalability

Try Upsolve for Embedded Dashboards & AI Insights
Embed dashboards and AI insights directly into your product, with no heavy engineering required.
Fast setup
Built for SaaS products
30‑day free trial


