
Learn how to create dashboards using an AI dashboard generator in under five minutes, with a step-by-step walkthrough and real examples using Upsolve.ai.

Ka Ling Wu
Co-Founder & CEO, Upsolve AI
10 min

Have you ever struggled to create a dashboard?
Let’s be real: Manually building dashboards feels like a chore you dislike. It can feel like a waste of time and downright frustrating, especially if you’re not a tech expert.
However, with AI tools, you can turn your data into beautiful and workable visuals in minutes with minimal coding and headaches.
The problem now is: How do you find a fast, simple, and effective AI solution?
That’s why we’re here. This blog will show you how to save time, energy, and effort using AI dashboard generators like Upsolve.ai. Here’s what we’ll cover:
What are AI dashboards, and why are they excellent for data visualization?
A step-by-step guide to building dashboards with Upsolve.ai in under 5 minutes—no tech skills needed.
Key factors to consider before picking an AI dashboard tool.
If you skip this, you might miss out on a tool that could save you weekly hours while delivering professional, easy-to-use dashboards.
Let’s dive in!
What Is An AI Dashboard?
An AI dashboard is a tool that uses artificial intelligence to organize and display data in a visual format.
Instead of manually creating charts or tables, an AI dashboard analyzes your data and presents it in a way that is easy to understand.
How Different Sectors Benefit From Using AI Dashboards
AI dashboards are not limited to a single industry. They are versatile and provide value across various sectors:
Retail: Track sales performance, inventory levels, and customer preferences in real-time. For example, a retail manager can monitor daily sales trends and adjust inventory based on demand patterns.
Healthcare: Visualize patient data, track treatment outcomes, or monitor hospital resource utilization. A hospital administrator can use an AI dashboard to oversee bed occupancy rates and patient wait times.
Finance: Analyze cash flow, forecast revenue, and identify financial risks. For instance, a financial analyst can assess profitability trends across different departments using dynamic dashboards.
Education: Evaluate student performance, attendance, and resource allocation. A school principal can identify areas for improvement by analyzing exam results and attendance rates.
Logistics: Optimize delivery routes, monitor fleet performance, and reduce operational costs. A logistics manager can track delivery times and delays to ensure efficient operations, especially when paired with AI-powered supply chain analytics.
Marketing: Measure campaign performance, customer engagement, and ROI. A marketer can see how ads perform across different channels and adjust strategies accordingly.
Examples of Popular AI Dashboard Tools
Several AI-powered BI tools are available today that allow users to generate AI dashboards. Each tool serves a specific type of user or need:. Each tool serves a specific type of user or need:
Upsolve.ai: It stands out for its simplicity and speed. It automates most of the steps and focuses on helping users build dashboards in less than five minutes.
Tableau with AI features: It helps businesses analyze and visualize data with automation.
Microsoft Power BI with AI integrations: It helps make large datasets understandable.
Google Looker Studio: It offers simple tools for connecting and analyzing data in real time.
If you are looking for a tool that combines speed, accuracy, and ease of use, Upsolve.ai is a good choice.
Here’s why I say that:

What are the Key Features of AI Dashboards?
Data Automation:
AI dashboards connect to your data sources and handle repetitive tasks like cleaning and formatting the data, similar to how AI agents for data analysis automate insight generation.
For example, instead of spending hours preparing data in Excel, the AI takes care of it instantly.
Intelligent Visualizations:
AI chooses the best chart or graph for your data. For example, if you are tracking sales trends, it might suggest a line graph. If you are comparing team performance, it might create a bar chart. For more on choosing the right visualization, see our guide to building meaningful dashboards.
For example, if you are tracking sales trends, it might suggest a line graph. If you are comparing team performance, it might create a bar chart.
Real-Time Updates:
AI dashboards refresh automatically when your data changes.
If you monitor customer feedback, the dashboard updates as new responses come in.
Easy Integration:
Many AI dashboards, including Upsolve.ai, integrate with tools you already use, such as Google Sheets, Excel, or SQL databases.
Customizable Insights:
You can adjust filters, set metrics, or add labels to tailor the dashboard to your specific needs.
AI dashboards save you time and let you focus on what really matters—what your data is actually saying.
So, how do you get started? Let me show you how easy it is to create one with Upsolve.ai. Here’s a simple step-by-step guide to get you up and running!
How To Create An AI Dashboard With Upsolve.ai [Step-By-Step Guide]
Before we begin, this guide is based on the video titled "How to Build Dashboards Using Upsolve.ai" by Sergey, the co-founder of Upsolve.ai.
He demonstrates how to create a dashboard for the Olympics committee using Upsolve.ai. The video provides a visual walkthrough; you can refer to it if you wish.
That said, creating a dashboard with Upsolve.ai is simple and can be done in a few steps.
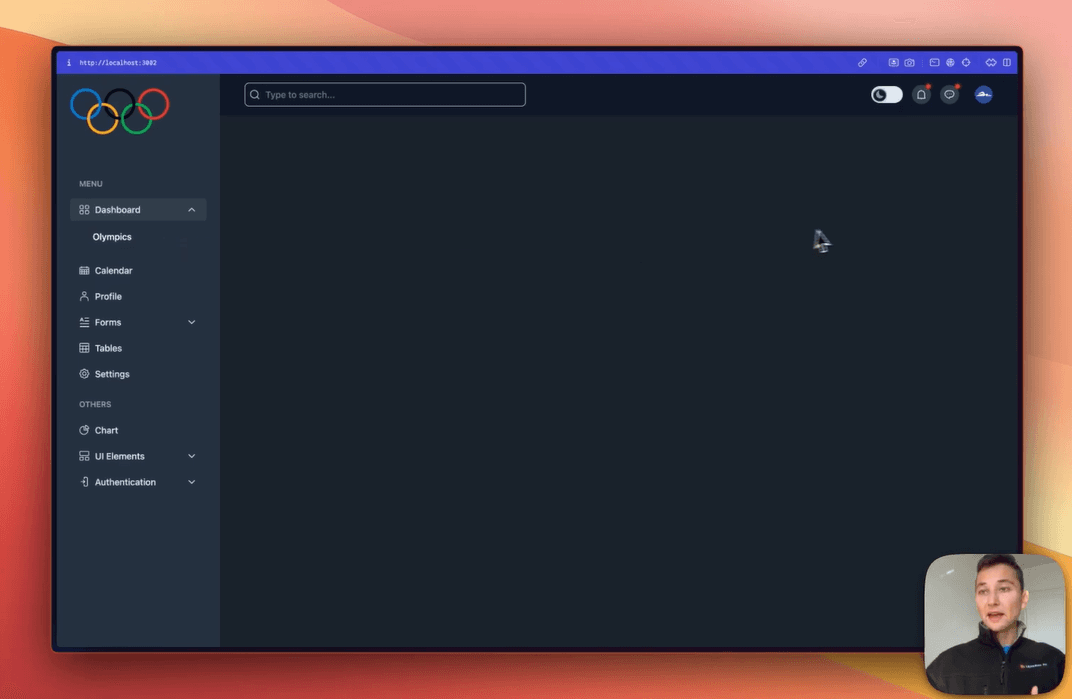
Step 1: Initial Setup
Sign in to your Upsolve.ai account.
After logging in, you’ll see a blank canvas where you can start building your dashboard.
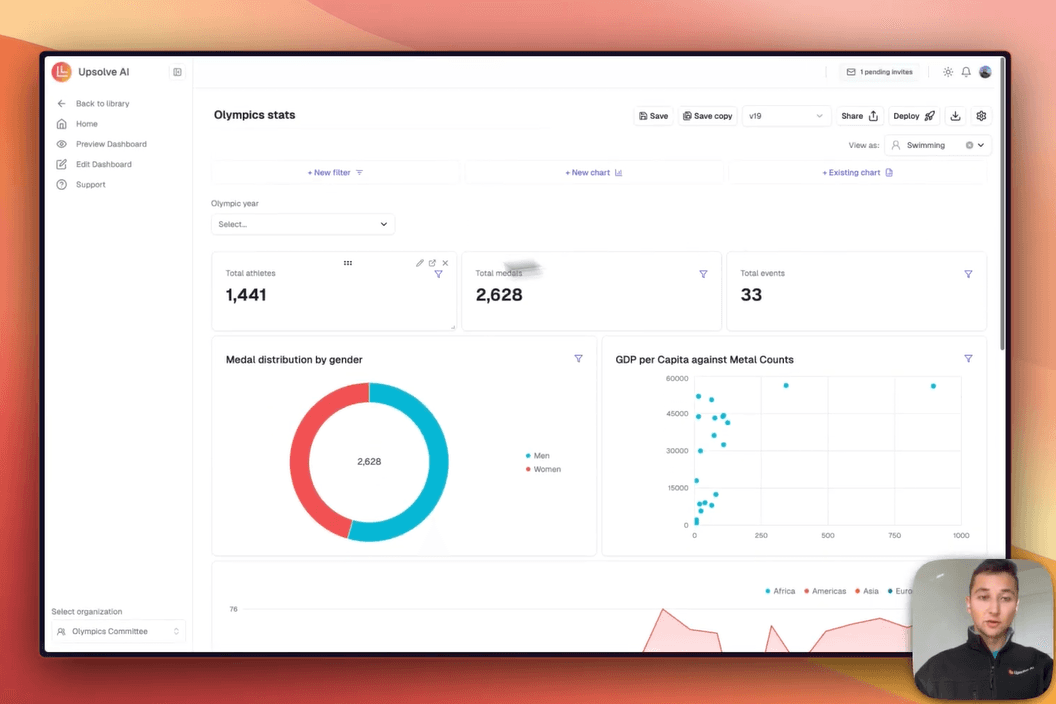
Sergey starts with a dashboard for the Olympics committee, which provides context for the kind of data you can work with.
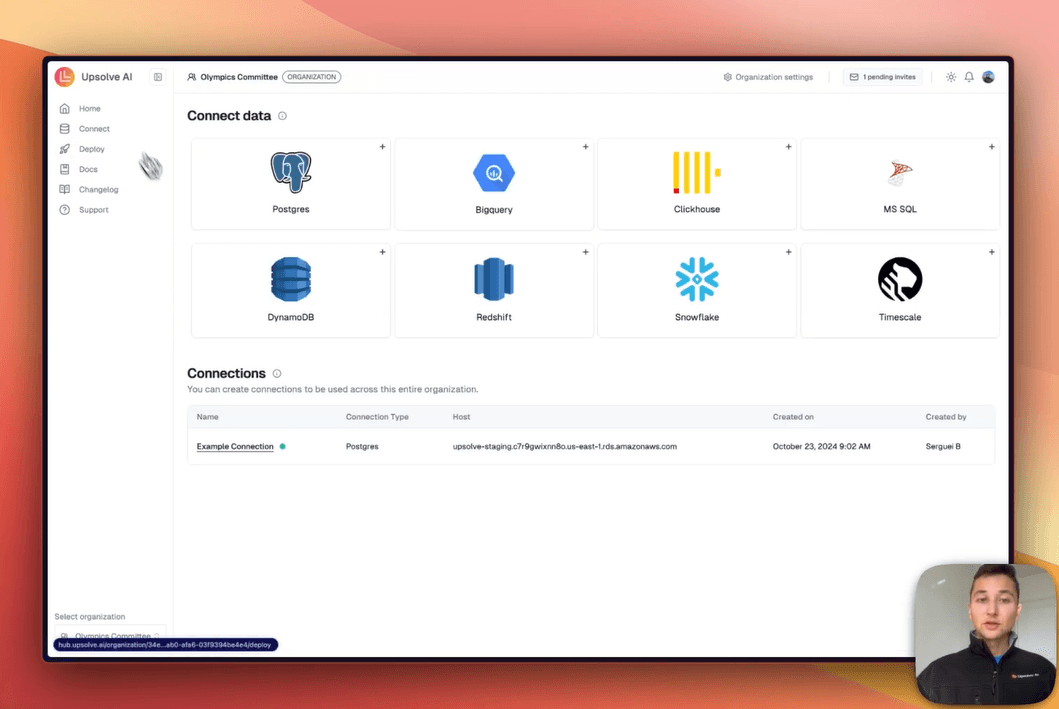
Step 2: Connect Your Data Source
Establish a connection to your data source. Upsolve.ai supports multiple sources, one of which is PostgreSQL.
Once connected, you’ll have access to datasets.
In the video, Sergey connects to Summer and Winter Olympics data.
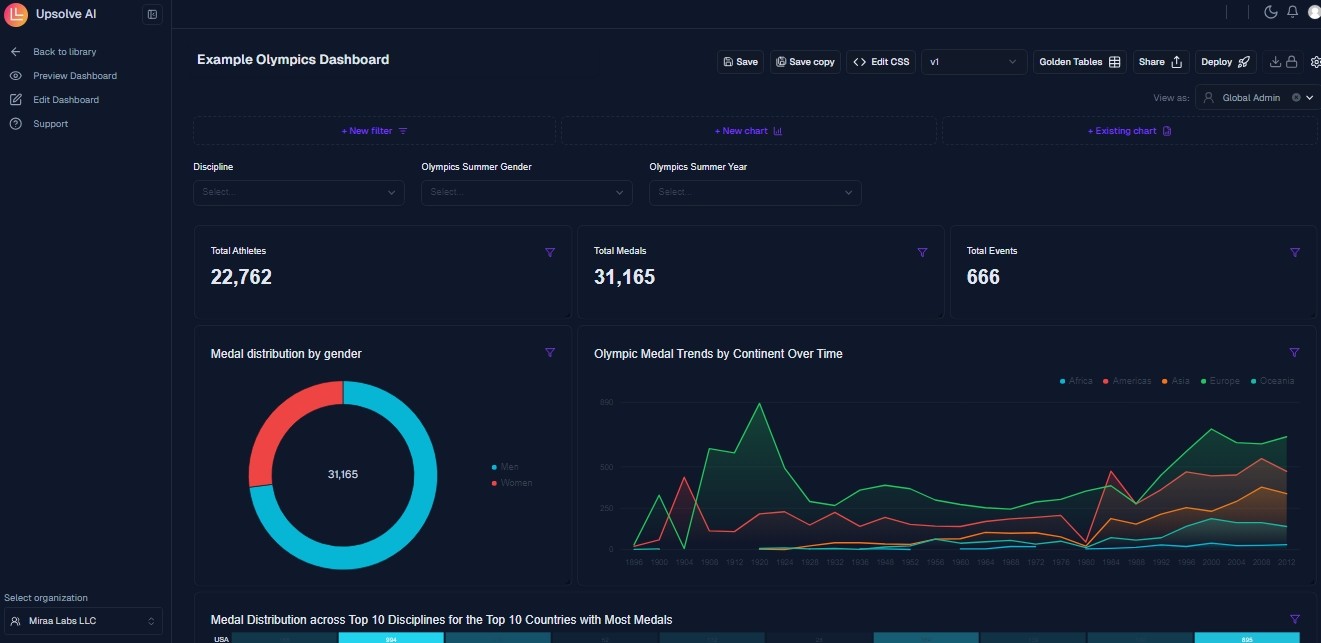
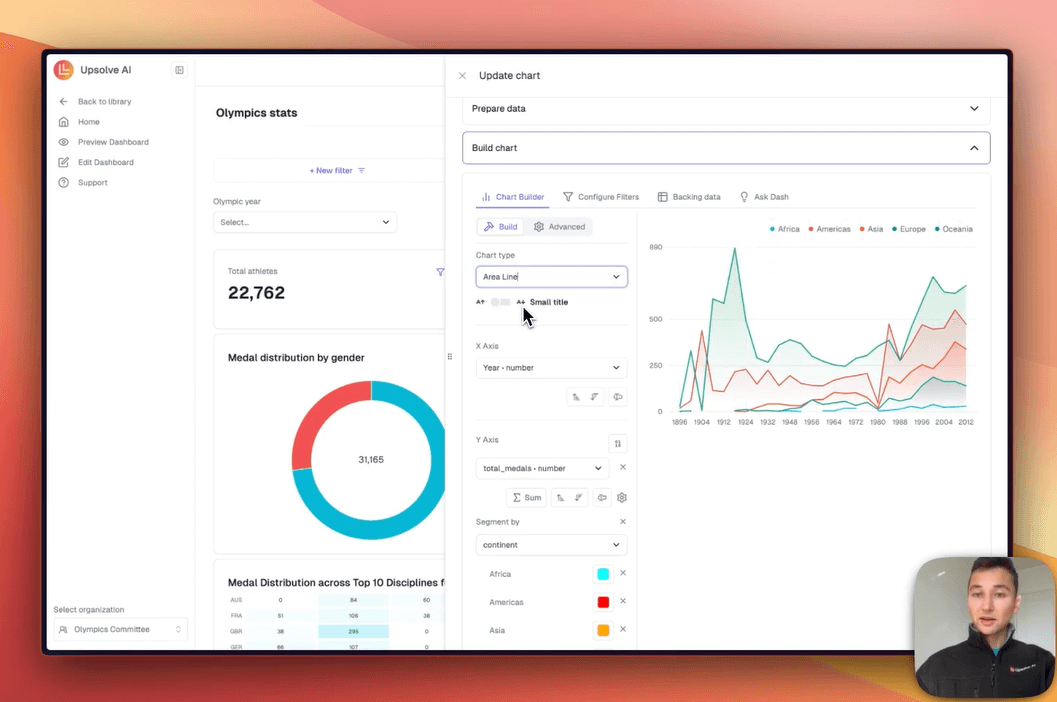
Step 3: Create Charts
Use Upsolve.ai to visualize your data by creating charts.
For example, Sergey creates a chart showing Olympic medal counts over time.
Customize the chart type (e.g., area line charts) and add it to your dashboard.
Step 4: Verify User-Specific Data
Make sure the dashboard displays data specific to the logged-in user.
In Sergey’s demonstration, the swimming committee only sees swimming-related data on their dashboard.
Upsolve.ai handles user permissions and ensures secure data visibility.
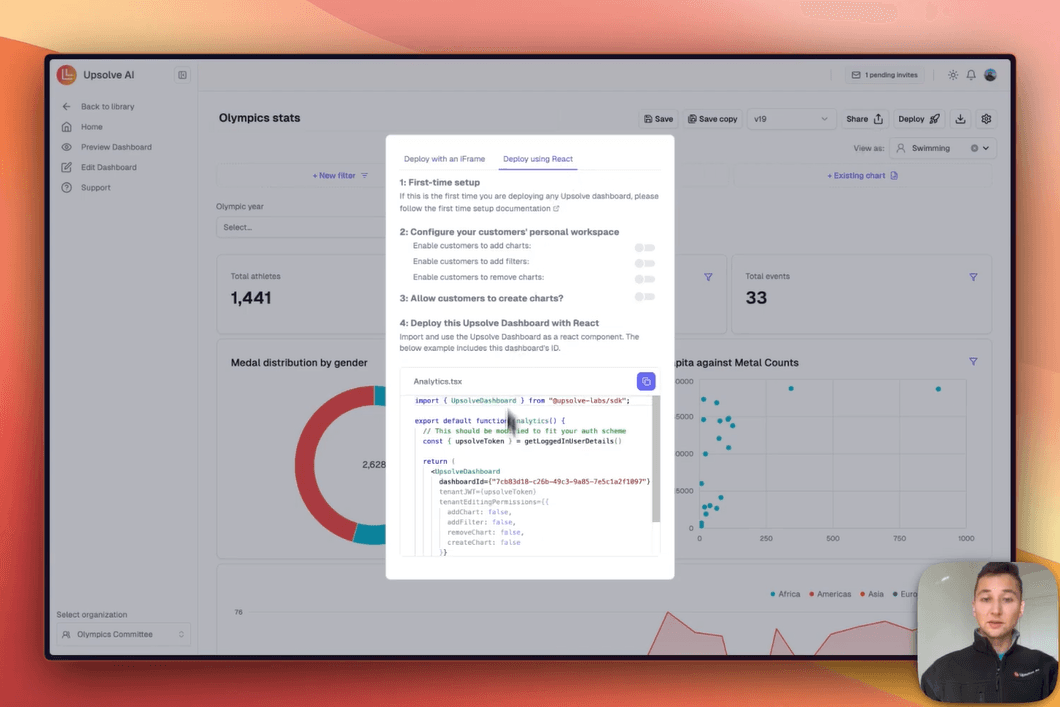
Step 5: Deploy Your Dashboard
Deploy the dashboard by integrating a React component into your application.
This step allows the dashboard to inherit your product’s styling whilst remaining responsive.
Once deployed, you can refresh the page to see your new dashboard embedded in your product.
Using Upsolve.ai, you can create a dashboard within minutes. These steps ensure your dashboard is professional and tailored to your specific needs.
What Factors Should You Consider Before Choosing An AI Dashboard Generator?
This is the real deal; choosing the right AI dashboard generator is an important decision.
Any tool you choose should align with your needs and provide long-term value.

Here are the key factors to consider:
Pricing
Evaluate the cost of the tool and whether it fits within your budget.
Some tools offer free plans with limited features, while others have premium options with advanced functionalities.
Compare the pricing of tools like Upsolve.ai with those of others, such as Tableau or Power BI, to see which gives you the best value for your investment.
Integration Needs
Ensure the tool works with your preferred data sources, such as SQL databases, Google Sheets, or cloud storage solutions.
For example, Upsolve.ai seamlessly connects to PostgreSQL and other familiar data sources, making it easy to pull data without additional setup.
Scalability
Think about how the tool will grow with your needs.
Will the tool handle more extensive datasets and users without performance issues if your business expands?
Upsolve.ai offers scalable solutions, ensuring that the tool continues to deliver efficient results as your data grows.
Ease of Use
Consider whether the tool is user-friendly, especially for non-technical users.
Tools like Upsolve.ai are designed with simplicity in mind, requiring no coding skills to create professional dashboards.
Customization Options
Check if the tool allows you to customize dashboards to fit your brand and specific requirements.
For instance, Upsolve.ai lets you tailor charts, filters, and permissions to suit individual user roles and needs.
Security and Permissions
Data security is critical, especially when handling sensitive information.
Ensure the tool includes features like user permissions and data encryption to protect your data. Upsolve.ai includes built-in features to restrict dashboard visibility based on user roles.
Support and Documentation
Look for tools that offer comprehensive support and precise documentation.
Upsolve.ai provides tutorials, guides, and support to help you troubleshoot and maximize the tool’s capabilities.
Evaluating these factors can go a long way to help you choose an AI dashboard generator that saves time, fits your needs, and supports your long-term goals.
Tools like Upsolve.ai check all these boxes, making them an ideal choice for many businesses.

Conclusion
Creating AI dashboards is essential for sharing data insights that drive action.
They help you communicate trends, track performance, and deliver valuable information to your customers clearly and effectively.
With tools like Upsolve.ai, building and sharing dashboards has become fast and straightforward.
Here’s a quick recap on how to create dashboards with AI:

Upsolve.ai helps you create professional dashboards quickly, making your insights easy to use and impactful for your customers.
In today’s fast-paced world, staying competitive means using tools that save time and improve customer experiences.
Get started with Upsolve.ai today and see how it can empower your business with meaningful, data-driven insights.

Try Upsolve for Embedded Dashboards & AI Insights
Embed dashboards and AI insights directly into your product, with no heavy engineering required.
Fast setup
Built for SaaS products
30‑day free trial


