
The tools, agents, and techniques behind AI for data analysis, and how to tell which ones hold up once real questions arrive.

Ka Ling Wu
Co-Founder & CEO, Upsolve AI
10 min

AI for data analysis is the use of artificial intelligence, primarily large language models and machine learning, to explore data, generate charts, answer questions in plain language, and surface insights without manual query writing. It spans a spectrum from tools that auto-generate a visualization to autonomous agents that plan and run a full analytical workflow on their own. This guide explains what AI data analysis actually is, the categories of tools available, how the technology works, and where it still falls short.
If you lead a data team or work as an analyst, you have felt the pressure from both sides: more questions coming in than any human queue can absorb, and a growing expectation that answers should arrive in seconds rather than days. AI promises to close that gap. The reality is more nuanced, and understanding the nuance is what separates teams that get value from AI from the ones that pile up abandoned pilots.
Key Takeaways |
|---|
|
What Is AI for Data Analysis?
AI for data analysis refers to any system that applies machine learning or generative AI to reduce the manual effort involved in turning raw data into understanding. In practice, that means a business user can ask a question in ordinary language, request a chart, or ask "what changed last quarter," and receive a usable answer without knowing SQL, without building a dashboard by hand, and often without waiting for the data team.
The term covers a wide range of capabilities. On the simpler end, an AI feature might suggest the best chart type for a dataset or write a summary of a table.
On the more advanced end, an AI agent can interpret an ambiguous business question, decide which tables to query, generate and run the query, validate the result, and present a visualization with commentary. Both are "AI for data analysis," but they solve very different problems.
How AI Data Analysis Differs From Traditional Analytics
Traditional analytics is built around anticipation. A data team decides in advance which questions matter, models the data to answer them, and ships dashboards that report on those predefined metrics. This works well until someone asks a question nobody anticipated, which is most questions.
AI data analysis flips the model. Instead of pre-building every answer, the system interprets questions as they arrive and generates the analysis on demand. This is the core promise: analysis that adapts to the question rather than forcing the question to fit an existing dashboard.
The shift in one sentence: Traditional analytics answers the questions you planned for; AI data analysis is meant to answer the questions you did not.
AI Data Analysis vs. an AI Data Analyst
People often use "AI data analysis" and "AI data analyst" interchangeably, but the distinction matters. AI data analysis is the broad activity. An AI data analyst is a specific product framing: a system designed to behave like a member of your analytics team, available around the clock, that receives a question, does the work, and returns an answer with its reasoning.
An AI data analyst is essentially the agent end of the spectrum wrapped in a persona. It does not just draw a chart when asked; it decides what to look at, checks its own output, and can handle follow-up questions in a continuing conversation. Whether a given tool deserves that label depends less on marketing and more on whether it can maintain accuracy on your real data, which is where most tools break down.
Why AI for Data Analysis Matters Now
The interest in AI for data analysis is not hype for its own sake. It is a response to a structural problem that has been building for a decade: the demand for answers has outpaced the supply of people who can produce them.
The Data Request Bottleneck
In most organizations, business stakeholders cannot get answers themselves. They file a request, it enters a queue, and they wait. The wait is often measured in days, and by the time the answer arrives, the decision has frequently already been made without it. Data has a short shelf life, and a slow answer is often no better than no answer.
The queue also tends to be full of repetition. A large share of incoming requests are variations on questions the team has already answered, rephrased or scoped slightly differently. Analysts end up spending their most valuable time re-running near-identical work instead of doing the deeper analysis that only a human can do. This is precisely the kind of repetitive, well-defined work that AI is suited to absorb.
The Cost of the 80/20 Problem
Underneath the queue is an even older issue, often described as the 80/20 rule of data work: analysts and data scientists spend far more of their time wrangling data than analyzing it. Estimates vary widely by methodology, with the honest range landing somewhere between 25% and 80% of working time spent finding, cleaning, and organizing data before analysis can even begin.
That drudgery has real cost. The same research notes that data quality problems are now a top operational concern, with more than a quarter of organizations estimating losses above USD 5 million per year from poor data quality alone. When you automate away even part of the preparation and repetitive querying, you free your most expensive people to focus on judgment, framing, and the questions that genuinely require expertise.
The market has noticed. Gartner predicts that by 2027, 75% of new analytics content will be generated or contextualized through generative AI. The direction is clear, even if the path is bumpy.
The Evolution: From Static Dashboards to Autonomous Agents
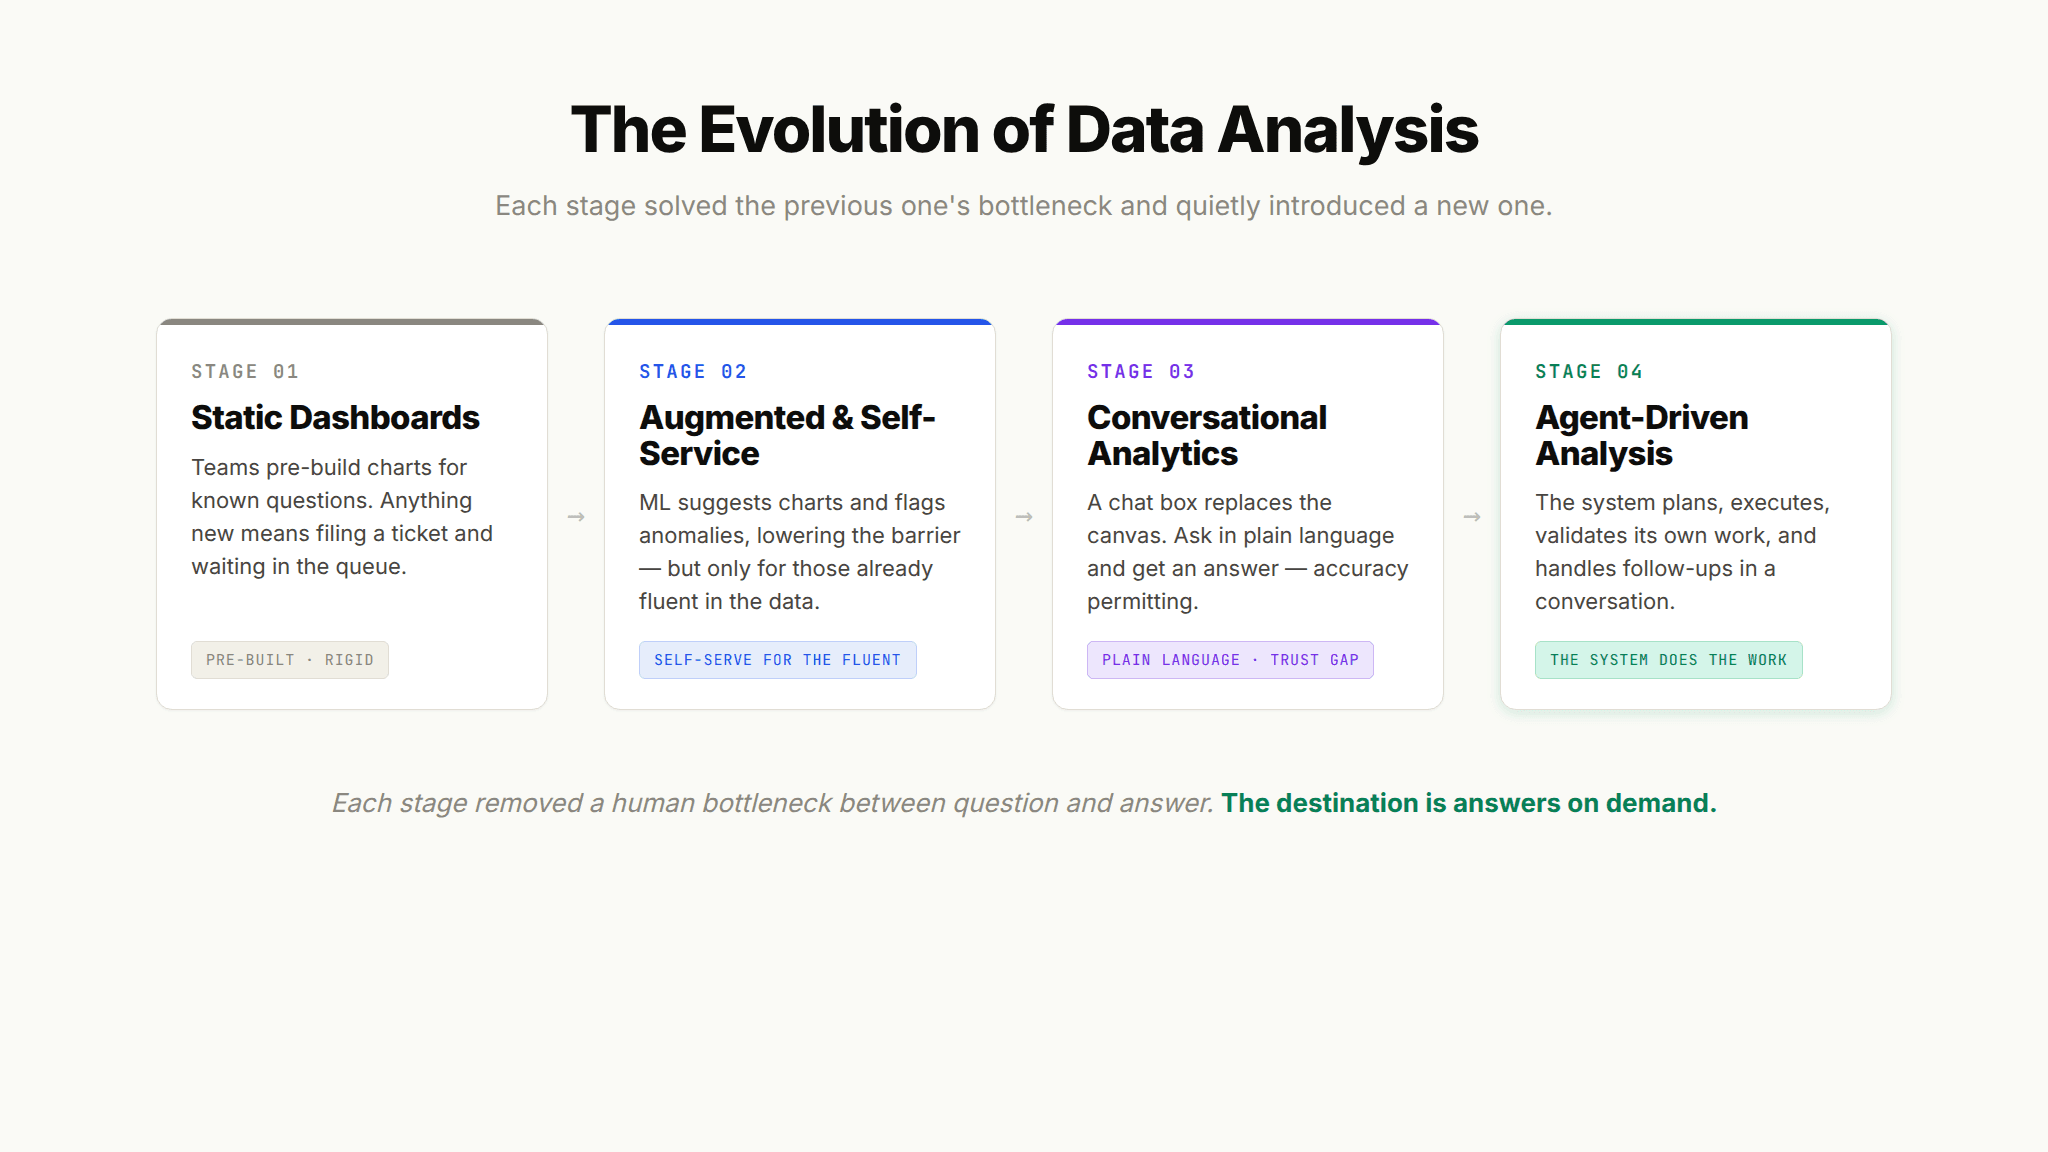
To understand where AI for data analysis is going, it helps to see it as four stages of a single evolution. Each stage tried to solve the limitations of the one before it, and each introduced a new limitation that the next stage would attempt to fix.
Stage 1: Static Dashboards and Scheduled Reports
The first era of self-service was the dashboard. A data team built a set of charts, connected them to live data, and handed them to the business. For known, recurring questions, dashboards were a genuine advance. Anyone could check last month's revenue without filing a ticket.
The limitation was rigidity. A dashboard can only answer the questions it was designed for. The moment someone wanted to slice the data a new way or ask a follow-up, they were back in the queue. Dashboards proliferated, and with them came dashboard sprawl, conflicting numbers, and a maintenance burden that grew faster than the value.
Stage 2: Augmented and Self-Service Analytics
The next wave, often called augmented analytics, layered machine learning onto BI tools. These systems could automatically highlight anomalies, suggest relevant charts, and lower the technical barrier so that more people could explore data on their own. This is where many mainstream platforms sit today, and where AI is reshaping data visualization by generating charts and formatting them intelligently.
Augmented analytics widened access, but it did not eliminate the expertise gap. Self-service works beautifully for people who already understand the data model and know which question to ask. For everyone else, a blank exploration canvas is intimidating rather than empowering. The promise was self-serve for all; the delivery was self-serve for the already-fluent.
Stage 3: Conversational Analytics
Conversational analytics replaced the canvas with a chat box. Instead of building a chart, you type a question in plain language and the system returns an answer. This is the interface most people now associate with AI for data analysis, and it represents a real leap in accessibility.
The catch is accuracy. A conversational tool can produce a confident, well-formatted answer that is subtly or completely wrong, because interpreting a business question requires knowing what the terms mean in your specific context. When "active user" or "revenue" can be defined three different ways, natural language alone cannot resolve the ambiguity. The interface got easier; the underlying trust problem did not go away.
Stage 4: Agent-Driven Analysis
The current frontier is the analytics agent. Rather than responding to a single prompt, an agent can plan a multi-step analysis, execute it, check its own work against known-good references, handle follow-up questions, and even flag when it is uncertain. This is the capability that makes an "AI data analyst" plausible rather than aspirational.
Agents are also where the industry consensus is heading. Gartner's forecast that by 2027 half of business decisions will be augmented or automated by AI agents reflects a bet that autonomous, context-aware systems, not static dashboards or simple chatbots, are the destination. Whether a given agent lives up to that bet depends almost entirely on how well it handles context, which we will return to.
The Main Categories of AI Tools for Data Analysis
Rather than review individual products, it is more useful to understand the categories, because most tools combine several of these capabilities and the right choice depends on your problem. Here are the five categories that make up the current landscape of AI tools for data analysis.
Automated Visualization and Auto-Charting
These tools take a dataset and generate appropriate charts automatically, often suggesting the best visualization type, formatting it cleanly, and highlighting notable patterns. They shine when you have data in hand and want to see it quickly without manual chart building. Their limitation is that they visualize what you point them at; they do not decide what is worth looking at.
Conversational Query Interfaces
This category lets users ask questions in natural language and receive answers, tables, or charts in response. It is the most visible face of AI for data analysis and the most intuitive for non-technical users. The strength is accessibility. The weakness, as noted, is that answer quality depends heavily on how well the tool understands your business definitions.
AI Dashboard Builders
Instead of assembling dashboards by hand, these tools let you describe what you want to see and generate the layout for you. The most advanced versions produce an agentic dashboard, where a user describes the charts they need and the system builds them dynamically. If you want to go deeper on this, our guide to building an AI dashboard without writing code walks through how the no-code and agent-driven approaches differ.
AI Data Analyst Agents
These are the systems that aim to replicate an analyst's full workflow: understand the question, retrieve context, generate and validate the analysis, and respond conversationally. They are the most powerful category and the hardest to get right, because full autonomy magnifies the cost of any context gap. This is the category that determines whether AI for data analysis becomes a genuine team member or an impressive demo.
AI Reporting and Insight Generation
This category automates the production of reports and proactively surfaces insights, moving from "answer my question" to "tell me what I should know." Instead of waiting for someone to ask, these tools monitor data and push notable changes. The evolution here mirrors the broader story: from scheduled static reports toward agent-generated, on-demand insight.
Tool Category | What It Does Best | Primary User | Key Limitation |
|---|---|---|---|
Automated visualization | Instant charts from a dataset | Analysts, business users | Visualizes what you point it at, does not decide what matters |
Conversational query | Plain-language questions and answers | Non-technical stakeholders | Accuracy depends on business context |
AI dashboard builder | Describe-and-generate dashboards | Business users, product teams | Needs governed definitions to stay consistent |
AI data analyst agent | Full analytical workflow, autonomously | Whole organization | Context gaps become accuracy failures |
AI reporting and insights | Proactive, automated reporting | Executives, operators | Signal-to-noise depends on relevance tuning |
For a broader look at how these categories are reshaping business intelligence as a whole, see our overview of the wider shift toward AI analytics.
How AI Data Analysis Works: The Workflow
Under the surface, most AI data analysis tools follow a similar sequence. Understanding the workflow helps you see where quality is won or lost.
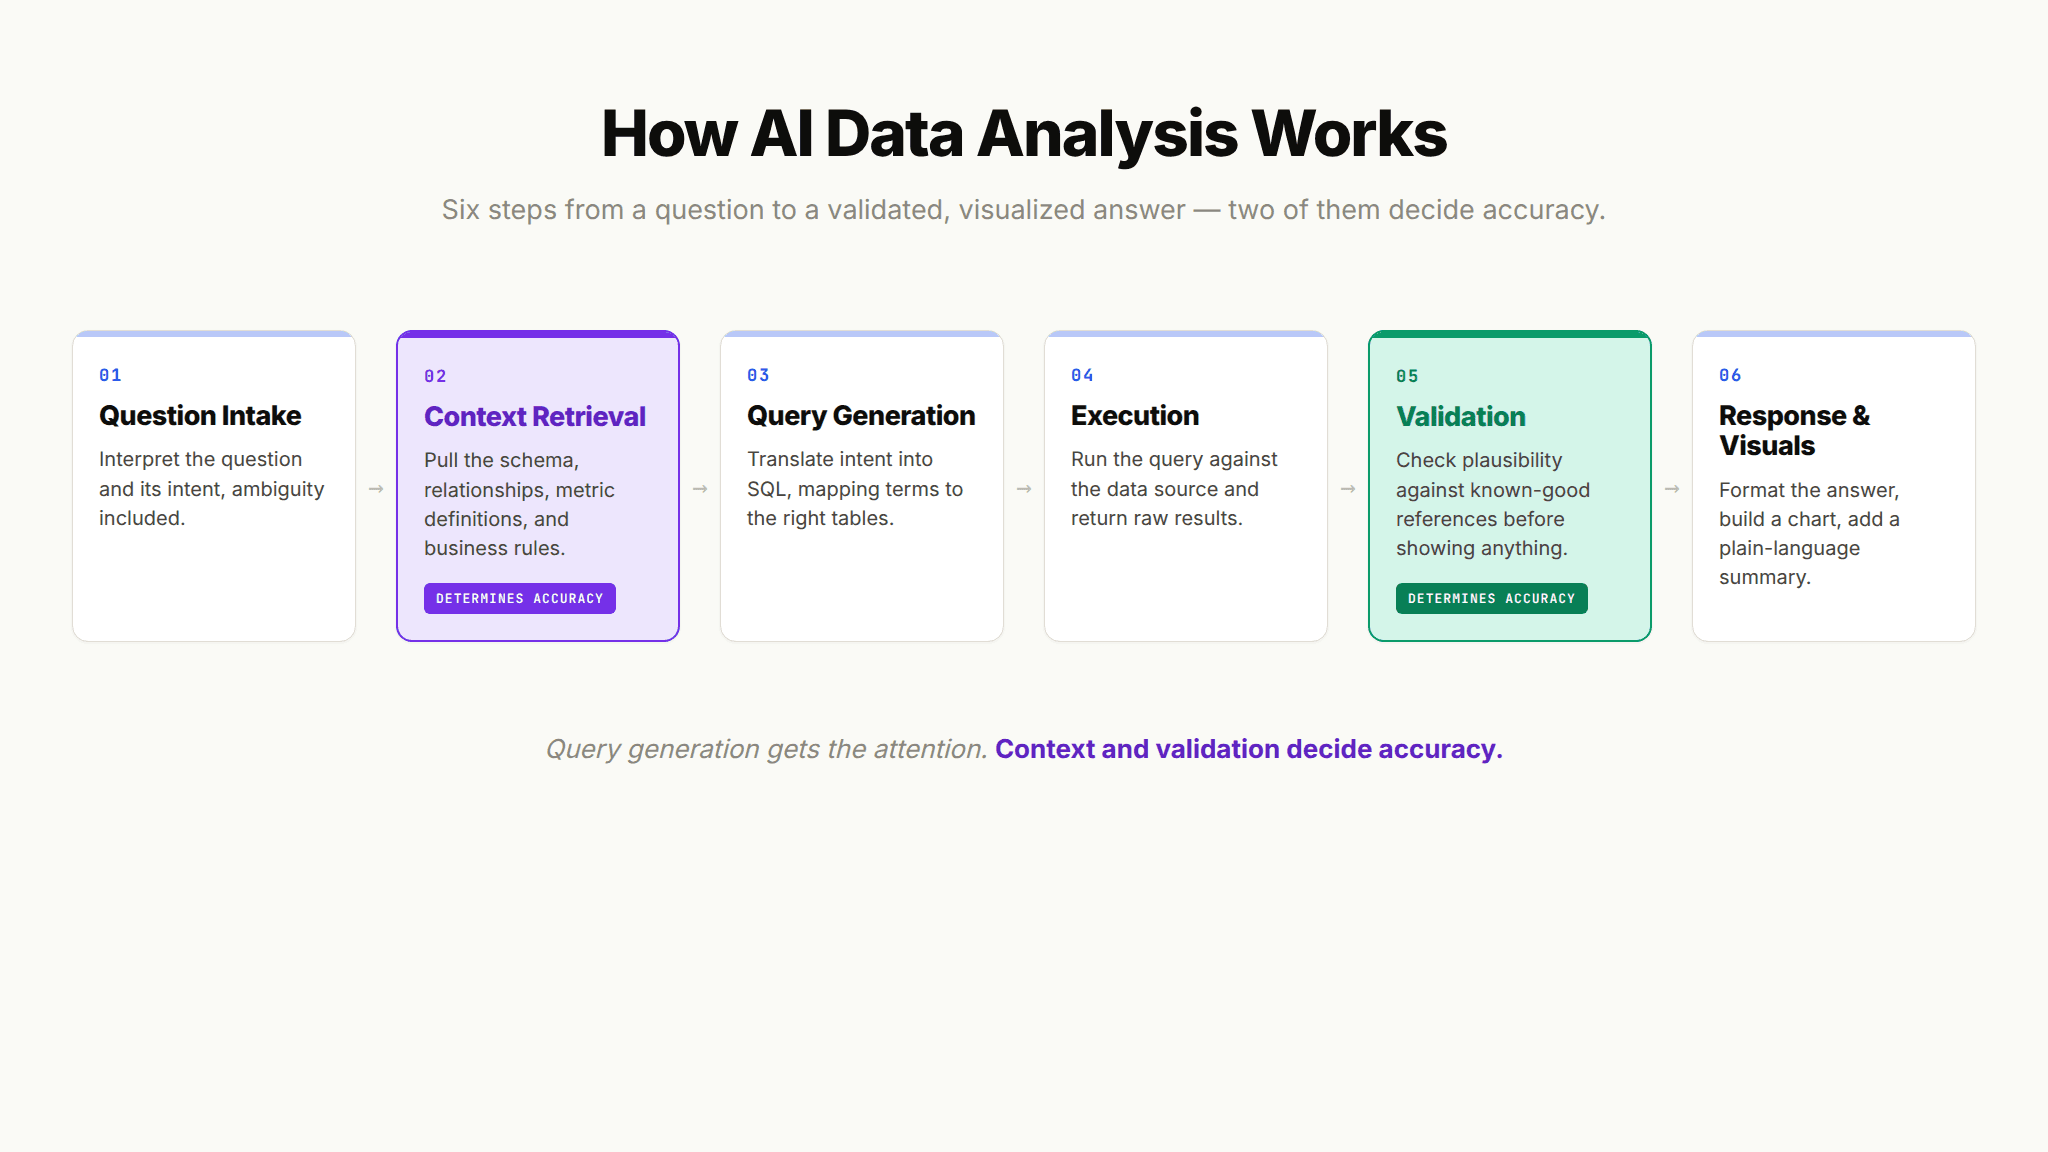
Question intake. The system receives a question, either typed in natural language or triggered automatically. The first job is to understand intent, including any ambiguity in the phrasing.
Context retrieval. The system gathers what it needs to answer correctly: the schema, table relationships, metric definitions, and business rules. This step is invisible to the user and decisive for accuracy.
Query generation. The system translates the interpreted question into a query, typically SQL, mapping business terms to the right tables and columns.
Execution. The query runs against the data source, returning raw results.
Validation. Stronger systems check the result for plausibility, compare it against known-good references, and catch obvious errors before showing anything to the user.
Response and visualization. The system formats the answer, chooses or builds an appropriate chart, and often adds a plain-language summary. In a conversational tool, it stays ready for the follow-up.
The steps most people focus on are query generation and visualization, because those are visible. The steps that actually determine whether the answer is trustworthy are context retrieval and validation, which are largely hidden. That gap between what looks impressive and what makes something reliable is the single most important thing to understand about this technology.
Techniques That Power AI Data Analysis
A handful of underlying techniques do most of the heavy lifting across all these tools. You do not need to implement them, but knowing what they are helps you evaluate what a tool is really doing.
Natural Language to Query Translation
At the core of conversational and agentic tools is the ability to convert a plain-language question into a database query. Modern approaches use large language models to map intent to structured queries. The technique has advanced quickly, but raw translation accuracy plateaus without knowledge of what the business terms mean, which is why translation alone is necessary but not sufficient.
Automated Pattern and Anomaly Detection
Machine learning excels at spotting patterns and outliers that a human scanning a table would miss. Anomaly detection flags unusual movements, correlation analysis surfaces relationships, and trend detection highlights shifts over time. This is where AI genuinely sees things people do not, and it powers the proactive "here is what changed" style of insight.
Context Retrieval and Semantic Understanding
This is the technique that separates a demo from a production system. To answer correctly, the model needs access to more than the raw schema. It needs the semantic layer that defines what each metric means, which table is authoritative, and what business rules apply. Retrieving and applying that context is the difference between an answer that is technically valid SQL and an answer that is actually correct for your company.
What an AI Data Analyst Can and Can't Do
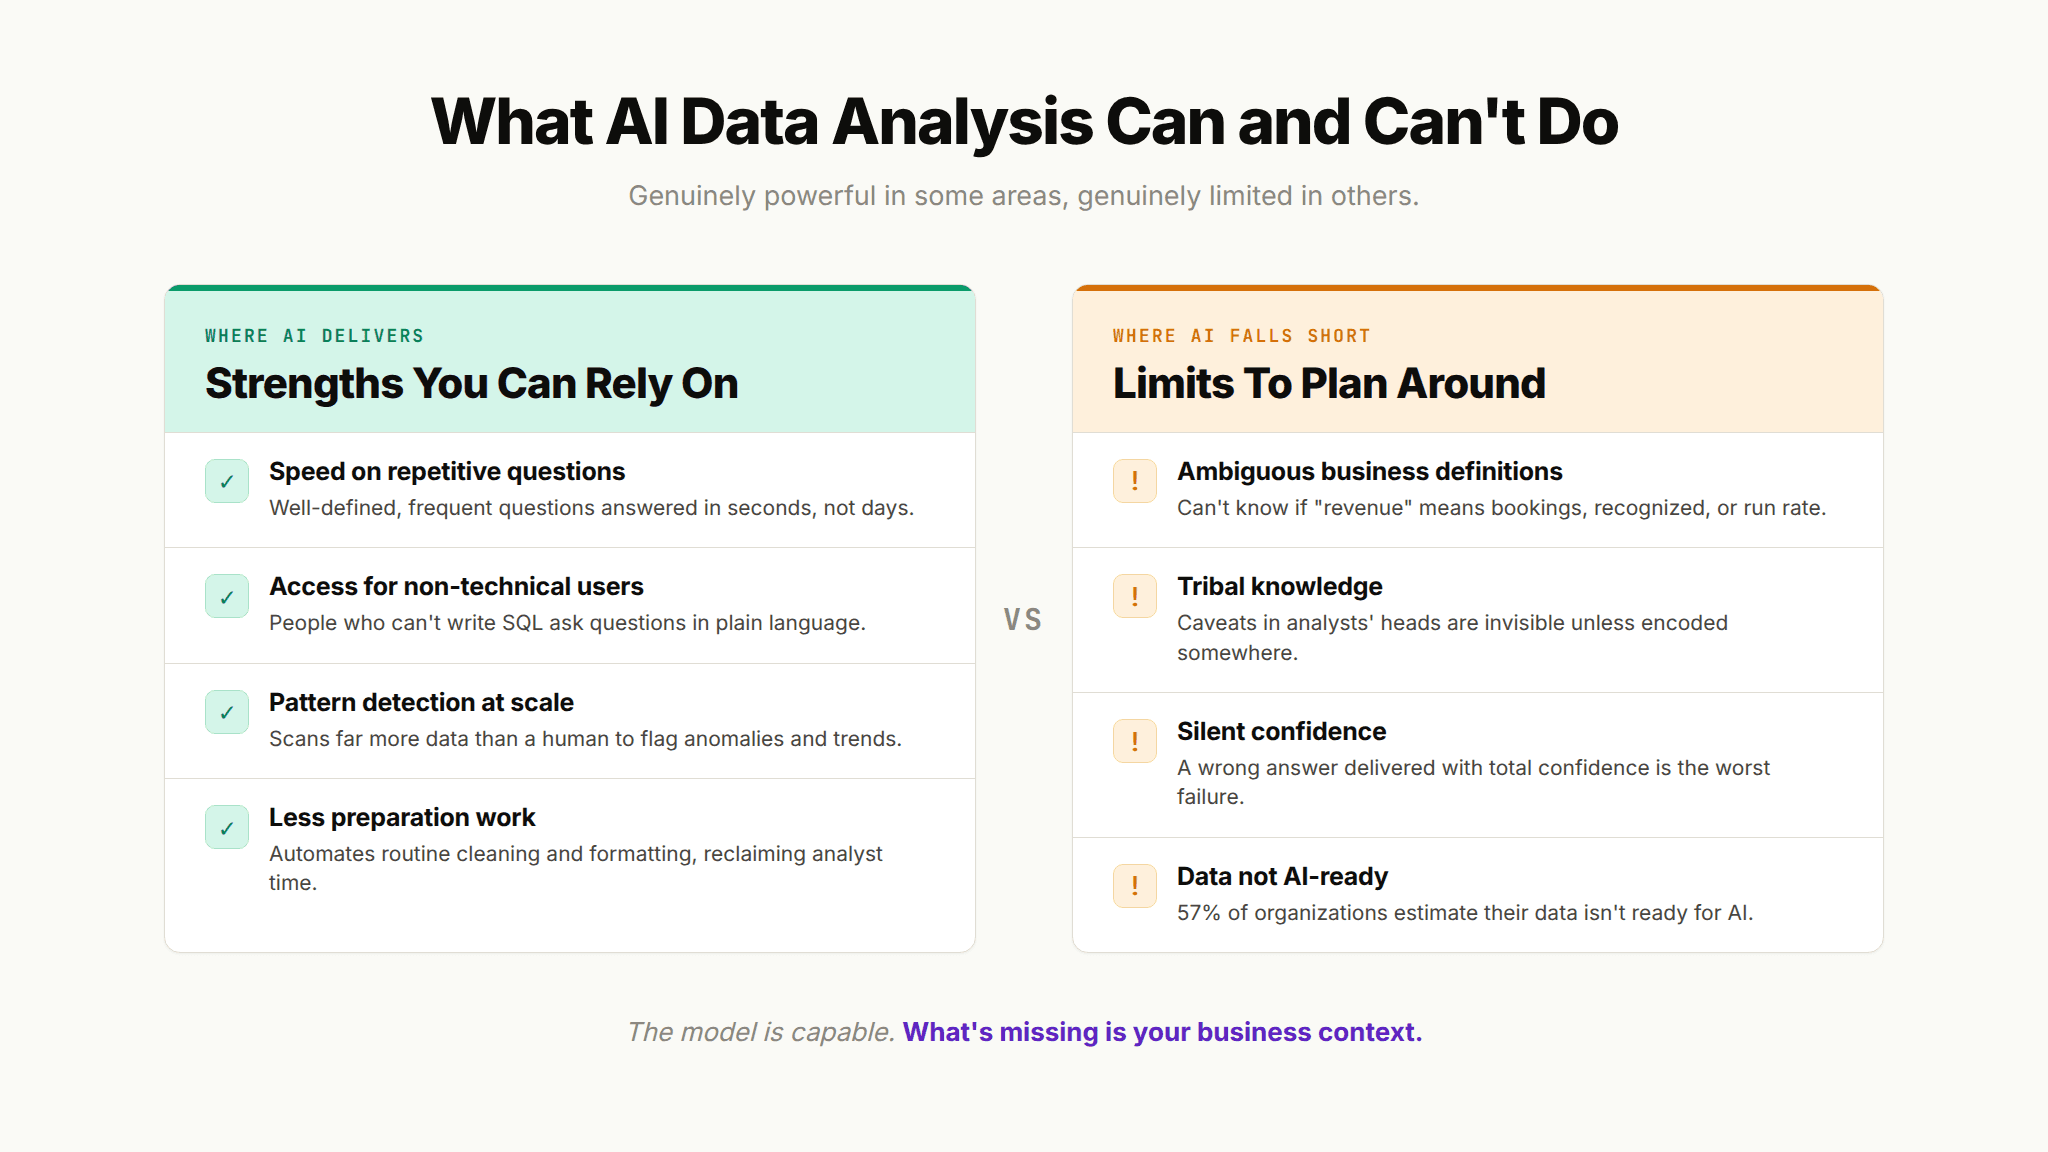
Honest expectations are the best defense against a failed rollout. AI for data analysis is genuinely powerful in some areas and genuinely limited in others, and pretending otherwise is how teams end up in the failed-pilot statistics.
Where AI Genuinely Delivers
Speed on repetitive questions. For the well-defined, frequently asked questions that clog the queue, AI can return answers in seconds instead of days.
Accessibility for non-technical users. People who could never write SQL can ask questions directly, which widens who gets to use data.
Pattern surfacing at scale. AI can scan far more data than a human and flag anomalies and trends worth a closer look.
Reducing preparation drudgery. Automating routine cleaning and formatting reclaims time from the 80/20 problem.
Consistent first drafts. For summaries, reports, and initial charts, AI produces a solid starting point that a human can refine.
Where AI Still Falls Short: The Context Problem
The limitations are not primarily about the model. They are about what the model does not know. The venture firm a16z put it bluntly in its analysis arguing that data agents are largely useless without the right context. The observation is echoed by hard numbers: MIT's research attributes the widespread failure of enterprise AI pilots not to weak models but to tools that cannot retain feedback, adapt to workflows, or apply organizational context.
Concretely, AI for data analysis still struggles with:
Ambiguous business definitions. If "revenue" can mean bookings, recognized revenue, or run rate, the model cannot pick correctly without being told which one your company means.
Tribal knowledge. The caveats that live in an analyst's head ("ignore test accounts," "the EU data lags by a day") are invisible to a model unless they have been encoded somewhere it can read.
Silent confidence. The most dangerous failure mode is a wrong answer delivered with total confidence. Without validation against known-good references, users cannot tell a good answer from a plausible-looking bad one.
AI-readiness of the underlying data. Gartner's 2025 research found that 57% of organizations estimate their data is not AI-ready, which caps how well any tool can perform on top of it.
The pattern across all of these is the same. The model is capable. What is missing is the institutional knowledge, the definitions, rules, and validated answers, that would let the model apply its capability correctly. That missing layer, and the discipline of encoding it systematically, is what serious teams are now focused on.
Where AI Data Analysis Rollouts Go Wrong
The teams that get the least out of AI for data analysis tend to fail in the same few ways, and each one is avoidable once you can see the pattern coming.
Judging a Tool by Its Demo
A demo runs on clean, curated data and questions the vendor already knows how to answer.
Production is messy, ambiguous, and full of edge cases the demo never touches, which is exactly where most agents fail once real users arrive. The tools that dazzle in a controlled walkthrough are often the ones that stumble in the field. Before you trust any pitch, run the tool against your own real data and your own awkward, real-world questions.
Treating Accuracy as a Model Problem
When answers come back wrong, the instinct is to blame the model or wait for a better one. The evidence points the other way: the failure is usually missing context rather than raw model capability, and a stronger model with no access to your definitions will simply guess more fluently. The work that actually moves accuracy is encoding your business context, the definitions, rules, and authoritative sources, so the model has something correct to reason from.
Shipping Answers Without Validation
A tool that returns answers with no way to verify them is really shipping confident guesses. In analytics that is dangerous, because a single high-confidence wrong answer erodes more trust than ten correct ones build. Favor tools that check their output against known-good references and can flag when they are uncertain, so a plausible-looking answer is never mistaken for a correct one.
How to Evaluate AI Tools for Data Analysis
When you move from understanding the category to actually choosing something, a consistent set of criteria helps. These are the questions worth asking of any AI tool for data analysis, regardless of vendor.
Context handling. How does the tool learn what your metrics mean, and can it apply your business rules? This is the single most predictive factor for accuracy.
Accuracy and validation. Can the tool check its own work, and can you test it against a set of verified answers?
Reliability at scale. Does performance hold up on messy, real-world questions, not just curated demos?
Deployment surface. Does it meet users where they already work, and can it be embedded where you need it?
Security and governance. Does the tool respect your existing access controls so users only see data they are authorized to see?
Because the destination for most of these evaluations is a platform decision, it is worth studying the criteria in depth. Our guide on what to look for in AI agent builder platforms for analytics breaks down the evaluation framework for teams that have moved from curiosity to comparison.
The Bottleneck Has Moved From Queries to Context
The arc of AI for data analysis has been one long effort to remove the human bottleneck between a question and an answer, from dashboards that answered known questions, to conversational tools that lowered the barrier, to agents that can run the whole workflow. Each stage got closer to answers on demand, and each ran into the same wall: an AI system is only as good as the context it can apply.
The bottleneck did not disappear, it moved. It used to be the queue of requests waiting on a human; now it is the institutional knowledge waiting to be encoded so a machine can use it. The teams pulling ahead treat their business definitions, rules, and validated answers as infrastructure that AI can draw on, rather than knowledge trapped in people's heads.
When OpenAI documented building its own in-house data agent, the recurring lesson was that high-quality answers depend on rich, accurate context rather than model horsepower alone. To see the paradigm that puts this front and center, read our guide to the next evolution: agentic analytics, which explains what it takes for AI to move from impressive to genuinely reliable.
Frequently Asked Questions
What is AI for data analysis?
AI for data analysis is the use of artificial intelligence, mainly large language models and machine learning, to explore data, generate charts, answer questions in plain language, and surface insights without manual query writing. It ranges from tools that auto-generate a single chart to autonomous agents that run an entire analytical workflow. The common thread is reducing the manual effort between a question and a trustworthy answer.
What is the best AI tool for data analysis?
There is no single best tool, because the right choice depends on your problem. A team that needs quick charts from existing data has different needs than one that wants an autonomous AI data analyst answering questions across the organization. The more useful question is which category fits your use case, then which tool in that category handles your business context most reliably.
Can AI replace a data analyst?
Not entirely, and not soon. AI can absorb the repetitive, well-defined portion of an analyst's work, such as answering frequently asked questions and producing first-draft charts and reports. It still struggles with ambiguous definitions, tribal knowledge, and judgment calls. The realistic near-term outcome is augmentation: analysts spend less time on repetitive querying and more on the deeper work that requires human expertise.
How accurate is AI for data analysis?
Accuracy varies enormously and depends far more on context than on the model. A tool with access to your metric definitions, business rules, and validated reference answers can be highly accurate; one without that context will produce confident but frequently wrong results. This is why MIT found roughly 95% of enterprise AI pilots delivered no measurable impact, with poor context and adaptation cited as central causes.
Do I need to know SQL to use AI for data analysis?
No. The main appeal of conversational and agentic AI tools is that business users can ask questions in plain language and receive answers without writing any SQL. That said, someone on the team still benefits from understanding the data model, because setting up the business context that makes these tools accurate is a technical task even when using them is not.
How is AI data analysis different from traditional business intelligence?
Traditional business intelligence pre-builds dashboards for anticipated questions, so it excels at known, recurring reporting and struggles with novel questions. AI data analysis interprets questions as they arrive and generates the analysis on demand, which is meant to handle the unanticipated questions that make up most real requests. Many organizations now run both, using dashboards for standard reporting and AI for ad-hoc exploration.

Try Upsolve for Embedded Dashboards & AI Insights
Embed dashboards and AI insights directly into your product, with no heavy engineering required.
Fast setup
Built for SaaS products
30‑day free trial