
What AI analytics changes for business intelligence, where AI-native tools deliver today, and the gaps that still trip teams up.

Ka Ling Wu
Co-Founder & CEO, Upsolve AI
10 min

AI analytics is the use of artificial intelligence, including large language models, natural language processing, and machine reasoning, to automate the work of exploring data, generating insights, and answering business questions. It is reshaping business intelligence by shifting analytics from something you build (dashboards, reports, SQL queries) to something you simply ask for in plain language.
For most of the last two decades, getting an answer from your data meant filing a request, waiting for an analyst, and staring at a dashboard that answered yesterday's question. That model is breaking down. The tools people search for today (AI business intelligence, AI powered analytics, artificial intelligence analytics) all point to the same shift: the interface to data is becoming a conversation, and the analyst is becoming a system. This guide walks through what AI analytics actually is, how it evolved out of traditional BI, what it can and cannot do, and where the market is heading next.
Key Takeaways |
|---|
|
What Is AI Analytics?
AI analytics is the application of artificial intelligence to the analytics process itself. Instead of a person manually cleaning data, choosing a chart type, writing a query, and interpreting the result, AI handles those steps: understanding a plain-language question, translating it into a query, running it against your data, and returning an answer with context. The goal is not a prettier dashboard. The goal is to collapse the distance between a business question and a trustworthy answer.
It helps to separate AI analytics from the terms it often gets confused with. Business intelligence (BI) is the broader discipline of using data to inform decisions. AI analytics is what happens when AI is layered into that discipline to automate the reasoning, not just the reporting. Augmented analytics, a related term, describes AI-assisted features inside traditional BI platforms. Agentic analytics, the newest phase, describes systems that plan and execute multi-step analysis with limited human supervision.
Think of it like the difference between a calculator and a colleague. A calculator waits for you to input the right formula. A colleague understands what you are actually trying to figure out, asks a clarifying question if needed, pulls the relevant numbers, and tells you what they mean. AI analytics is the movement of data tools from the first category toward the second. For a deeper walkthrough of the tools, agents, and techniques involved, see our complete guide to AI for data analysis.
The Evolution of Business Intelligence: From Dashboards to Agents
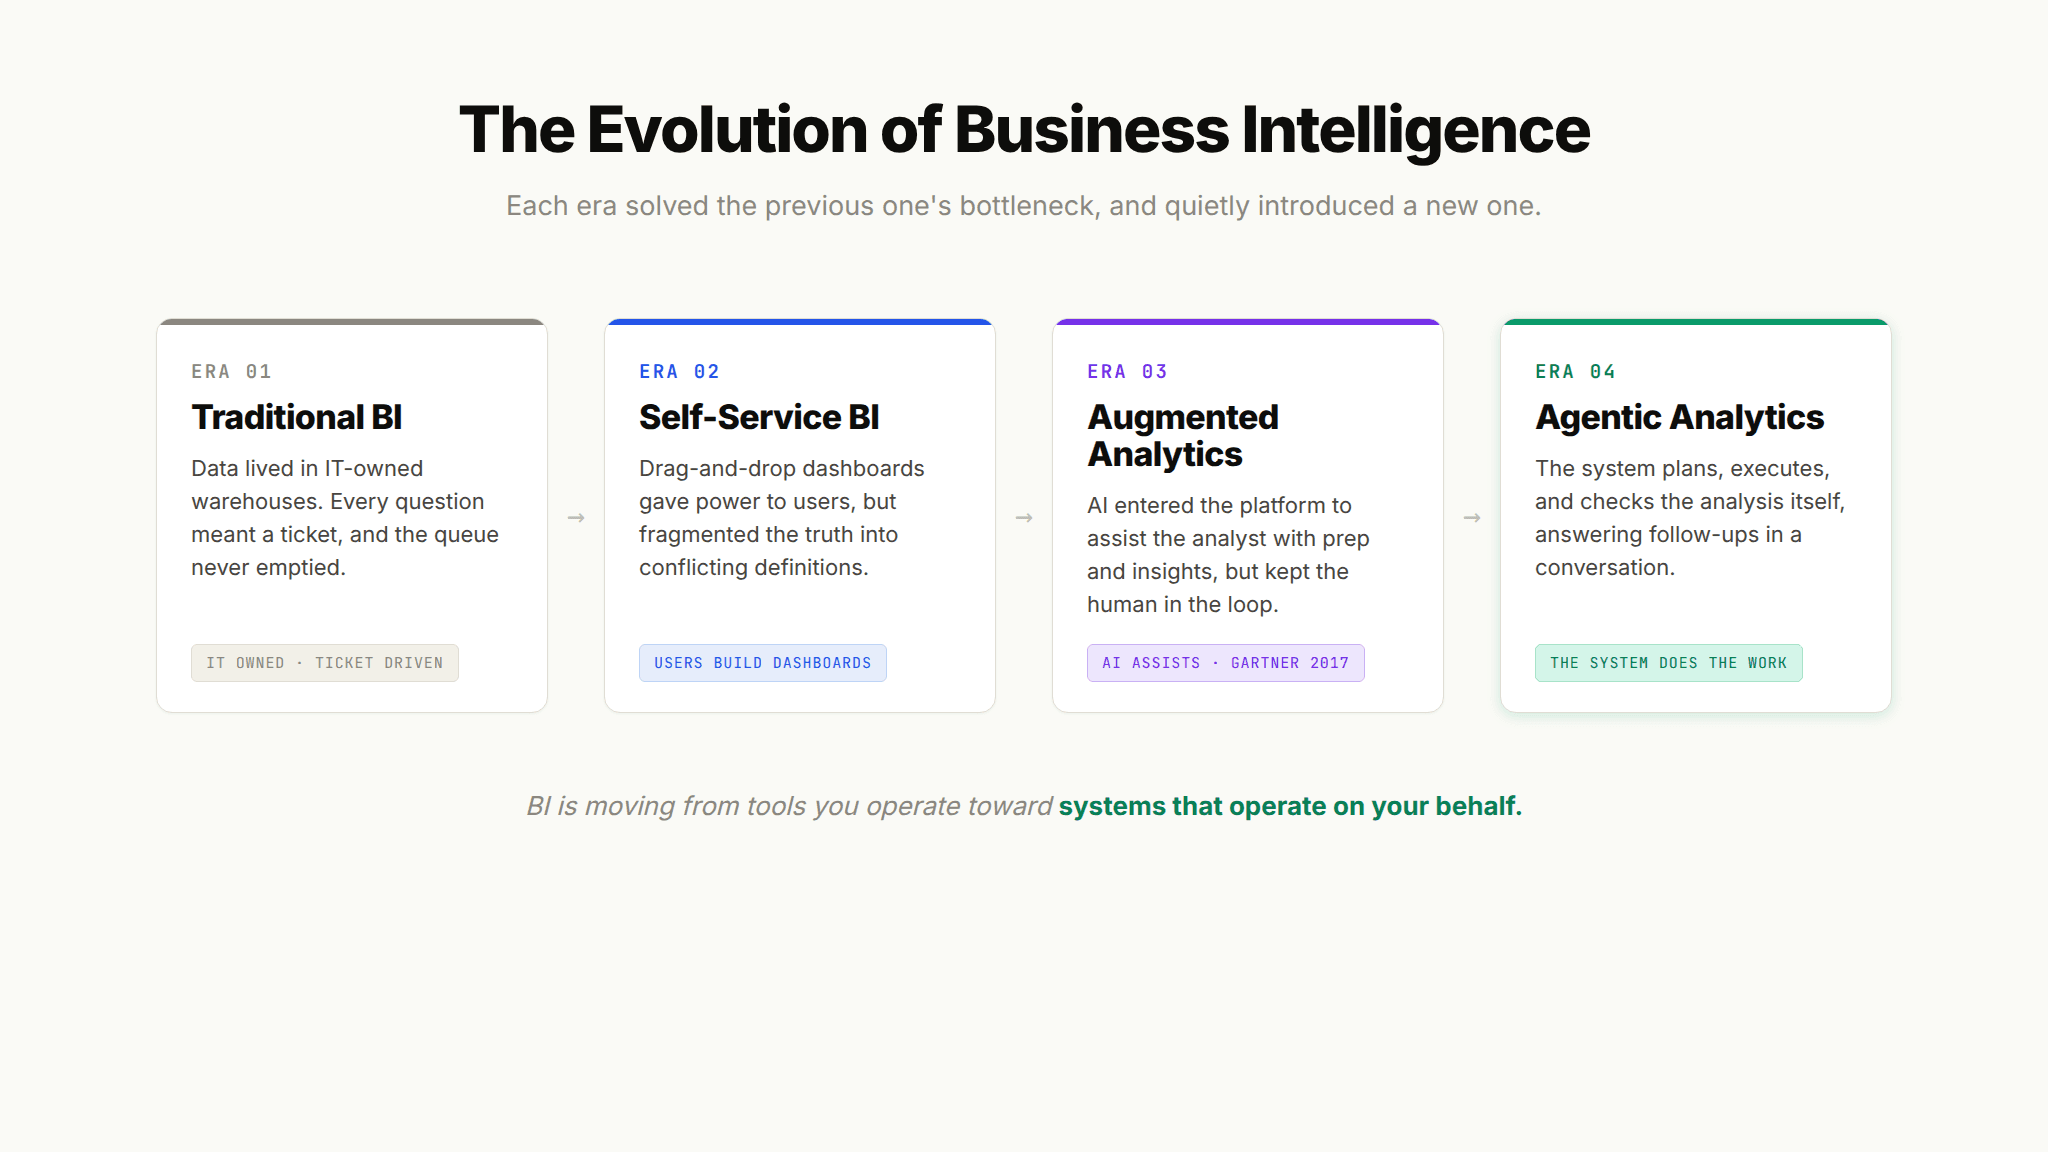
To understand where AI analytics is going, you have to understand what it is replacing. Business intelligence has moved through distinct generations, and each one solved the previous generation's biggest pain while quietly introducing a new one.
Traditional BI: The IT Bottleneck
The first era of modern BI was centralized. Data lived in warehouses controlled by IT, and business users depended on specialists to build reports. As one overview of the field notes, traditional BI tools were owned and operated by IT departments, leaving business users with few self-service options and little direct control over analysis. The upside was governance and consistency. The downside was speed. Every new question meant a new ticket, and the queue never emptied.
Self-Service BI: Power to the User, Complexity to the Org
The second era tried to fix the bottleneck by handing tools directly to business users. Drag-and-drop dashboards, self-serve data preparation, and smart visualization let people build their own reports without writing code. This worked, to a point. Dashboards multiplied. But self-service also fragmented the truth. When everyone can define "active user" or "revenue" their own way, you end up with a dozen conflicting dashboards and no agreement on which one is right.
Augmented Analytics: AI Enters the Platform
The third era introduced AI into the BI platform itself. Gartner coined the term "augmented analytics" in 2017 to describe the use of machine learning and AI to assist with data preparation, insight generation, and insight explanation. This is where natural language querying, automated chart recommendations, and anomaly detection first became mainstream features. Augmented analytics made analysts faster. What it did not do was remove the human from the loop; it assisted the expert rather than replacing the workflow.
Agentic Analytics: The System Does the Work
The newest phase moves beyond assistance. Instead of suggesting a chart, the system plans the analysis, executes it, checks its own output, and answers follow-up questions in a continuous conversation. This is the difference between a copilot that helps you fly and an autopilot that flies. We keep the deep definition in its own guide, so if you want the full picture of what comes next with agentic analytics, start there. For this article, the important point is directional: BI is moving from tools you operate toward systems that operate on your behalf.
Era | Who Does the Work | Interface | Core Limitation |
|---|---|---|---|
Traditional BI | IT and analysts | Static reports | Slow, ticket-driven |
Self-Service BI | Business users | Dashboards | Fragmented definitions |
Augmented Analytics | AI-assisted analysts | NL features in BI tools | Still human-in-the-loop |
Agentic Analytics | The system | Conversation | Requires deep context to be reliable |
How AI Analytics Works: The Core Capabilities
AI analytics is not one feature. It is a bundle of capabilities that together replace the manual steps of the traditional workflow. Understanding each one helps you evaluate what a given tool actually does versus what its marketing claims.
Natural Language Querying
The most visible capability is the ability to ask a question in plain English and get an answer. Under the hood, the system parses your intent, maps it to the right tables and fields, generates a query, and returns a result. When this works, the friction of analytics nearly disappears. The catch is that plain language is ambiguous. When you ask for "revenue last quarter," the system has to know which revenue definition your company uses and which fiscal calendar applies. Those are context problems, not language problems, and they are the reason natural language querying feels magical in a demo and brittle in production.
Automated Data Visualization
AI can now generate charts directly from a question or a dataset, choosing the right visualization type, formatting it, and even highlighting anomalies without being told where to look. This is a genuine shift from the manual work of configuring dimensions and picking chart types by hand. The frontier here is generative: describing the chart you want in words and having the system build it. For a closer look at how this is changing, see our breakdown of AI data visualization techniques.
AI-Generated Dashboards
Dashboards are not disappearing; they are becoming something you assemble by describing rather than by dragging. AI dashboard builders can generate layouts, auto-update visualizations, and adapt to the questions users actually ask. The result is a dashboard that behaves less like a fixed report and more like a living surface. If you want to see how this works step by step, our guide to building AI-powered dashboards covers the no-code and agent-driven approaches.
AI Reporting and Insight Generation
The final capability is reporting: turning data into narrative. AI can now draft summaries, flag what changed, and explain why a number moved, moving reporting from scheduled PDFs toward on-demand, agent-generated insight. Because data has a short half-life, a report that arrives three days late is often already irrelevant. Our overview of AI reporting tools traces this shift from manual reporting to insight that is generated the moment you need it.
The pattern to notice: Every one of these capabilities works beautifully in a demo and struggles in production for the same reason. The technology can generate a query, a chart, or a summary. What it cannot generate on its own is the institutional knowledge that makes the output correct for your specific business.
Why AI Analytics Matters Right Now
This is not a slow-moving trend. The pace and scale of investment make AI analytics one of the most consequential shifts in enterprise software today, and the reasons go beyond hype.
Adoption Is Already Near-Universal
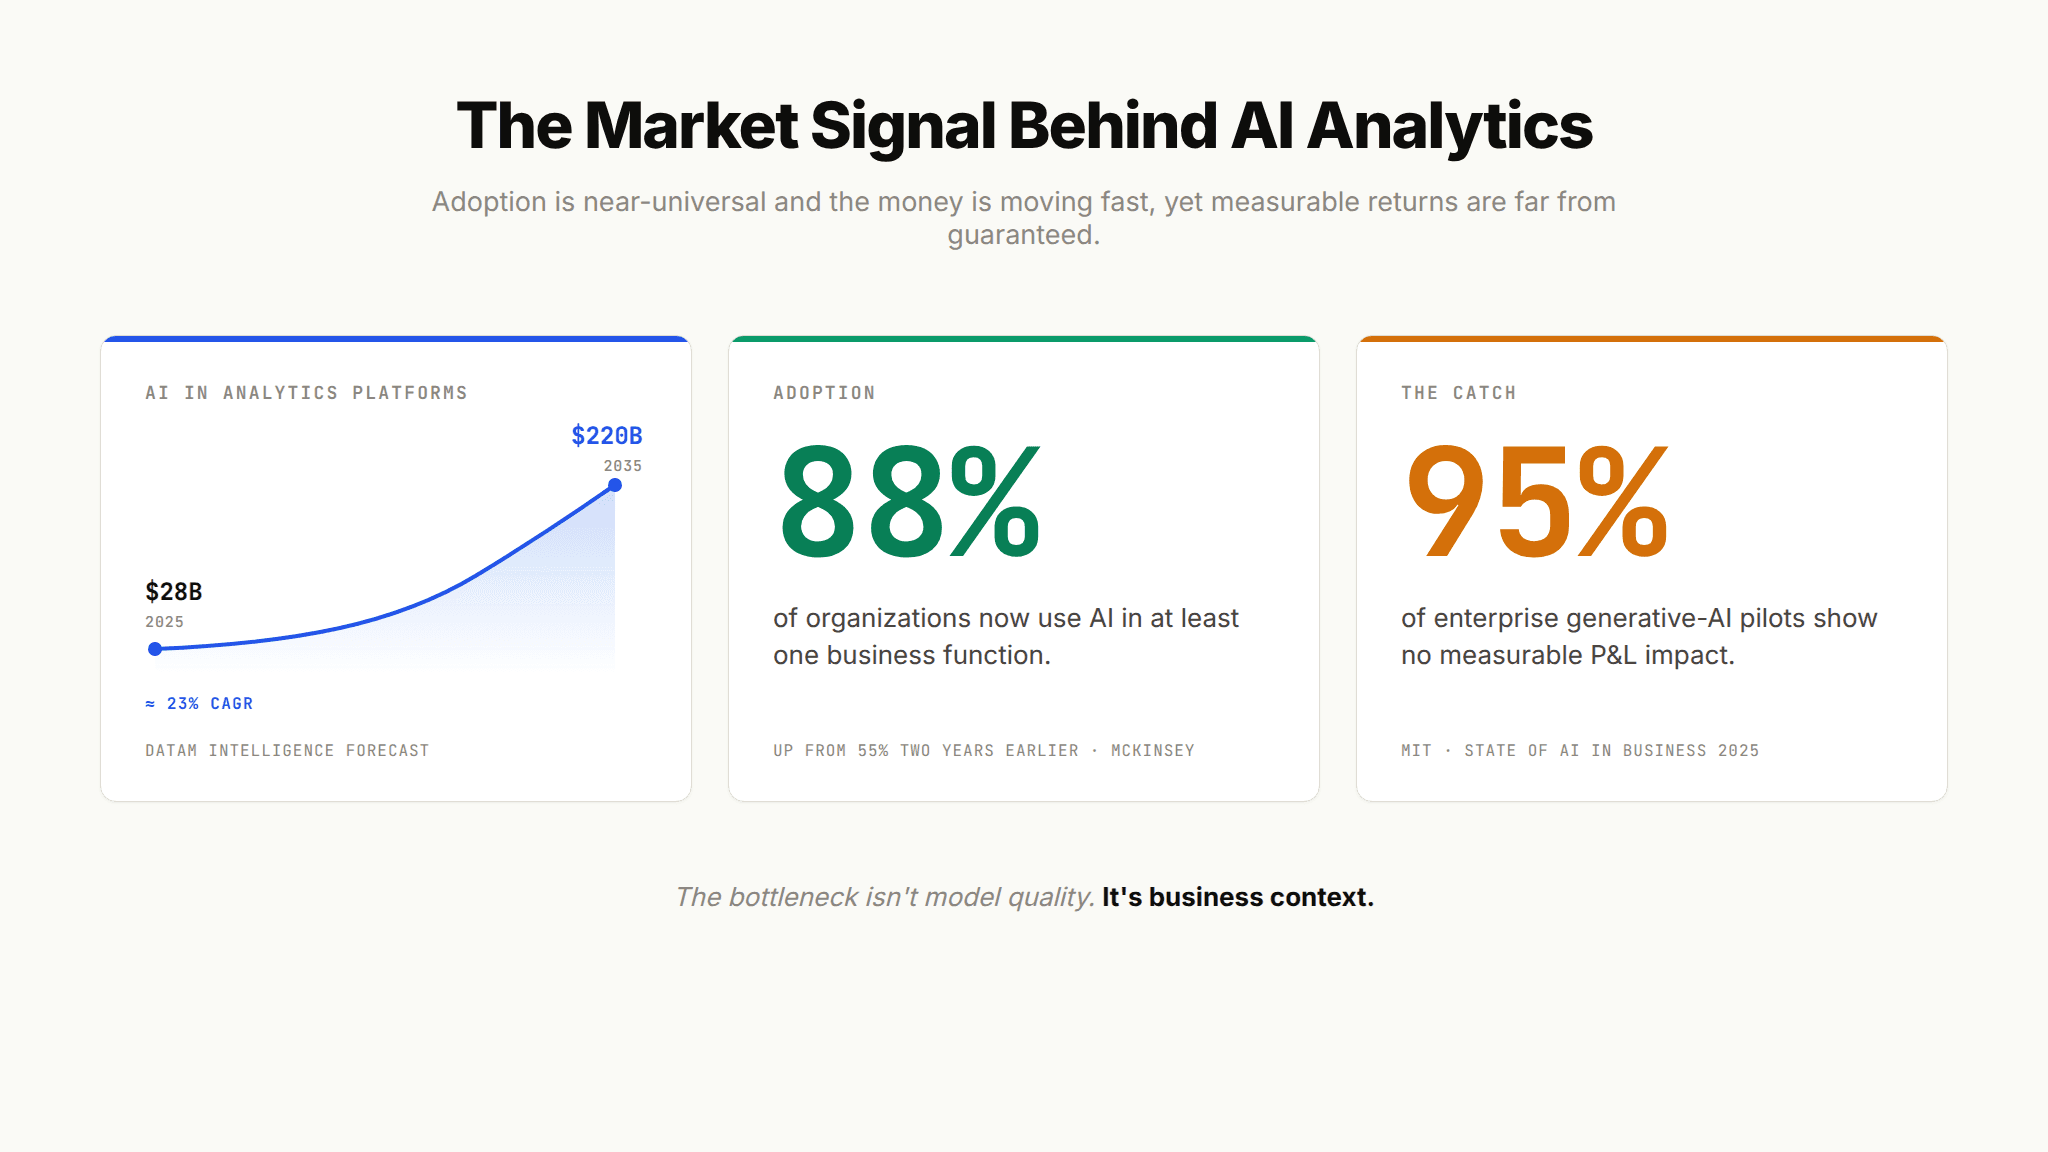
Start with adoption. According to McKinsey's State of AI research, roughly 88% of organizations report using AI in at least one business function, a jump from 55% just two years earlier. AI has moved from experimental budgets into core operational spending. Worldwide AI spending is forecast at roughly $2.59 trillion in 2026, up about 47% year over year, per Gartner. The question in most boardrooms has shifted from whether to adopt AI to how to make it deliver returns, which is a very different and much harder problem.
The Analytics Market Is Scaling Fast
The analytics slice of that market is growing especially fast. The broader AI market is on track to surpass $600 billion in revenue in 2026, and analytics is one of its highest-conviction segments. The AI-in-analytics-platforms market reached about $28 billion in 2025 and is projected to hit $220 billion by 2035, a compound annual growth rate near 23%. The narrower generative-AI-in-analytics segment is projected to grow from $1.6 billion in 2025 to $10.9 billion by 2033. Estimates differ by methodology, but the direction is unmistakable: analytics is one of the highest-conviction categories in the entire AI market, because every organization has data and every organization has more questions about it than it can currently answer.
The Signal From a16z and OpenAI
Two market signals are worth calling out because they reframe the whole conversation. In March 2026, the venture firm a16z published an influential piece arguing that data and analytics agents are essentially useless without the right context. Around the same time, OpenAI documented its own internal data agent, built by two engineers, now serving more than 3,500 users across 600 petabytes and 70,000 datasets and saving analysts hours per query.
Both point to the same lesson from opposite ends of the market, one from the investors funding the category and one from the lab building frontier models: the value is not in the model. It is in how well the system understands the business it is analyzing.
The reframing: When the company that makes the best models tells you that model quality is not the bottleneck, it is worth listening. The hard part of AI analytics is not the intelligence. It is the institutional knowledge the intelligence needs to be right.
Gartner projects that 40% of enterprise applications will include task-specific AI agents by the end of 2026, up from less than 5% in 2025. AI analytics matters now because the window to get it right is closing, and the organizations that treat it as a strategic capability rather than a feature checkbox are the ones pulling ahead.
AI Analytics in Practice: What Changes Day to Day
The market numbers are abstract. What does AI analytics actually change for the people who work with data? The answer is that it changes the shape of the workday for two very different groups.
For the Business User: Access Without the Wait
For the business user, the change is access. Instead of filing a request and waiting, they ask a question and get an answer while the thought is still fresh. Finance can check margin by segment without pinging the data team. Sales can see pipeline movement without opening a ticket. A product manager can validate a hunch before the standup instead of after it. The bottleneck that defined self-service BI, the gap between having a question and getting it answered, starts to close. That gap is not a minor inconvenience; a decision delayed three days is often a decision made on instinct instead of data.
For the Data Team: Leverage Instead of Overload
For the data team, the change is leverage. A large share of analyst time goes to answering the same questions over and over. Repeat requests clog the queue while the interesting, high-value work waits. When AI analytics handles the routine questions reliably, analysts get to spend their time on the problems that actually require judgment: designing metrics, investigating anomalies, and building the models that move the business. The goal is not to replace the analyst. The goal is to stop spending a senior analyst's afternoon on a question that was already answered last Tuesday.
A useful way to frame it: AI analytics does not eliminate analysts any more than spreadsheets eliminated accountants. It removes the drudgery that was crowding out the work only a human can do.
Across Industries
The pattern holds across sectors. Financial services leads AI adoption at around 84%, driven by large datasets and clear return on investment, with technology and healthcare close behind. Retail teams use it to interrogate sales and inventory data in real time. SaaS companies use it to understand product usage without routing every question through analytics. Wherever there is a data team fielding more requests than it can handle, AI analytics has an obvious job to do.
Where AI Analytics Falls Short
Any guide to AI analytics has to spend real time on its failures, because the failure rate is high and the reasons are instructive. This is the section most vendor content skips.
The headline statistic is sobering. An MIT report, "The GenAI Divide: State of AI in Business 2025," found that about 95% of enterprise generative AI pilots delivered no measurable impact on profit and loss. Only around 5% achieved rapid returns. This is not a story about weak models. The report attributes the divide to a "learning gap": most tools cannot retain feedback, adapt to context, or improve over time, so they stall the moment they meet real workflows.
Look closely and a consistent set of failure modes appears:
The demo trap: A tool answers five polished questions in a sales meeting, then collapses in the field when it meets the messy reality of real data and real definitions.
Missing business context: The model does not know that "revenue" means annual recurring revenue at your company, or that one table is authoritative and another is deprecated. It guesses, and it guesses wrong.
No memory or feedback loop: When a user corrects the system, that correction is forgotten by the next question. The tool never gets smarter.
Definitions that live in people's heads: The knowledge that makes an answer correct often lives in Slack threads, tribal memory, and a metrics document last updated years ago. AI tools have no access to it.
The MIT research also found something practical about how organizations succeed: buying from specialized vendors and building genuine partnerships succeeded about 67% of the time, while internal builds succeeded only about a third as often. The lesson is not "never build." It is that succeeding requires solving the hard, unglamorous problem of context, and most quick pilots never even attempt it.
What Separates AI Analytics That Works From AI Analytics That Fails
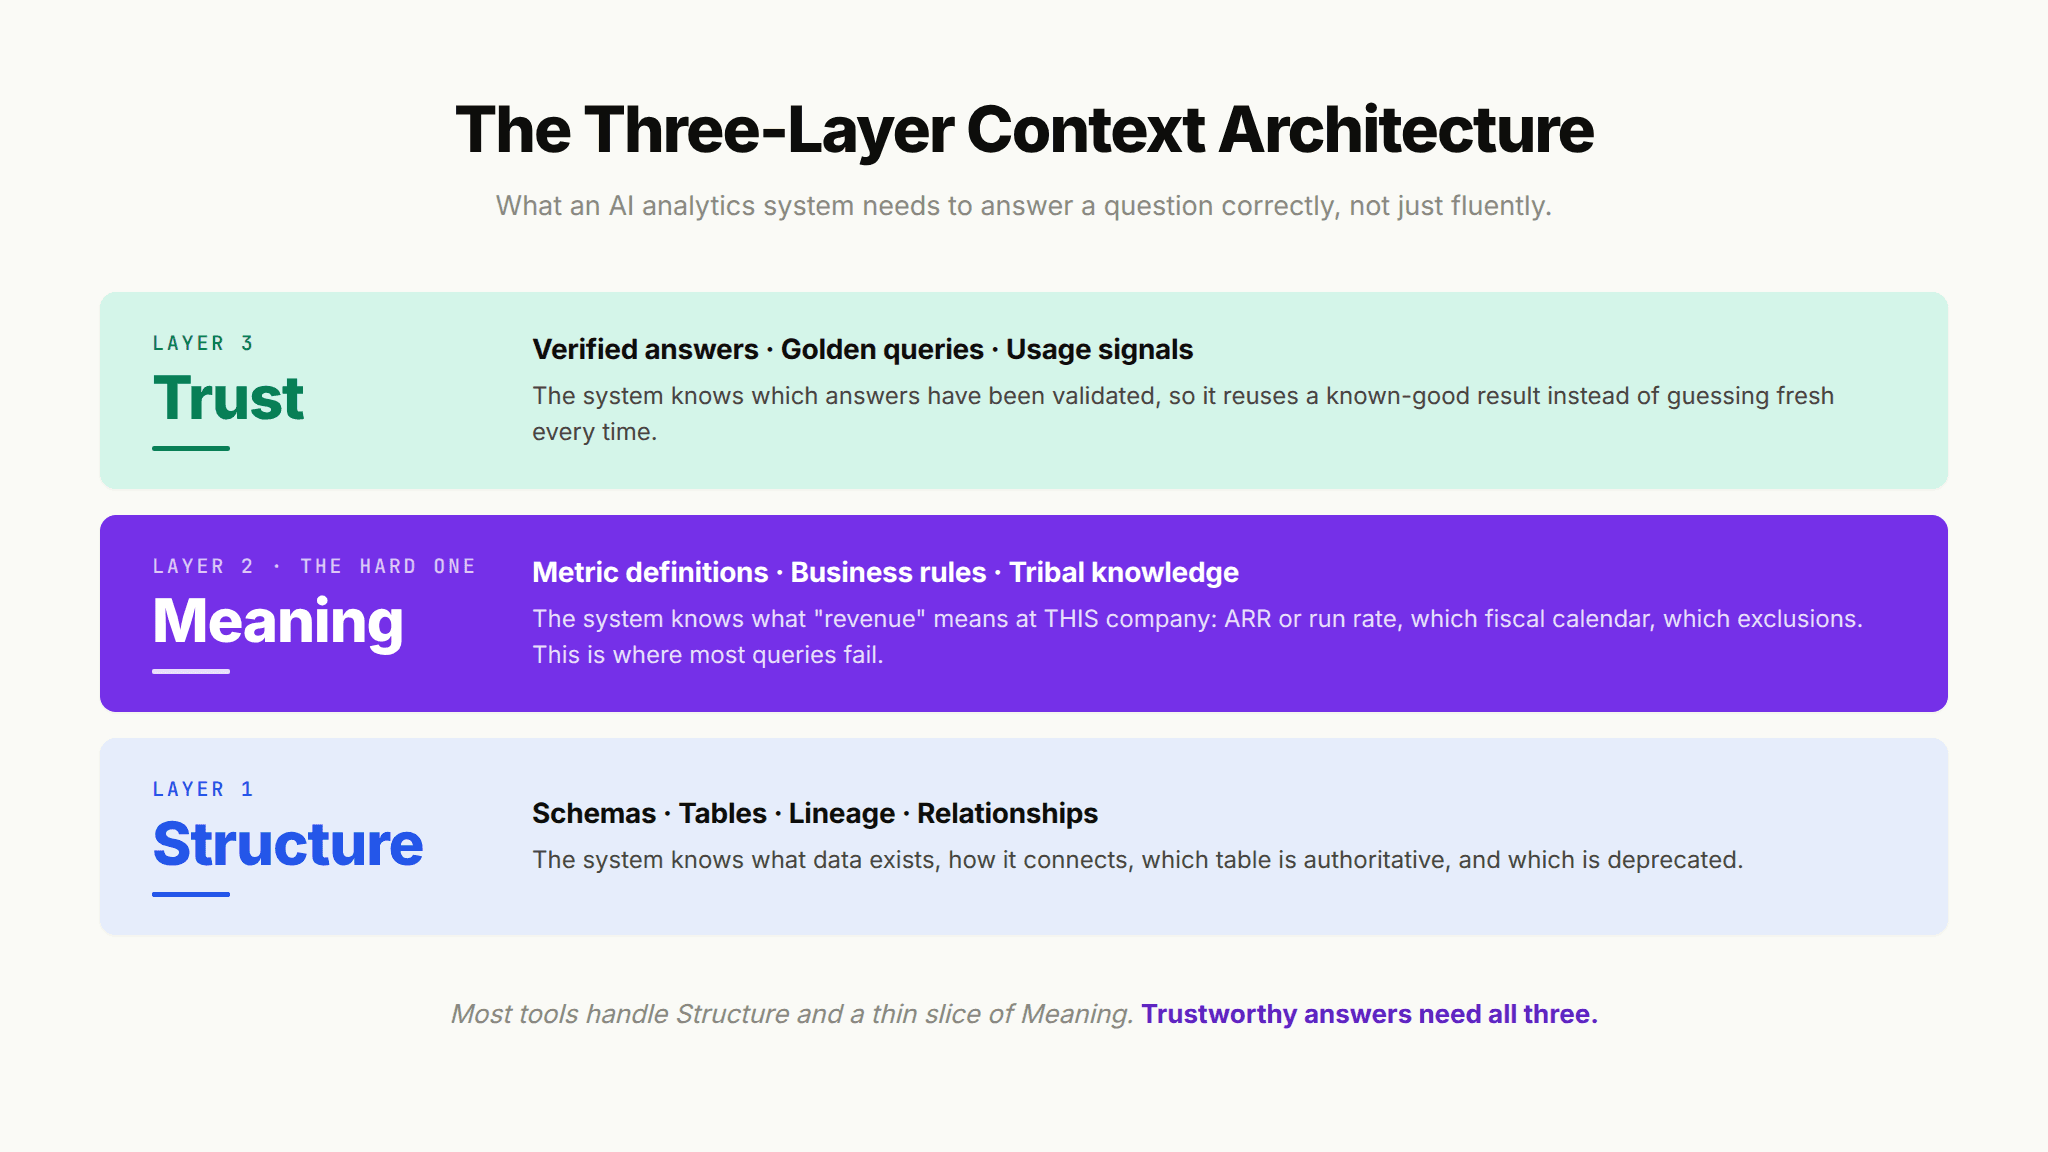
If model quality is not the differentiator, what is? The emerging consensus, echoed by a16z, OpenAI, and the MIT findings alike, is that reliable AI analytics depends on giving the system the same context a thoughtful human analyst carries in their head. That context tends to break into three layers.
Layer One: Structure
The first layer is structure: knowing what data exists, how tables relate, which sources are authoritative, and how the pieces connect. This is the map of the territory. Without it, the system does not know where to look, and it will happily query a deprecated table or join two datasets that were never meant to be joined. Structure is the layer most tools handle at least partially, because it can be read directly from the warehouse.
Layer Two: Meaning
The second layer is meaning: knowing what the data represents at your specific company. What "active customer" means when your product has a free tier. How a fiscal quarter is defined. Which business rules apply to a refund, a trial, or a churned account. This is the layer that turns a technically correct query into a genuinely correct answer, and it is where most tools quietly fail, because meaning lives in people's heads and in documents that AI cannot read on its own.
Layer Three: Trust
The third layer is trust: knowing which answers have been validated, which queries are golden, and where the system has been corrected before. Trust is what lets an answer be relied on rather than merely produced. It is the difference between a system that generates a plausible number and one that can tell you whether that number has been checked. This layer is the rarest of the three, and its absence is why so many tools cannot distinguish a validated answer from a confident hallucination.
Why this matters for evaluation: Most AI analytics tools solve one layer well and leave the others empty. A tool with great natural language but no meaning layer will confidently return the wrong number. A tool with strong structure but no trust layer cannot tell a validated answer from a hallucination. Reliability comes from covering all three, and that is the single most useful lens for comparing tools.
This is the intellectual heart of why so many deployments fail, and it is worth understanding in depth. The discipline of assembling and maintaining this context has a name, and our guide to context engineering for analytics breaks down how each layer is built and evaluated. When you are comparing AI analytics tools, the question underneath every feature demo is really: how well does this system understand my business, and how does it stay accurate as my business changes?
What People Get Wrong About AI Analytics
A few persistent myths shape how teams approach AI analytics, and each one leads to predictable disappointment.
1. A better model means better analytics.
The most common assumption, and the most expensive. As the market signals make clear, the frontier models are already good enough for most analytics tasks. The failures come from missing context, not missing intelligence. Swapping in a smarter model rarely fixes a deployment that stalled because the system did not understand the business.
2. AI analytics replaces the data team.
In practice, the opposite happens. AI analytics absorbs the repetitive questions and frees the data team to do higher-value work. The teams that succeed treat AI analytics as leverage for their analysts, not a substitute for them. Someone still has to encode the definitions, validate the answers, and maintain the context.
3. If the demo works, production will work.
The single most reliable predictor of failure. Demos run on curated questions and clean data. Production runs on ambiguous phrasing, messy tables, and edge cases nobody anticipated. A tool that is production-ready, not just demo-ready, has to cope with that complexity, and most do not.
4. AI analytics is a finished feature you can buy once.
Accurate AI analytics is a loop, not a purchase. It improves as it learns from real usage, real corrections, and real edge cases. Tools that treat it as a static feature plateau quickly; tools built around continuous improvement compound in accuracy over time.
The Bottom Line
AI analytics is the transformation of business intelligence from a set of tools you operate into a system that answers questions on your behalf. It has moved through traditional BI, self-service, and augmented analytics, and it is now entering an agentic phase where the system does the analytical work itself. The market is scaling rapidly, adoption is nearly universal, and yet most deployments still fail, not because the models are weak, but because they lack the business context to be trustworthy.
That single insight, that context is the deciding factor, is the thread running through every credible study of AI analytics right now. As you move from understanding the category to evaluating specific tools, the most useful question you can ask is not "how smart is the model?" but "how well does this system understand my business, and how does it stay accurate over time?" To go deeper on how modern platforms handle that question, explore what to look for in AI agent builder platforms for analytics.
Frequently Asked Questions
What is AI analytics?
AI analytics is the use of artificial intelligence to automate the analytics process: understanding a plain-language question, generating and running the query, and returning an explained answer. It differs from traditional BI, which requires a person to manually build reports, and it is the broader trend behind terms like AI business intelligence and AI powered analytics.
How is AI analytics different from traditional business intelligence?
Traditional BI is tool-based: a person builds dashboards and reports that answer questions defined in advance. AI analytics is system-based: you ask a question in natural language and the system does the work of finding and explaining the answer, including follow-up questions. Traditional BI answers what you anticipated; AI analytics aims to answer what you did not.
Is AI analytics accurate?
It can be, but accuracy depends far more on business context than on the underlying model. MIT research found that 95% of enterprise generative AI pilots failed to deliver measurable impact, largely because the systems lacked the context to interpret data correctly. Tools that encode structure, meaning, and trust produce reliable answers; tools that skip that work produce confident but wrong ones.
How much does AI analytics cost?
Cost varies widely by deployment model, from per-seat pricing on packaged tools to platform and infrastructure costs for custom builds. The more important cost consideration is total cost of ownership: internal builds often stall in pilot, and MIT found vendor partnerships succeed roughly twice as often as internal builds, which reframes the build-versus-buy math.
Will AI analytics replace data analysts?
No. AI analytics automates repetitive, high-volume questions and frees analysts to focus on complex, judgment-heavy work. Analysts also do the essential work of encoding definitions, validating answers, and maintaining the context that keeps the system accurate. The role shifts from answering the same questions repeatedly toward designing and governing the systems that answer them.
What is the difference between AI analytics and augmented analytics?
Augmented analytics, a term Gartner introduced in 2017, refers to AI-assisted features embedded inside a BI platform to help a human analyst work faster. AI analytics is the broader category, and its leading edge (agentic analytics) goes further by having the system plan and execute the analysis itself rather than just assisting the person doing it.

Try Upsolve for Embedded Dashboards & AI Insights
Embed dashboards and AI insights directly into your product, with no heavy engineering required.
Fast setup
Built for SaaS products
30‑day free trial