
A scheduled report is stale before you open it. How AI reporting tools surface insights the moment a decision calls for them.

Ka Ling Wu
Co-Founder & CEO, Upsolve AI
10 min

An AI reporting tool uses artificial intelligence to build, format, and interpret business reports, turning raw data into readable insight with little or no manual assembly. But the most useful AI reporting tool does more than speed up an old workflow: it changes what a report is, moving it from a static document you read on a schedule to a living answer you can question in the moment.
That shift matters more than it sounds. For most of the last two decades, a "report" meant a fixed artifact: a PDF, a slide, a dashboard refreshed overnight. The problem is that business questions do not arrive on a schedule, and the value of an answer decays fast. This guide walks through how reporting evolved from manual spreadsheets to agent-generated insight, why scheduled reports are increasingly obsolete, and what actually separates a genuinely useful AI reporting tool from a faster version of the same old thing.
Key Takeaways |
|---|
|
What Is an AI Reporting Tool?
An AI reporting tool is software that applies artificial intelligence, usually large language models, to generate reports from your data automatically. Instead of an analyst querying a database, cleaning the results, and pasting them into a template, the tool interprets a question or a goal, retrieves the relevant data, and produces a formatted answer: a chart, a written summary, a table, or a full narrative.
The category spans a wide range of maturity. At the simple end, an AI reporting tool auto-generates chart titles or writes a one-paragraph summary under a dashboard. At the advanced end, it behaves like an analyst: it receives a plain-language question, decides what data to pull, runs the analysis, checks the result, and delivers a trustworthy answer wherever you work. Understanding that spectrum is the difference between buying a cosmetic feature and buying a genuine change in how your team gets answers. For the broader landscape of these tools and techniques, see our complete guide to AI for data analysis.
Why Scheduled Reports Are Dead on Arrival
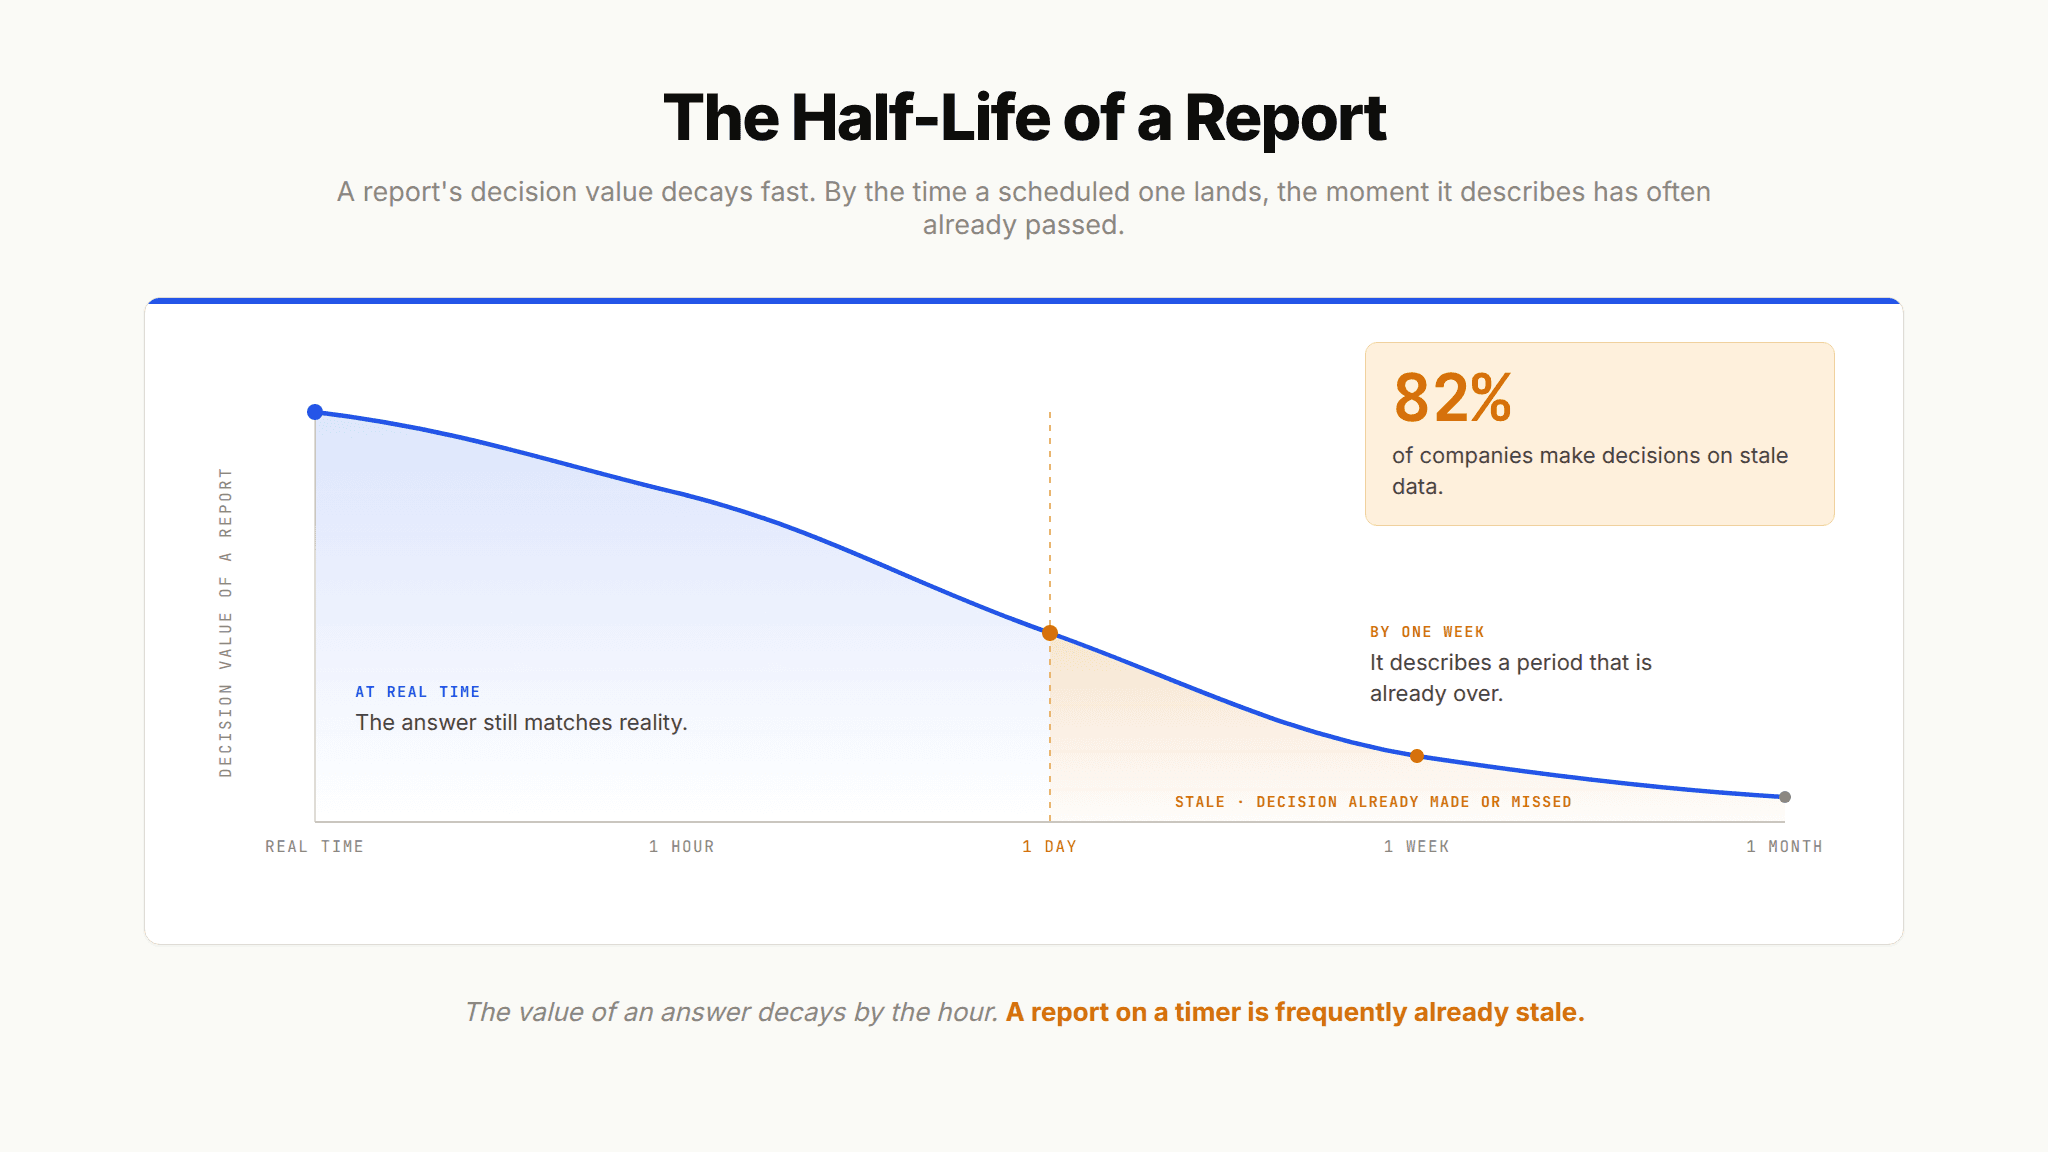
Here is the uncomfortable truth behind most reporting stacks: data has a short half-life, and a scheduled report is often stale the moment it lands in your inbox. A weekly revenue summary describes a week that is already over. A dashboard refreshed at midnight answers yesterday's question, not today's. By the time the report reaches a decision-maker, the world it describes has already moved.
The data on this is blunt. Research conducted for Fivetran found that 82% of companies make decisions based on stale information, and while 86% of respondents say they need real-time data to make smart decisions, only 23% have the systems in place to deliver it. That gap is expensive. Analysis of data freshness suggests organizations that improve it for operational decisions can see 10% to 20% gains in operational efficiency simply from acting on current reality instead of a dated snapshot.
The freshness problem is compounded by a human one. Even with modern BI platforms, analysts spend the majority of their time preparing and packaging rather than analyzing. IDC has estimated that less than 20% of an analyst's time is actually spent on analysis, with the rest going to searching, cleaning, and governing data. So the scheduled report is not just late; it is also the output of an expensive, repetitive assembly line.
Think of it like a newspaper printed once a day in a world that now runs on live feeds. The format was reasonable when producing a report was slow and costly. It is a poor fit when the underlying question is "what is happening right now, and what should I do about it?"
The Evolution of Reporting: Four Stages
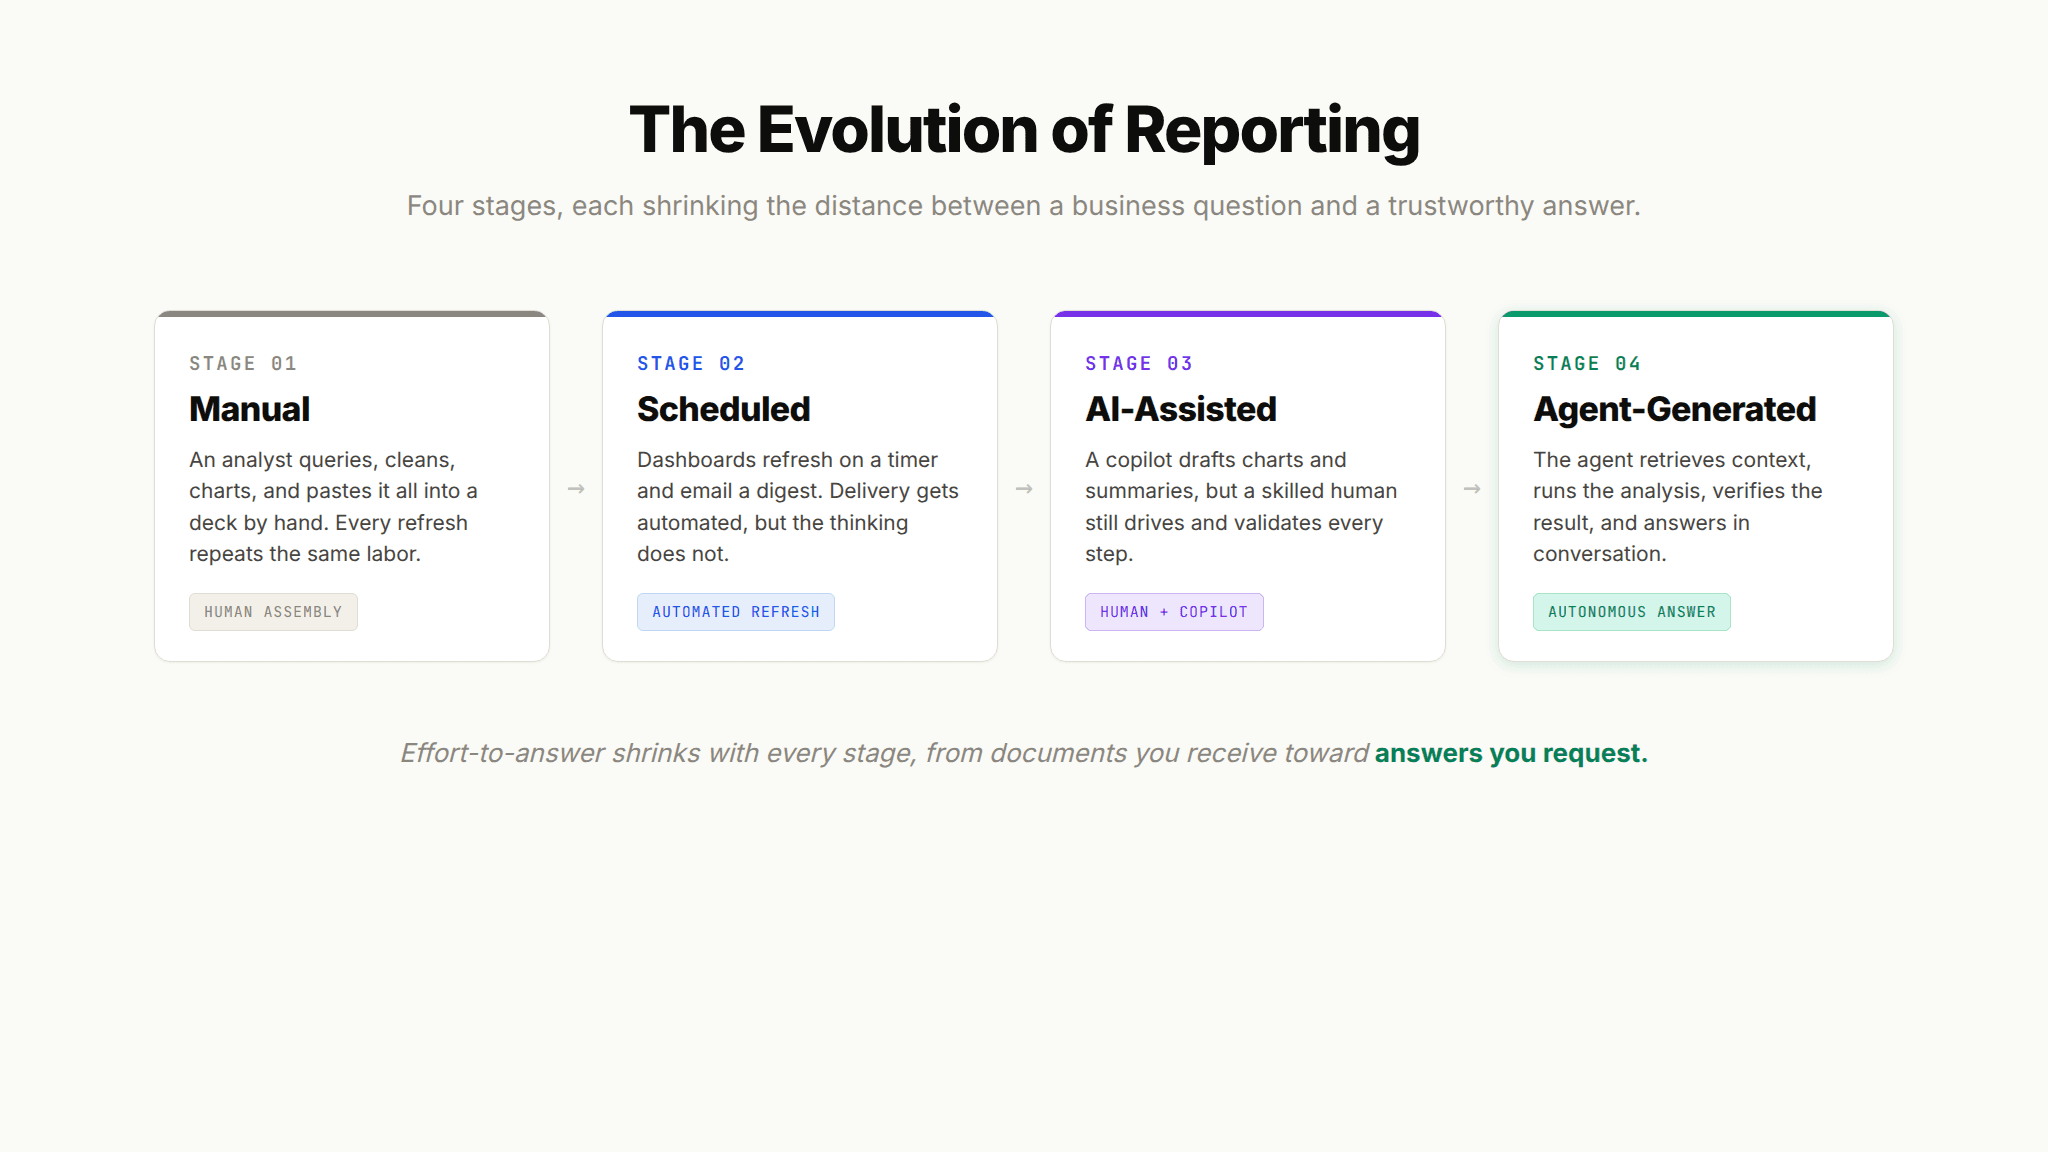
Reporting did not jump straight from spreadsheets to AI. It moved through four recognizable stages, and most organizations today are spread across all four at once: a manual month-end close here, a scheduled dashboard there, a new copilot bolted onto the BI tool. Seeing the stages clearly helps you locate where your team actually is and where the real leverage sits.
Stage 1: Manual Reporting
This is the origin story: an analyst runs a query, exports the results, cleans them in a spreadsheet, builds the charts, and pastes everything into a document or slide deck. The output is a PDF or a presentation, produced by hand, often monthly or quarterly.
Manual reporting is flexible and fully controlled, which is why it never fully disappears. But it is slow, expensive, and fragile. Every refresh is a repeat of the same labor, and a single change in a metric definition means redoing the work. This is the stage where the 60% to 80% time drain on manual reporting lives.
Stage 2: Scheduled Reporting
The first wave of automation attacked the repetition, not the intelligence. BI platforms let teams build a dashboard once and refresh it automatically, then email a digest on a cadence. This was a real improvement: fewer hours pasting charts, more consistency, a single place to look.
The catch is that scheduled reporting automates delivery, not thinking. The dashboard still only answers the questions someone anticipated when they built it. The moment a stakeholder asks a follow-up ("why did the West region dip, and is it the same accounts as last quarter?"), the automation stops and a human goes back to Stage 1. Scheduled reporting also inherits the freshness problem in full: a report on a timer is a report that is frequently out of date.
Stage 3: AI-Assisted Reporting
AI-assisted reporting introduces a copilot into the existing workflow. The human is still driving, but AI removes friction along the way: auto-generating a chart from a plain-language prompt, summarizing a dashboard in a sentence, suggesting the next breakdown, or drafting the narrative around the numbers. Adoption here is climbing fast: Deloitte's 2026 State of AI survey found that roughly two-thirds of organizations are now actively reshaping or redesigning core processes around AI, rather than just experimenting.
This is where a lot of tools sit today, and it is genuinely useful. But the word to hold onto is "assist." A copilot accelerates a person who already knows what to ask, how to validate the output, and what the numbers mean in context. It does not own the task. Remove the skilled human and the quality collapses, because the copilot has no independent way to know whether its answer is right.
Stage 4: Agent-Generated Reporting
The newest stage hands the work to an agent. Instead of assisting a human step by step, an analytics agent receives a question, retrieves the context it needs, generates the analysis, validates the result against known-good answers, and delivers it, often inside the same conversation. Reporting becomes less a document you receive and more an answer you request, then interrogate.
This is where reporting starts to merge with something bigger: proactive, self-driving analysis that surfaces insight before anyone asks. That broader shift, from scheduled reports to autonomous, self-driving insights, is its own topic, and it is the direction the whole category is heading. The critical caveat for Stage 4 is accuracy, which is where most agent projects fail. An agent that generates reports quickly but gets the numbers wrong is worse than no agent at all.
AI-Assisted vs Agent-Generated Reporting: What Actually Changes
The line between Stages 3 and 4 is the one most buyers get wrong, because vendors market both as "AI reporting." The practical difference is the difference between a tool that helps you work and a tool that does the work.
Dimension | AI-Assisted (Copilot) | Agent-Generated |
|---|---|---|
Who drives | The human, step by step | The agent, end to end |
Trigger | You prompt each action | You state a goal or question |
Validation | You check the output | The agent checks against verified answers |
Follow-up questions | You ask and re-run manually | Handled in the same conversation |
Fails when | The human is removed | The context is missing |
Best for | Speeding up skilled analysts | Scaling answers to non-analysts |
The pattern to notice: a copilot's ceiling is set by the person using it, while an agent's ceiling is set by the quality of its context. That single distinction determines whether an AI reporting tool actually reduces your team's workload or just makes each manual step slightly faster.
What to Look for in an AI Reporting Tool
Once you accept that agent-generated reporting is only as good as its context, the evaluation criteria change. You stop asking "how good is the model?" and start asking "how well does this tool understand my business?" That reframe is the whole game. As venture firm a16z put it, data and analytics agents are "essentially useless without the right context". Here is what that looks like in practice.
Context, Not Just Connectivity
Connecting to your warehouse is table stakes. Understanding it is not. A reliable AI reporting tool needs a place to encode institutional knowledge: how "revenue" is actually defined here, which table is authoritative, what the business rule says about this quarter, and what a careful analyst would flag before trusting a number. This is the difference between a tool that can read your data and one that understands it.
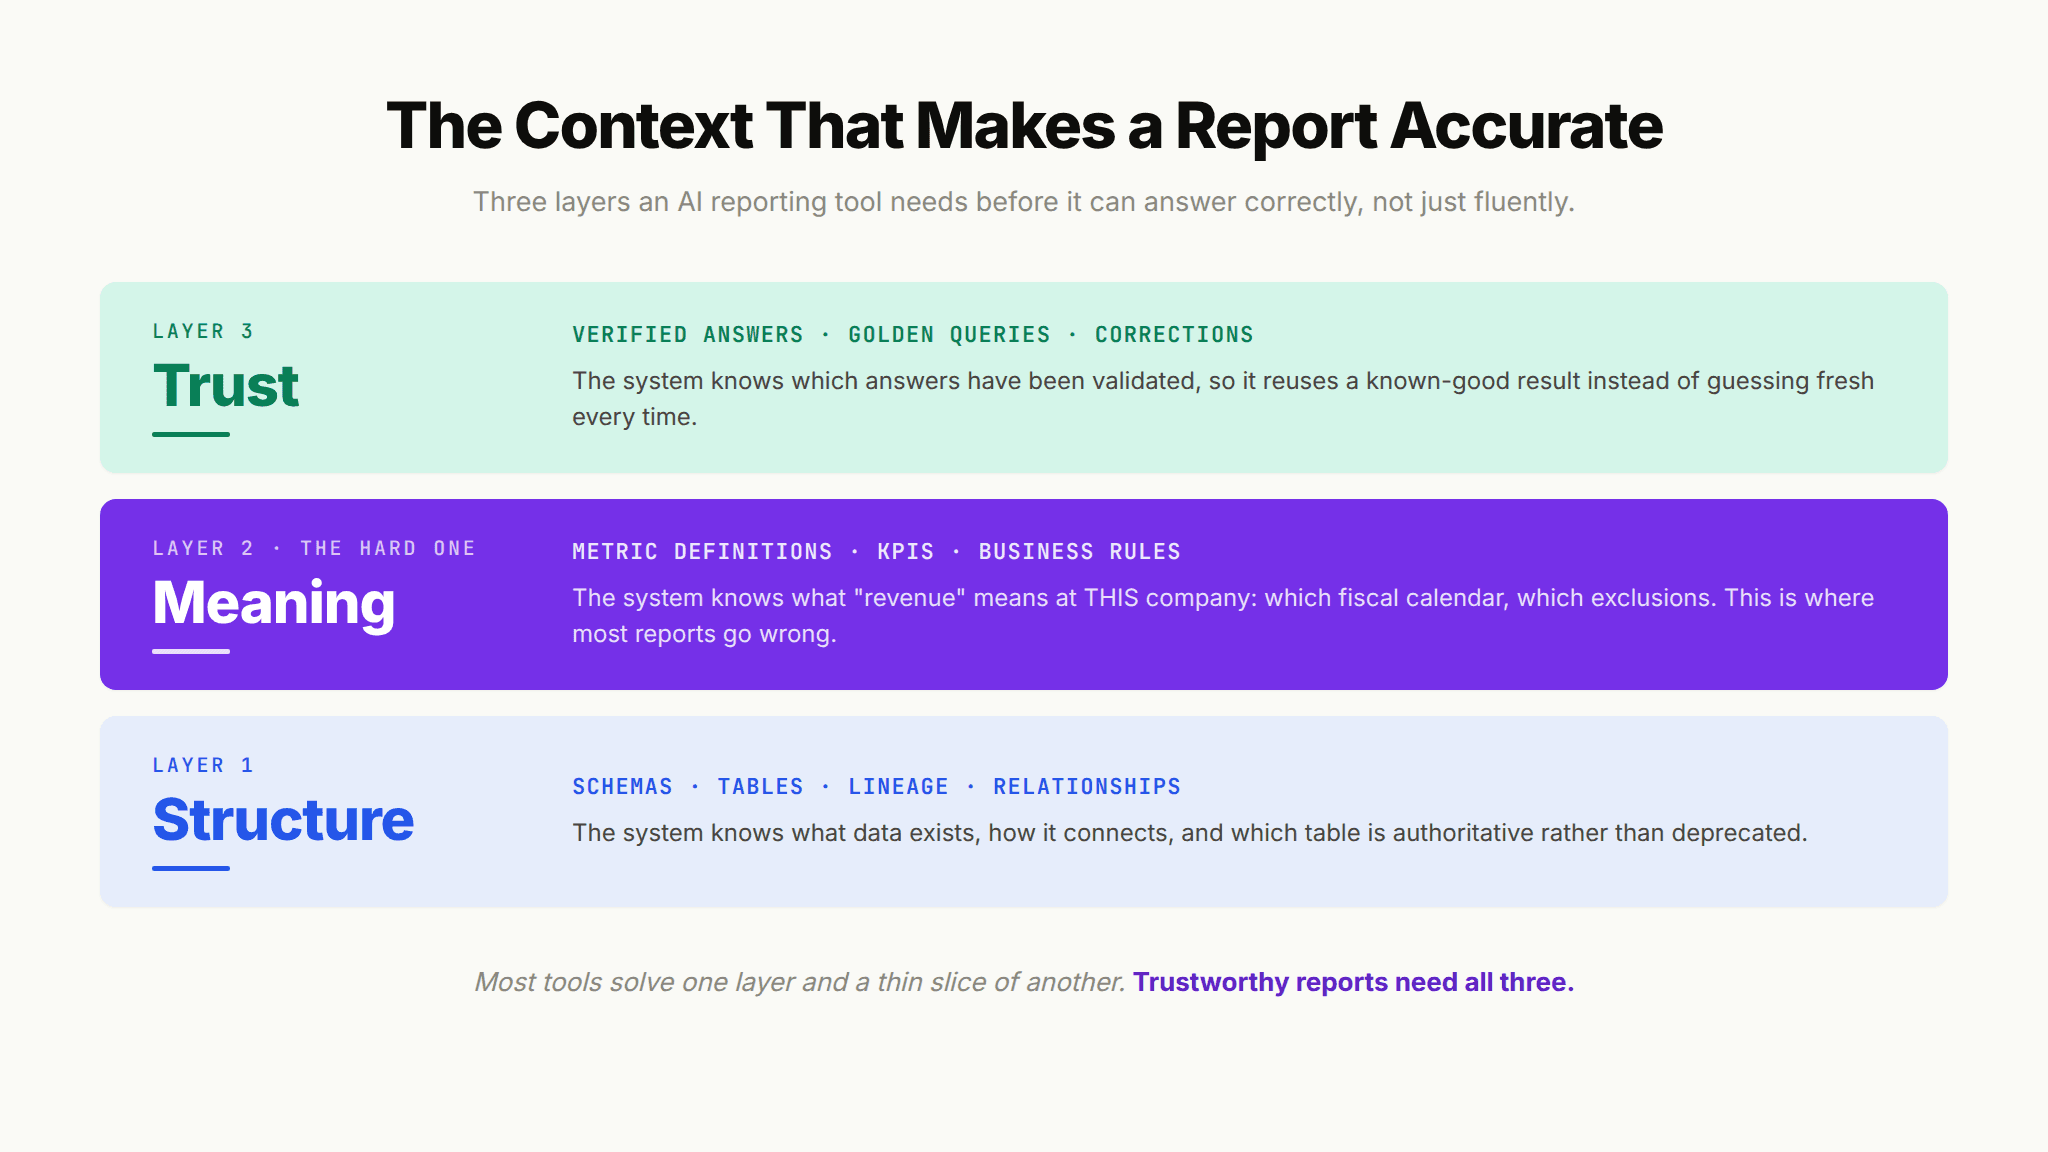
Practically, this is best understood as a three-layer context architecture: Structure (what data exists and how it connects), Meaning (what it means at your specific company), and Trust (which answers have been verified). Most tools solve one layer. Reporting breaks when any layer is missing, because the agent produces confident output with no way to know it is wrong.
Verification You Can Trust
A report you cannot trust is worse than no report, because it invites bad decisions delivered with false confidence. Look for tools that verify answers against a set of known-good queries, flag low-confidence results, and improve as users correct them. This matters because the failure rate of ungrounded AI is not hypothetical: MIT's Project NANDA study found that 95% of generative AI deployments produced no measurable business impact, most often due to weak data and integration rather than the model itself. A production-ready reporting tool treats accuracy as a system, not a hope.
Delivery Where Work Happens
The best answer is useless if it lives somewhere nobody looks. Modern AI reporting tools deliver into the surfaces where people already work: Slack, Teams, the product itself, or a chat interface, rather than forcing everyone back into a BI tool. This is also where the value compounds. When a business user can ask a follow-up in plain language and get a trustworthy answer in seconds, the report stops being a weekly artifact and becomes an always-available analyst.
If you are weighing options at this level of seriousness, it is worth stepping up to a proper evaluation of the category. Our guide to agent builder platforms that automate reporting lays out the criteria that separate a genuine context-aware platform from a copilot in new packaging.
Where AI Reporting Evaluations Quietly Go Wrong
Most teams do not choose the wrong tool because they lack information. They choose it because a handful of predictable blind spots shape the evaluation before the real questions get asked. Naming those blind spots up front tends to save months of rework.
Judging a Tool by Its Demo Instead of Your Data
Nearly every tool in this category looks impressive on a curated demo dataset. Clean schemas, obvious metrics, and rehearsed questions hide exactly the conditions that break AI reporting in practice. The evaluation that predicts production performance runs the tool against your messy, multi-source data and your own ambiguous questions. If a vendor resists that test, treat the resistance as the answer.
Confusing a Copilot with an Agent
A summary feature bolted under a dashboard is genuinely useful, but it will not shrink your team's request queue, because a person still has to drive it. Vendors market both copilots and agents as "AI reporting," which blurs the one distinction that determines your actual return. Before comparing prices, get clear on which stage a tool truly operates at: does it accelerate a skilled human, or does it own the task end to end?
Optimizing the Model and Overlooking the Context
It is tempting to grade tools on model quality and stop there, because the model is the visible, marketable part. In reporting, the model is rarely the constraint. The constraint is whether the tool can encode what your data means at your company: how revenue is defined, which table is authoritative, what a careful analyst would flag. A slightly weaker model with rich institutional context will beat a frontier model with none, every time.
Treating Accuracy as a Feature Rather Than the Foundation
Verification, guardrails, and correction loops often get filed under "nice to have" during evaluation, then become the reason a rollout fails six months later. In reporting, a confident wrong answer is worse than no answer, because it drives a real decision. The tools worth shortlisting treat accuracy as a system with tested, known-good answers behind it, not as a claim on a slide.
The Report Is Becoming a Conversation
The trajectory is clear. Reporting is moving from documents you receive to answers you request, and from a scheduled artifact to a live conversation with your data. The tools that win this shift will not be the ones with the flashiest model. They will be the ones that encode institutional knowledge well enough to give business users production-ready, trustworthy answers on demand.
That is the real work behind agent-generated reporting, and it is why context infrastructure, not the model, is the thing to evaluate. If your team is feeling the limits of scheduled reports and copilots, the next step is understanding how a context-first platform like Upsolve's Agent Studio approaches the problem, and how to judge the alternatives against it fairly and on your own terms.
Frequently Asked Questions
What is an AI reporting tool?
An AI reporting tool is software that uses artificial intelligence to generate, format, and interpret business reports automatically. It ranges from simple copilots that summarize a dashboard to full agents that answer a plain-language question end to end, retrieving data, running the analysis, and validating the result.
How is an AI reporting tool different from a BI dashboard?
A dashboard answers questions someone anticipated when they built it, and it stops at the follow-up. An AI reporting tool, especially an agent-based one, responds to new questions on demand and lets you interrogate the answer in conversation. Dashboards are a destination; AI reporting is a dialogue.
Are AI-generated reports accurate?
They are as accurate as the context behind them. A model with no access to your metric definitions and business rules will produce fluent, confident, and frequently wrong answers. Tools built on a structured context layer with answer verification are far more reliable, which is why accuracy is a context problem, not a model problem.
How much does an AI reporting tool cost?
Pricing varies widely by category, from per-seat copilot add-ons inside existing BI tools to platform pricing for full analytics agents. The more useful comparison is total cost including the analyst hours a tool saves or fails to save, since manual reporting can consume a majority of a data team's time.
Can AI reporting tools replace data analysts?
Not replace, but reshape. Agent-generated reporting can absorb the high volume of repetitive, look-up-style questions that clog a data team's queue, which frees analysts for deeper, judgment-heavy work. The tool handles the repeatable; the humans handle the ambiguous.
What is the difference between AI-assisted and agent-generated reporting?
AI-assisted reporting puts a copilot beside a human who is still driving the work, accelerating each step. Agent-generated reporting hands the whole task to an agent that plans, executes, validates, and delivers on its own. The copilot's quality depends on the person; the agent's quality depends on its context.

Try Upsolve for Embedded Dashboards & AI Insights
Embed dashboards and AI insights directly into your product, with no heavy engineering required.
Fast setup
Built for SaaS products
30‑day free trial