
Why self-service analytics stalled, what context engineering changes, and how analytics agents deliver the answers BI never could.

Ka Ling Wu
Co-Founder & CEO, Upsolve AI
10 min
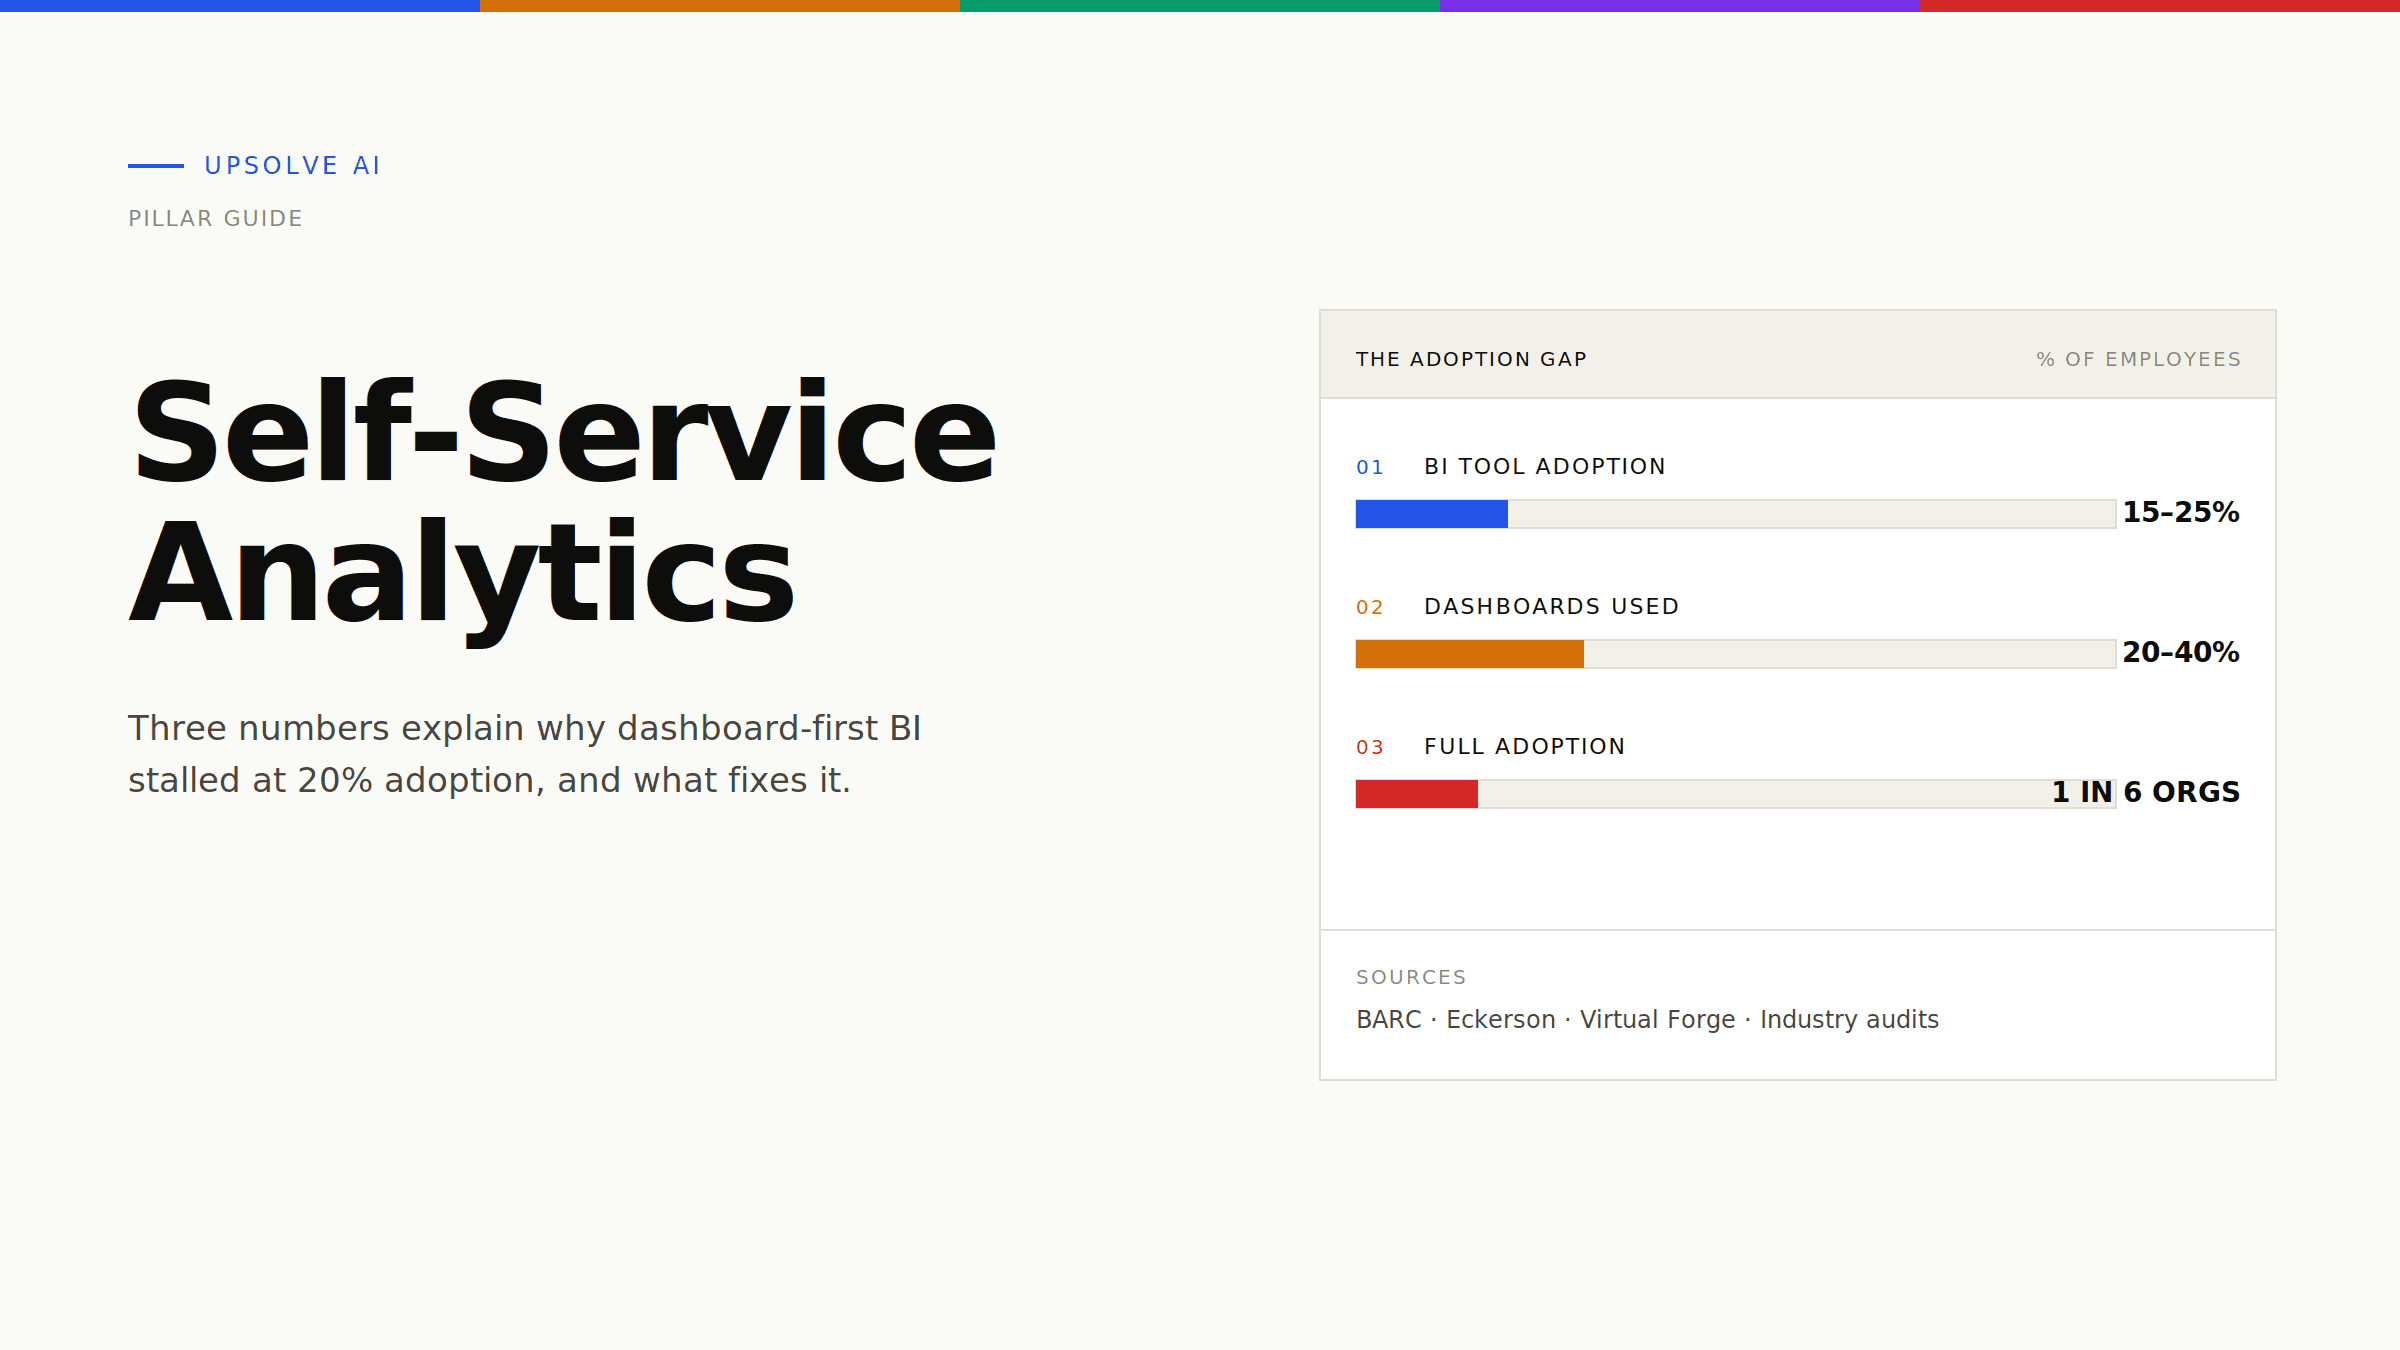
Self-service analytics is the model where business users explore data and answer their own questions without depending on the data team. The promise was independence at scale: dashboards that anyone could build, queries that anyone could run, decisions that anyone could make.
The reality, after fifteen years of investment, has been dashboard sprawl, sub-20% tool adoption, and a data request queue that keeps growing. This guide examines why traditional self-service analytics fell short of its promise, and how analytics agents are finally delivering the experience the category was supposed to provide.
Key Takeaways |
|---|
|
What Is Self-Service Analytics?
Self-service analytics is an approach to business intelligence in which non-technical users access, explore, and visualize data on their own, without filing tickets to a data team. The category covers self-service BI dashboards, ad-hoc reporting tools, drag-and-drop visualization platforms, and self-service data preparation tools. The defining characteristic is the same across all of them: the business user, not the engineer, is in the driver's seat.
The category has been a major investment area for over a decade. The global self-service analytics market was valued at USD 6.2 billion in 2024 and is projected to reach USD 23 billion by 2034, growing at roughly 16% per year. That growth is being driven by a real and durable pain: organizations still cannot get answers from their own data fast enough.
How Self-Service Analytics Is Defined Today
In practice, self-service analytics includes tools like Tableau, Looker, Power BI, Qlik, ThoughtSpot, and a long tail of newer entrants. The functional scope typically includes:
Data exploration: filtering, sorting, and slicing pre-modeled datasets without writing SQL.
Visualization: building charts, dashboards, and reports through drag-and-drop or natural-language interfaces.
Ad-hoc analysis: answering one-off questions without a formal data request.
Distribution: sharing dashboards with colleagues or embedding them into product surfaces.
Some platforms add AI features on top: natural-language query bars, auto-generated chart suggestions, anomaly detection. But the core paradigm remains unchanged. The business user is still asked to author analysis using a tool, not to ask a question and receive an answer.
A Brief History of the Self-Service Movement
Self-service analytics emerged in the early 2010s as a reaction to the IT-led reporting model that defined the previous decade. Cognos, Business Objects, and MicroStrategy had built sophisticated platforms, but every report was a project, every change request a backlog item, and every business decision waited on a data engineer's calendar.
Tableau's rise marked the inflection point. By giving business analysts a visual interface to query and explore data, Tableau promised to bypass IT and put data directly in the hands of decision-makers. Looker, Power BI, and Qlik followed with their own takes. The story was always the same: data should be a self-serve utility, like email or a search bar.
For all the investment and innovation, the central problem the category was supposed to solve, business users getting answers without waiting on engineers, never really got solved.
The Promise of Self-Service Analytics
To understand why self-service analytics is being reinvented, it helps to revisit what it was originally supposed to deliver. The pitch was straightforward and compelling.
What Vendors Said It Would Deliver
The promise had four pillars:
Independence: business users would answer their own questions without filing tickets.
Speed: insight cycles would compress from weeks to hours.
Scale: data teams would stop being bottlenecks because everyone could serve themselves.
Better decisions: when data is in everyone's hands, decisions get better, faster, and more democratic.
The story resonated because the alternative was painful. Data teams really were bottlenecks. Reports really did take weeks. Decisions really were made on instinct because the data arrived too late. Self-service promised to fix all of that.
Why Organizations Bought In
By the mid-2010s, self-service BI had become a budget priority. Gartner Magic Quadrants reorganized around the category. Vendors raised billions. Enterprise data teams stood up Tableau Centers of Excellence, Power BI rollout programs, and Looker enablement squads. Training budgets ballooned. License counts followed.
The investment thesis was sound: if you give every business user the ability to explore data, you scale the data function without scaling the data team. In a few high-functioning organizations, this worked. In most, it did not.
Why Self-Service Analytics Failed
Self-service analytics did not fail because the tools were broken. It failed because the model asked too much of the average business user and supplied too little context. The result has been a category that delivers real value to a small group of power users while leaving the broader workforce stuck waiting on the data team anyway.
Adoption Never Got Past the 20% Ceiling
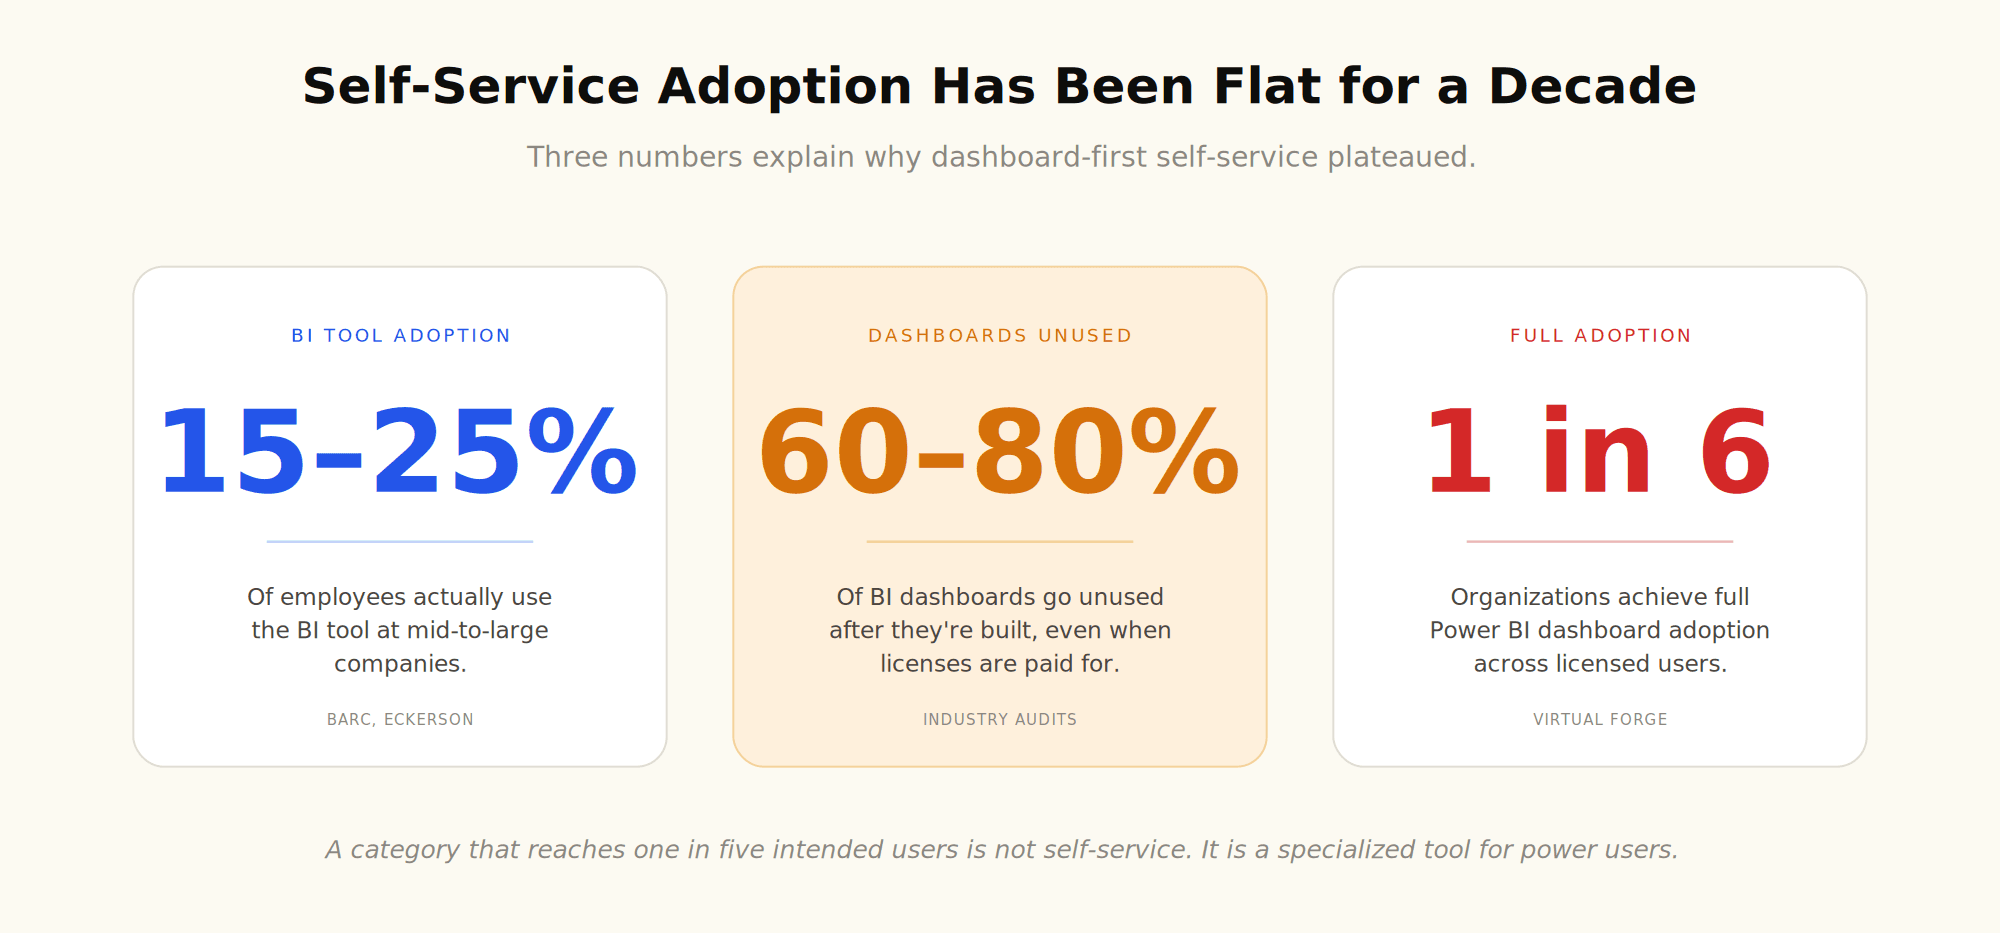
The most damning statistic about self-service analytics is its adoption rate. After a decade of investment, BARC research shows the average BI tool adoption rate at mid-to-large companies is around 15% of employees. A joint BARC and Eckerson study put the figure at 25% and noted it had barely moved in seven years.
Drilling into a specific platform makes the picture sharper. Research on Power BI deployments found that 58% of organizations had under 25% dashboard adoption, and only 16% achieved full adoption across their licensed user base.
A category that reaches one in five intended users is not self-service. It is a specialized tool for a small group of power users, surrounded by a much larger group of people who still file tickets.
Dashboard Sprawl Replaced the Reporting Backlog
The first paradox of self-service: it solved the reporting backlog by replacing it with dashboard sprawl. Once anyone could build a dashboard, everyone did. The result was thousands of dashboards across the organization, most of them duplicates, many of them out of date, and a meaningful fraction of them silently producing the wrong numbers.
Industry analyses suggest 60 to 80 percent of BI dashboards go unused after they are built. Data catalogs, semantic models, and governance councils were created to clean up the mess. Each added more process, which the original promise of self-service was supposed to remove.
The promise was self-serve analytics. It delivered. Dashboards proliferated. But a new problem emerged: too many dashboards, too few answers, and no clear way for a business user to know which dashboard is the right one.
The Training Tax No One Budgeted For
Self-service tools are sold as intuitive. In practice, getting real value out of Tableau, Looker, or Power BI requires meaningful training. Users need to understand the data model, the semantic layer, the calculated fields, the filter logic, and the joins. They need to know which dataset is the source of truth and which is a copy.
This is the training tax. It is rarely included in the ROI calculation. The companies that invest in it tend to be the ones whose adoption rates climb past 25%. The companies that do not, which is most of them, end up with shelfware.
The Context Gap That Tools Could Not Close
The deeper problem, the one no amount of training or tooling solves, is the context gap. A business user asking "what was our revenue last quarter?" needs to know:
Which "revenue" definition applies (recognized revenue, billed revenue, ARR snapshot)?
Which fiscal calendar (calendar quarter, fiscal quarter, custom)?
Which segment filter (all customers, paying customers, excluding trials)?
Which date field (close date, invoice date, payment date)?
Every one of these answers lives somewhere outside the dashboard: in a Slack thread, in a finance team's spreadsheet, in a dbt YAML file last updated in 2022, in the head of the one analyst who built the original report. The self-service tool cannot supply this context, so the business user either guesses, asks the data team, or copies a number from a familiar dashboard that may or may not be current.
This is the failure mode that traditional self-service analytics could never escape. It is the same failure mode that, as a16z argued in March 2026, is now causing AI analytics agents to underperform without a real context layer beneath them. The lesson from self-service generalizes: the context bottleneck is the bottleneck, regardless of whether the interface is a dashboard or a chat box.
The context that makes data interpretable lives in people's heads, in Slack threads, in a dbt YAML file last updated in 2022. Self-service tools never had access to it. The user was expected to bring it. Most could not.
The Hidden Costs of Failed Self-Service
When self-service analytics underdelivers, the costs are not just the wasted license spend. The downstream effects compound across the organization.
The data team queue grows, not shrinks. Internal benchmarks at data-mature organizations show that nearly half the inbound data requests are repeats of questions that have already been answered. The "self-service" workforce ends up funneling those questions back to the data team because they cannot trust their own results.
Decisions slow down. Business stakeholders who cannot get a reliable answer in 60 seconds often wait days for one. Some give up and decide on instinct, which is the outcome self-service was supposed to prevent.
Dashboards drift. Without active maintenance, dashboards diverge from current business logic. Metrics quietly change definitions. The same chart in two dashboards shows two different numbers.
Trust collapses. Once a stakeholder sees two conflicting numbers from two dashboards both built on the same warehouse, trust in the data function takes a hit. Rebuilding it is expensive and slow.
Shadow analytics proliferates. Business teams build spreadsheets, copy data manually, or paste results into ChatGPT. Sensitive data leaves the governed environment. The original self-service tools become a thin layer on top of a much messier reality.
High-cost specialists do low-leverage work. Analytics engineers and data scientists spend a meaningful share of their week answering the same ten questions, rather than working on novel analysis.
None of these problems are caused by the tools being bad. They are caused by the model asking the wrong people to do the wrong work.
What Traditional Self-Service Tools Got Wrong
Stepping back, the failure modes of self-service analytics can be traced to three foundational design choices.
They Required Translation, Not Conversation
Every self-service tool, including the ones that added natural-language interfaces, eventually asks the user to translate a business question into a technical operation. Even a drag-and-drop chart builder is a translation exercise: the user has to decide which fields to drag, which filters to apply, which join to use.
Business users do not think in dimensions and measures. They think in questions. The translation step is where most users either give up or produce something wrong.
They Externalized Context to the User
Self-service tools assumed the user would bring the context with them. Which metric is current? Which segment filter applies to this question? Which table is authoritative? The tool did not know, and it did not try to know. The user was expected to.
For a senior analyst, this is a reasonable expectation. For a marketing manager who wants to know "did the campaign work?", it is not. The tool that requires the user to be their own analyst is, by definition, not self-service.
They Optimized for Power Users
The Tableau hero user is a sophisticated analyst building intricate dashboards for the rest of the organization. The Looker hero user is a LookML developer modeling the warehouse. The Power BI hero user is a BI developer building enterprise reports. Each of these is a specialist, not the average business user.
The product roadmaps reflected this. Features got more powerful for the specialist and stayed inaccessible for the generalist. Adoption stayed flat. The data queue grew.
The Shift from Dashboards to Analytics Agents
The arrival of large language models capable of understanding business questions in natural language has reopened a category that looked closed. For the first time, it is plausible that the average business user can get a trustworthy answer to a business question without learning a tool. Gartner identified agentic analytics as a top data and analytics trend for 2025, and McKinsey research the same year flagged agentic AI as a major lever for enterprise productivity. The framing is increasingly that agents are the next generation of self-service, not a separate category.
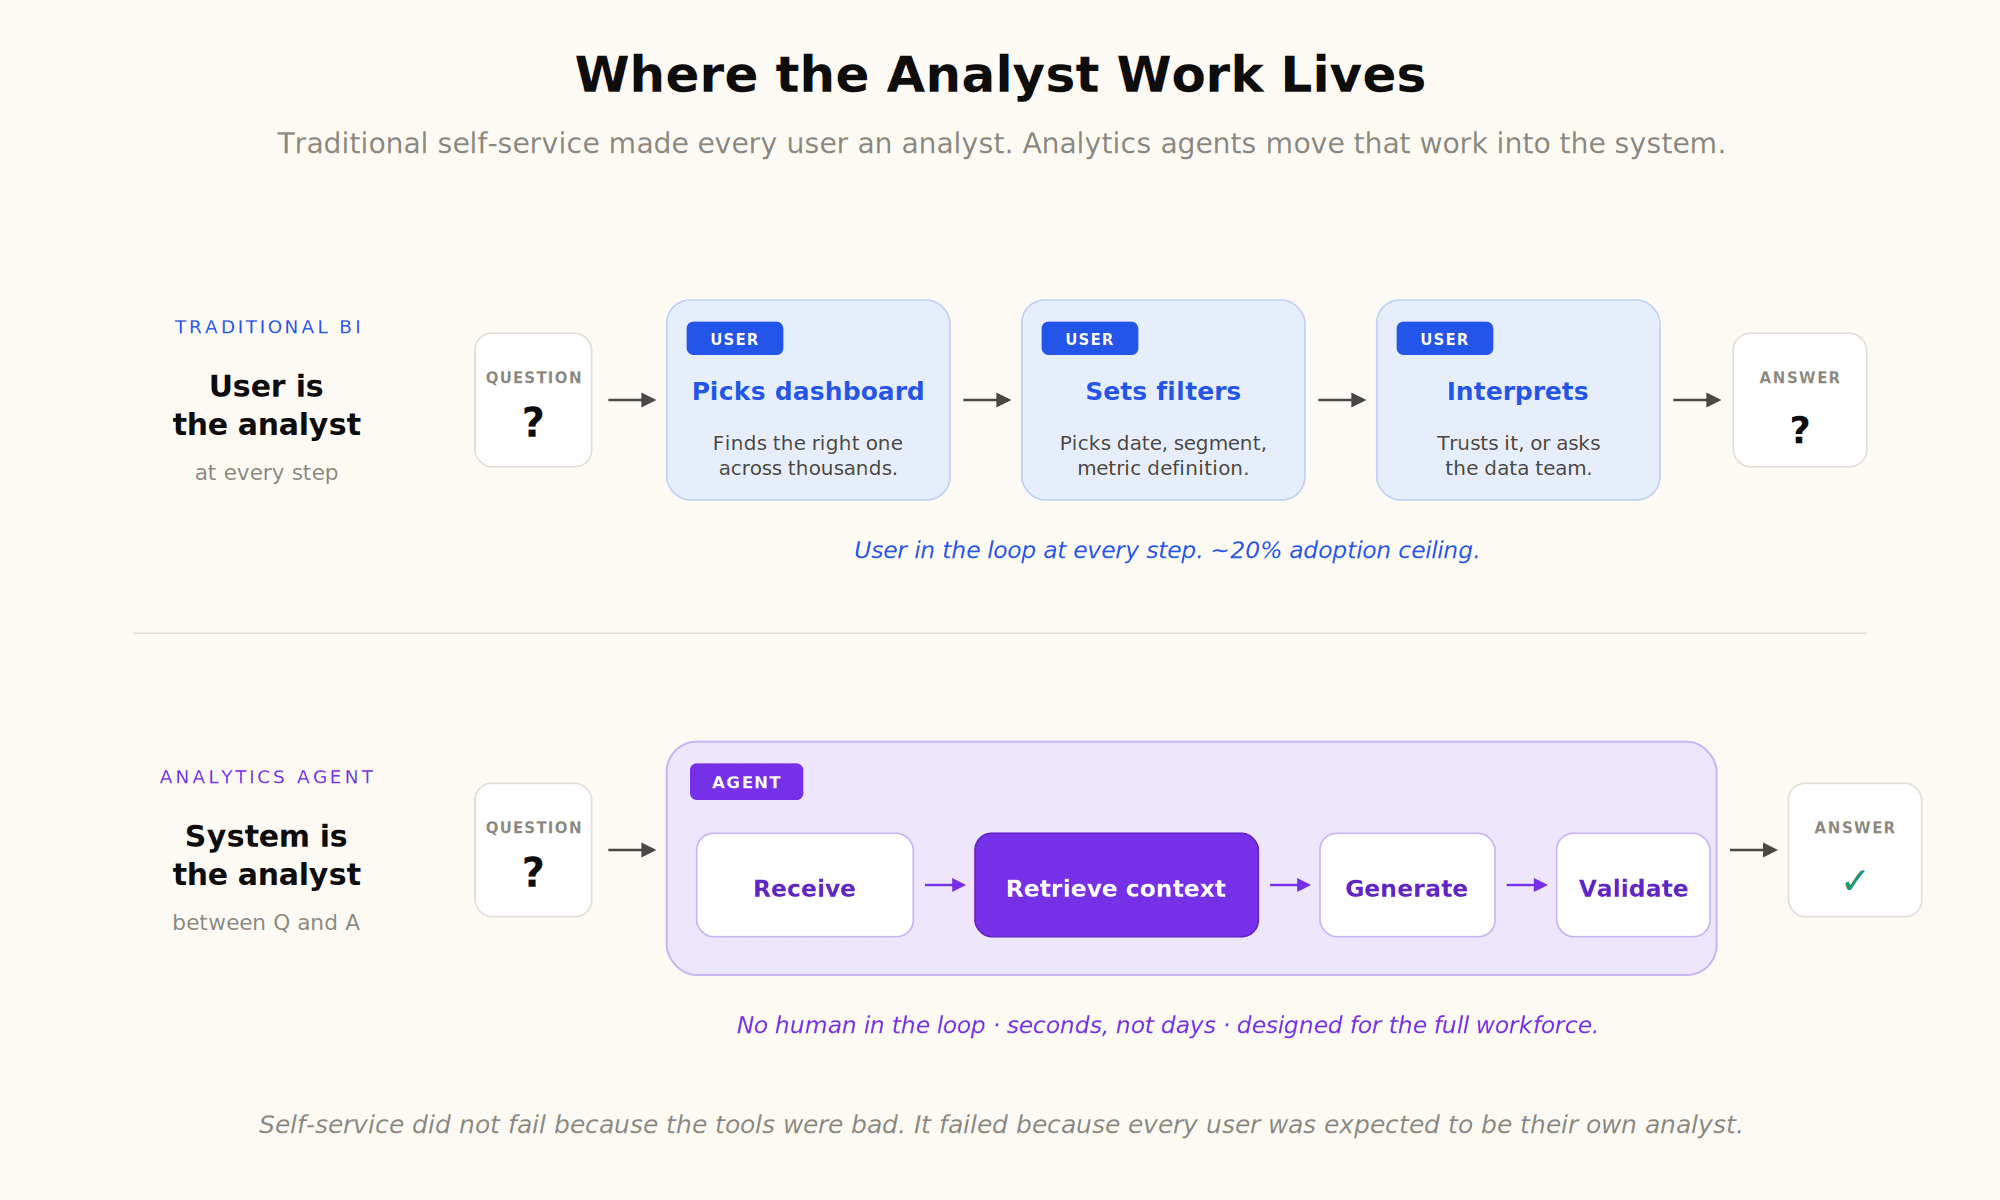
This is not just an interface upgrade. It is a different model for what self-service means. Instead of business users authoring analysis, analytics agents do the analysis on their behalf and return an answer, with the underlying query exposed for inspection.
From Building Reports to Asking Questions
The fundamental interaction changes. In a dashboard-first model, the user authors a view. In an agent-first model, the user asks a question and receives a view in return. The agent generates the SQL, runs the query, picks the visualization, and returns the answer. The user can then ask a follow-up.
This collapses three steps (find the right dashboard, navigate to the right filter, interpret the chart) into one (ask the question). For the four-out-of-five employees who never crossed the BI tool's adoption ceiling, it is the difference between using the system and not using it.
From Static Views to Dynamic Conversations
A dashboard answers the questions its author anticipated. A conversation handles the questions its author did not anticipate. This matters because the long tail of business questions, the ones that drive real decisions, almost never fit cleanly into a pre-built dashboard.
The shift is most visible in the transition from internal dashboards to embedded analytics agents inside SaaS products, where end users have no patience for filter-and-drill exploration and expect a direct answer.
From Tool Training to Encoded Knowledge
The model also shifts where the work lives. In a dashboard-first world, the data team builds the report and trains the user. In an agent-first world, the data team encodes the institutional knowledge (metric definitions, business rules, validated queries, table relationships) into a context layer that the agent draws on for every question.
Training the user becomes far less important. Encoding the context becomes the central job. This is a much higher-leverage activity for the data team, and one of the reasons the agent model can actually scale where dashboard-first self-service did not.
Key Insight: The data team's job shifts from servicing the queue to building the system that prevents the queue. Encoded context compounds; ticket-by-ticket answers do not.
How Analytics Agents Deliver on the Self-Service Promise
The original four-pillar promise of self-service (independence, speed, scale, better decisions) is finally achievable, but only with a different architecture beneath it. Analytics agents address each pillar directly.
Natural Language Replaces Query Languages
The first and most visible change is the interface. Business users ask questions in plain English. The agent parses the intent, maps it to the right tables, generates the query, and returns the answer. Users do not need to know what a join is.
This alone does not solve self-service. As text-to-SQL research has demonstrated, accuracy plateaus quickly without business context. But it removes the first and largest barrier: the translation step that broke adoption in the dashboard era.
Context Infrastructure Replaces Tribal Knowledge
The second and deeper change is what sits underneath the interface. The agent does not just have access to the schema. It has access to the metric definitions, the business rules, the validated queries, the golden assets, and the historical corrections that constitute the company's institutional knowledge.
This is what makes the answers trustworthy. The agent that knows your "revenue" definition, that knows the close-date convention, that knows which segment filter applies, produces an answer the business user can act on. The agent that does not produces a guess.
This is also where most current agent attempts fall short. As OpenAI documented in its writeup of the in-house data agent it built for internal use, high-quality answers depend on rich, accurate context, and the team built six deliberate layers of context grounding to make the agent reliable.
The Three-Layer Architecture That Makes It Work
The most useful framing of context, drawn from the practitioner community and supported by the a16z thesis on context layers, separates context into three distinct layers:
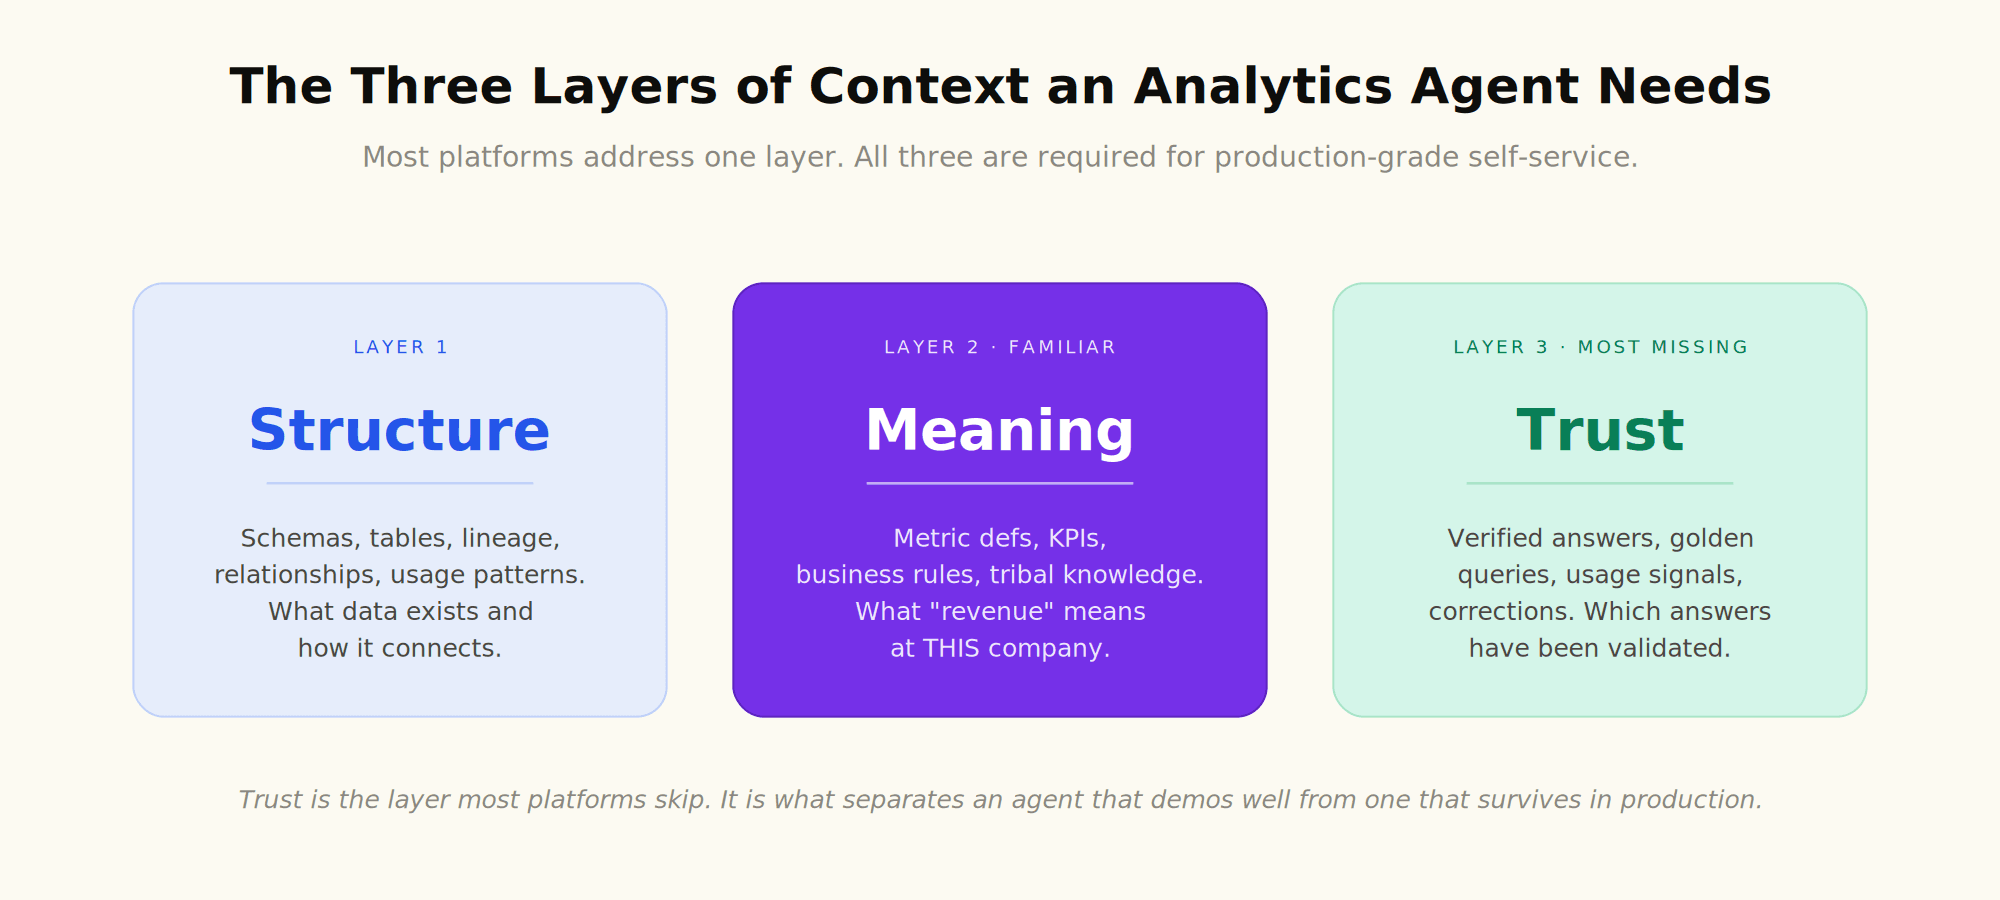
Structure: schemas, tables, lineage, relationships, usage patterns. The agent knows what data exists and how it connects.
Meaning: metric definitions, KPIs, business rules, tribal knowledge. The agent knows what "revenue" means at this company, not at any company.
Trust: verified answers, golden queries, usage signals, corrections. The agent knows which prior answers have been validated and which are unproven.
Most analytics platforms address one or two of these. The semantic layer addresses Meaning. The warehouse catalog addresses Structure. Trust is the layer most often missing, and it is what separates an agent that demos well from an agent that survives in production. Building all three layers is what context engineering does as a discipline.
Pro Tip: When evaluating self-service analytics platforms, ask the vendor to walk you through how their system handles all three layers, not just the one they market most heavily. The platform that talks only about its semantic layer is a Meaning-layer product, which is one third of what an agent actually needs.
What to Look for in Modern Self-Service Analytics
If self-service is being reinvented around analytics agents, the evaluation criteria are different from the dashboard-era checklist. The questions buyers asked about Tableau and Looker were about chart libraries and connector counts. The questions buyers should ask about agent-based self-service are about context, accuracy, and trust.
Capability Checklist
The right modern self-service platform should let you answer yes to the following:
Does the platform encode context across all three layers (Structure, Meaning, Trust), or only one?
Can users ask questions in natural language and get answers grounded in your business definitions, not generic schema-only inference?
Is there an evaluation framework? Can you test agent accuracy against a known-good set of questions?
Are answers explainable? Can users see the underlying query and the context that informed it?
Does the system improve over time as users correct or validate answers?
Can it deploy on multiple surfaces (Slack, embedded SDK, web interface) or only one?
Is the security model production-grade (SOC 2 Type II, HIPAA where relevant, role-based access)?
Dashboards vs Analytics Agents: A Practical Comparison
Capability | Traditional Self-Service BI | Analytics Agent Approach |
|---|---|---|
Primary interaction | Author a dashboard | Ask a question |
Required user skill | Knows the data model, calculated fields, filters | Knows the business question |
Context source | User supplies tribal knowledge | Encoded in context layer |
Adoption ceiling | ~20% of employees in most orgs | Designed for the full workforce |
Failure mode | Wrong filter, stale dashboard, abandoned tool | Wrong context, low confidence, requires correction |
Maintenance work | Build and maintain dashboards | Encode and refine context |
Best fit | Power users, recurring reports | Long-tail questions, embedded experiences |
For SaaS product teams considering whether to ship analytics inside their own products, the same shift applies: traditional embedded BI is being displaced by embedded analytics agents, and the related decision tree around white-label analytics options now centers on whether the platform can deliver agent-based experiences alongside dashboards.
Common Mistakes When Moving to Agent-Based Self-Service
Replatforming self-service from dashboards to agents is not a free lunch. The most common ways organizations stumble are recognizable and avoidable.
Treating Agents Like Smarter Dashboards
The first mistake is assuming an analytics agent is a faster way to build the same dashboards. It is not. The unit of work changes from "build a chart" to "encode a definition." Teams that approach agents as a dashboard accelerator end up with a chat interface bolted onto the same context-poor foundation. The result feels novel for a week and then plateaus, because the same context gap that broke dashboards breaks the agent.
Underestimating the Context Build
The second mistake is treating context as optional or "phase two." Schema-only agents work in demos and break in production. The teams that succeed treat context infrastructure as the product, not as documentation. This usually means starting with the metrics and questions that matter most to the business, encoding them with precision, validating them with users, and expanding the corpus as the agent earns trust.
The 95% pilot failure rate that the MIT NANDA initiative documented for enterprise generative AI applies here. Most agent projects stall not because the model is wrong, but because the integration and context work was scoped as a sprint instead of as the core build.
Bottom line: The failure is rarely the model. The failure is almost always context. Plan for the context build as the central piece of the project, not an afterthought.
Skipping Evaluation Infrastructure
The third mistake is not building the evaluation suite. Without a way to test agent accuracy against a known-good set of questions, every change is a gamble and every regression is invisible until a user complains. Golden query testing, LLM-as-judge evaluation, and conversation logs are not nice-to-haves; they are how the agent earns and keeps trust over time. The analogous discipline in software engineering is unit testing. In agentic analytics, it is the agent evaluation framework.
See How Modern Self-Service Looks in Practice
The original promise of self-service analytics is finally within reach. It is no longer about giving every business user a dashboard authoring tool and hoping they become an analyst. It is about encoding the institutional knowledge that makes answers trustworthy, deploying it through an interface anyone can use, and measuring the result with the rigor of a production system.
If you are evaluating what this looks like for your own organization, our guide to platforms that deliver self-service through analytics agents walks through the architecture, the evaluation criteria, and the trade-offs across the major options.
Frequently Asked Questions
What is self-service analytics in simple terms?
Self-service analytics is an approach where business users access and analyze data on their own, without depending on the data team. Traditionally this meant tools like Tableau, Power BI, or Looker that let users build dashboards and reports. More recently, it has expanded to include analytics agents that answer questions in natural language and remove the need for the user to author analysis at all.
Why has self-service analytics failed to deliver on its promise?
The short answer is context. Self-service tools required business users to translate business questions into technical operations and to supply the context (metric definitions, business rules, table relationships) the tool needed to produce the right answer. Most users could not do this consistently, which is why BI tool adoption stuck around 15 to 25% for over a decade and why dashboard sprawl became the dominant failure mode.
Are analytics agents just a smarter version of self-service BI?
No. The interaction model is different. Self-service BI is about authoring analysis. An analytics agent is about asking a question and receiving an answer. The user does not need to know the data model. The agent draws on an encoded context layer to produce the answer and explains its reasoning. The architectural shift, particularly the introduction of a three-layer context infrastructure covering Structure, Meaning, and Trust, is what makes the agent model work where dashboard-first self-service stalled.
Will analytics agents replace dashboards entirely?
Probably not in the near term. Dashboards remain useful for monitoring known metrics in known views. The shift is that the long tail of ad-hoc questions, which is the part of the workload that drove the data team queue, moves to the agent. Many organizations will run both: dashboards for the canonical metrics and agents for everything else. Over time, agents will also start building dashboards on demand, which collapses the distinction further.
How do you measure success for a self-service analytics platform today?
The dashboard-era metrics (license count, dashboard count, hours of training delivered) are weak proxies. The agent-era metrics are more direct: percentage of business questions answered without involving the data team, agent accuracy on a golden question set, time to answer for a typical question, percentage of validated versus unvalidated answers, and reduction in the inbound data request queue.
What should we do if we already invested in a traditional self-service BI stack?
The investment is not wasted. The semantic layer, validated dbt models, and dashboards that exist today are exactly the kind of artifacts that feed the Meaning and Trust layers of an analytics agent. The path forward is usually to add an agent layer on top of the existing stack, encode the context that already lives in your data team's heads and Slack threads, and migrate the long tail of ad-hoc questions to the agent first while keeping canonical dashboards in place.

Try Upsolve for Embedded Dashboards & AI Insights
Embed dashboards and AI insights directly into your product, with no heavy engineering required.
Fast setup
Built for SaaS products
30‑day free trial