
See how ThoughtSpot and Tableau compare across features, pricing, embedding, ease of use, and which platform fits your team and use cases best.

Ka Ling Wu
Co-Founder & CEO, Upsolve AI
10 min

Disclosure: This article is published by Upsolve AI. Where our product is mentioned alongside competitors, we aim to provide balanced coverage based on publicly available information. We encourage readers to evaluate all options independently.
If you're reading this, you're probably stuck between two names everyone in BI knows: ThoughtSpot and Tableau.
Both promise to turn raw data into real insights.
Both have big claims, loyal fans, and price tags to match.
ThoughtSpot focuses on speed and simplicity, great if you want natural language search and quick answers.
Tableau leans into customization, great if you’ve got the time, skills, and team to build complex dashboards.
But let’s be honest, choosing between them isn’t about features.
It’s about what actually fits your team, your users, and your workflow.
So in this blog, we’ll break down where each tool wins, where they fall short, and what to consider before you make the call.
ThoughtSpot vs Tableau: A Quick Overview
If you're deciding between ThoughtSpot and Tableau, here's what you need to know upfront.
Feature | ThoughtSpot | Tableau |
Core Strength | AI-powered search and self-service analytics for all users | Industry-leading visual analytics and dashboarding |
User Experience | Natural language queries, built for business users without technical knowledge | Drag-and-drop dashboards, best for analysts and data-savvy users |
AI Capabilities | Spotter: A conversational AI agent that understands business logic and context | Tableau Agent: AI assistant for quick insights and decision support |
Data Access | Real-time analytics with live query or cached data; flexible control | Performs best with extracts; live query can be slower on large datasets |
Customization & Visuals | Simple charts and Liveboards focused on clarity and speed | Rich, customizable dashboards with advanced visual storytelling |
Embedding | Developer-friendly, low-code APIs for embedded smart apps | Embedding available but setup is heavier; more dev time required |
Data Modeling & Developer Tools | Unified workspace with SQL, Python, R; built-in notebooks | Separate tools like Tableau Prep and Desktop required for full setup |
Mobile & Accessibility | Multi-turn conversational analytics on mobile with token verification | Mobile dashboards available but limited conversational support |
Target Users | Business teams, product teams, SaaS companies looking for low-lift embedded analytics | Analysts, data teams, and enterprises prioritizing high-end visual dashboards |
Pricing | Per user: Essentials from $25/month, Pro from $50/month; Enterprise quoted. Separate Embedded line with a free Developer tier. | From $15 per user/month billed annually; higher tiers quoted. Role licenses sold separately. |
What Is ThoughtSpot?
ThoughtSpot is a business intelligence (BI) tool designed to help you simplify how you explore and analyze data.
It allows you to search your data using natural language, like typing a question into a search engine.
This approach makes it easier for non-technical users to find insights without relying heavily on analysts or IT teams.
Key Features of ThoughtSpot
Natural Language Search: Ask data questions using plain English and get instant answers.
Real-Time Analytics: Analyze live data without delay.
AI-Driven Insights: Automatically surfaces trends, anomalies, and KPI changes.
Easy Embedding: Add analytics to apps with low-code tools.
Modern Integrations: Connects natively to BigQuery, Snowflake, Redshift, and more.
If Power BI is also on your list, we compare it against ThoughtSpot in ThoughtSpot vs Power BI.
What Is Tableau?
Tableau is a business intelligence (BI) and data visualization tool that helps you explore and present your data visually appealingly.
It allows you to connect to various data sources, analyze the data, and create interactive dashboards and reports.
Key Features of Tableau
Advanced Visualizations: Create rich, interactive dashboards with deep customization.
Drag-and-Drop Builder: Design visual reports without writing code.
Broad Data Integration: Connects to Excel, SQL, Google Sheets, Snowflake, Redshift, and more.
Real-Time & Extract Support: Analyze live data or optimize with .hyper extracts.
Embedding Options: Dashboards can be embedded into apps and websites, but setup may require technical effort.
Scales with Data: Handles large datasets with tuning, but performance varies by setup.
For a different angle on Tableau, see how it compares against Looker in Tableau vs Looker.
Now you have a brief overview of ThoughtSpot and Tableau; the next step is to see how they stack up against each other across the key metrics that matter to you.
ThoughtSpot vs Tableau: Feature-by-Feature Comparison
In this section, I'll walk you through how ThoughtSpot and Tableau stack against the most essential metrics for BI tools.
The features we'll be measuring them against are:
Ease of Use
Data Visualization
Embedding
Integration
Pricing
Performance
Ease Of Use
ThoughtSpot: Simple and Straightforward
ThoughtSpot makes data easy to explore, especially for non-technical users. You can type questions in plain English and get instant answers without needing SQL.
User Reviews
Easy to use with natural language queries
Great for non-technical users
Limited for advanced analytics and customization
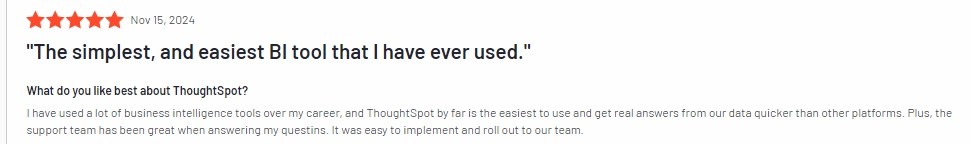
Tableau: Flexible but Complex
Tableau’s drag-and-drop tools make building dashboards easy, but advanced tasks like data blending and scripting require BI experience.
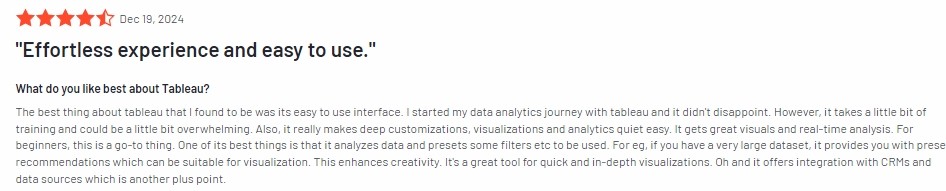
User Reviews
Visuals are clear and quick to generate
Lacks polish for high-stakes presentations
Limited customization options
Ease of use comparison: Thoughtspot vs Tableau
Metric | ThoughtSpot | Tableau |
|---|---|---|
Ease of Use | Approachable through natural language search. | Steeper learning curve, highly flexible once learned. |
Best For | Non-technical users who need quick answers. | Users with BI experience, or willing to build it. |
Challenge | More limited for advanced analytical work. | Setup and navigation take time for beginners. |
Data Visualization
ThoughtSpot: Functional But Limited
ThoughtSpot focuses on simplicity, offering fast, functional visuals. However, it lacks the customization needed for more complex or polished dashboards.
User Reviews
Clear and fast visuals
Not polished enough for presentations
Limited customization options
Tableau: Rich And Customizable
Tableau is known for powerful, customizable visualizations with options like heatmaps, treemaps, and fully tailored dashboards.
User Reviews
Creates impressive, story-driven dashboards
Customization takes time and practice
Data visualization comparison: Thoughtspot vs Tableau
Metric | ThoughtSpot | Tableau |
|---|---|---|
Visualization Depth | Standard charts and tables with limited customization. | Rich, interactive, highly customizable dashboards. |
Best For | Quick, functional answers. | Detailed, presentation-ready visuals. |
Challenge | Less flexible for complex visualizations. | Building and refining dashboards takes real time. |
Embedding
ThoughtSpot: Good for Embedding
ThoughtSpot makes embedding easy with strong API support, making it ideal for SaaS teams adding analytics into their apps.
User Reviews
Embedding is easy with strong API support
Limited branding customization options
Tableau: Flexible but Complex
Tableau supports powerful embedding, but setup is complex and often needs advanced technical skills.
User Reviews
Effective embedding into web apps
Requires significant developer effort
Setup process is often challenging
Embedding Ease Comparison: Thoughtspot vs Tableau
Metric | ThoughtSpot | Tableau |
|---|---|---|
Embedding Complexity | Straightforward, with substantial API support. | Requires technical expertise and configuration time. |
Best For | Embedding analytics into SaaS applications. | Detailed, branded dashboards inside integrated platforms. |
Challenge | Fewer options for visual customization. | Flexible, but setup is involved. |
Integration
ThoughtSpot: Seamless and API-Friendly
ThoughtSpot is built for cloud environments with native integrations (e.g., Snowflake, BigQuery) and an API-first approach that makes embedding fast and developer-friendly.
User Reviews
Users say integration with Snowflake is seamless
Embedding is smooth and developer-friendly
Significantly reduces setup and dev time
Tableau: Versatile but Complex
Tableau connects to many data sources, but integration, and embedding in particular, can be time-consuming and needs technical expertise.
User Reviews
Users praise Tableau’s data connections
Say embedding takes time and setup is complex
Performs reliably once configured
Integration Comparison: Thoughtspot vs Tableau
Metric | ThoughtSpot | Tableau |
|---|---|---|
Data Source Integration | Direct connectors for cloud platforms including Snowflake and BigQuery. | Broad compatibility across a wide range of sources. |
Ease of Integration | API-first approach simplifies embedding. | Embedding requires technical expertise and time. |
Best Fit For | SaaS applications that need analytics embedded. | Businesses connecting across many varied platforms. |
Challenge | Scoped to ThoughtSpot's native capabilities. | Extensive customization available via SDK and APIs. |
Pricing
Pricing at a glance:
Metric | ThoughtSpot | Tableau |
|---|---|---|
Starting Price | From $25 per user/month (Essentials), billed annually. | From $15 per user/month (Standard), billed annually. |
Agent Capability | Spotter included from Pro at $50 per user/month. | Tableau Agent included in Cloud+ and above, quoted. |
Cost Transparency | Rates listed for Essentials and Pro; Enterprise quoted. | Rates listed by edition; top tiers quoted. |
Additional Costs | Embedded is licensed separately, with a free Developer tier. | Role licenses sold separately; at least one Creator required. |
ThoughtSpot
ThoughtSpot sells ThoughtSpot Analytics for internal use and ThoughtSpot Embedded for putting analytics inside your own product.
Essentials: from $25 per user/month, billed annually. Supports 5 to 50 users and up to 25 million rows.
Pro: from $50 per user/month, billed annually. Adds Spotter AI Agents at 25 queries per user per month, with unlimited LLM tokens. Available per user or by usage.
Enterprise: quoted. Unlimited users and data, with enterprise governance.
Embedded Developer: free for one year, up to 10 users and 25 million rows, with full API and SDK access.
Embedded Enterprise: quoted, for multi-tenant applications at scale.
Note that agent capability starts at Pro. Essentials does not include Spotter. Current figures are on ThoughtSpot's pricing page.
User Reviews
Users describe ThoughtSpot as expensive once you scale past a small team
Enterprise features are seen as justifying the cost
Enterprise pricing typically involves negotiation
Tableau
Tableau lists its pricing by edition, all billed annually under an annual contract.
Tableau Standard: from $15 per user/month. Web authoring, Tableau Desktop and Prep Builder, and Tableau Pulse.
Tableau Enterprise: from $35 per user/month. Adds Advanced Management and Data Management.
Tableau Cloud+ and Tableau+ Bundle: quoted. Add Tableau Agent, Premier Success, and Tableau Next.
Every deployment requires at least one Creator license, and Creator, Explorer, and Viewer licenses are still sold separately for additional users, which affects real entry cost more than the headline figure suggests.
User Reviews
Users value being able to match license type to how each person actually works
Costs climb quickly as seat count grows
Performance
ThoughtSpot: Built for Speed and Real-Time Analytics
ThoughtSpot is designed to provide fast, real-time analytics.
It processes queries quickly, even with large and complex datasets, leveraging its AI-powered backend and direct integration with modern data warehouses like Snowflake and Google BigQuery.
User Reviews
Users say ThoughtSpot runs fast on large datasets
Occasional slowdowns with very high query volumes
Tableau: Reliable with Large Data but Resource-Intensive
Tableau handles large datasets well with extracts, but real-time performance varies and often needs manual tuning.
User Reviews
Users say Tableau handles big data well
Dashboard loads can be slow
Performance improves with optimized extracts, but setup is tricky
Performance Comparison: Thoughtspot vs Tableau
Metric | ThoughtSpot | Tableau |
|---|---|---|
Speed | Real-time querying with fast response. | Strong performance, slower against live data. |
Large Datasets | Built around modern cloud warehouses. | Handles volume well with optimized extracts, at a resource cost. |
Optimization | Minimal tuning required. | Benefits substantially from manual tuning. |
Real-Time | Live queries and dynamic updates. | Bounded by data source refresh rates. |
Both platforms carry real constraints. Tableau's depth costs time, both to learn and to tune. ThoughtSpot's approachability comes with less visual control and a scope limited to what its model understands.
Something has shifted in this evaluation recently. Both vendors now ship agents, ThoughtSpot with Spotter and Tableau with Tableau Agent, and the criteria for judging those are not the criteria for judging a dashboard builder. If that is part of your process, this guide to what to look for in an analytics agent platform covers the dimensions that apply.
Where Agentic Analytics Fits
Both vendors have already moved in this direction. ThoughtSpot ships Spotter, a conversational agent, from its Pro tier up. Tableau ships Tableau Agent in Cloud+ and above. These are real products, and anyone evaluating agent capability should look at both.
Upsolve AI builds context infrastructure for analytics agents, which is the layer underneath. Here is the shape of it. Point any AI tool at your warehouse and it will return an answer in seconds. It will also query the deprecated orders table, treat "last quarter" as calendar rather than fiscal, and include the internal test accounts nobody remembers excluding. The query runs. The number is wrong. Nobody catches it until two reports disagree in front of the board.
That failure is not about model quality. It is about knowledge the model cannot reach: which table finance actually trusts, how your company defines an active customer, which exception applied to last year's Q3. That knowledge lives in analysts' heads, in Slack threads, and in a model definition that stopped matching reality when someone renamed a column upstream.
Agent Studio is where a data team encodes that knowledge in a form an agent can use: metric definitions, validated query patterns, business rules, and guardrails on what the agent may answer. The Agentic Dashboard is the other side, where someone in finance or sales asks a question in plain language, or describes the dashboard they want built, instead of joining the reporting queue.
That knowledge is organized into three layers:
Structure: what data exists and how it connects.
Meaning: what a term like revenue means at your company specifically, not in general.
Trust: which answers have been checked by someone who would know.
Where platforms differ is not whether they have an agent. Increasingly they all will. The difference is how much of your institutional knowledge the agent can actually reach, and whether anyone has verified what it says. An agent sitting on top of a proprietary model can only reason over what has been defined inside that model. Agents break down in production when Structure or Trust is missing, and Trust is the layer almost nobody builds.
Pricing: free tier, Pro from $500/month, Team at $2,000/month, which adds embedding, role-based access control, multi-tenant support, and semantic layer generation. Enterprise is custom. Annual billing is 20% off. Compliance controls for regulated environments are available.
None of this replaces ThoughtSpot or Tableau on a like-for-like basis, and it is not ranked against them here. If you need a search interface or a visualization tool, the comparison above is the relevant one. If your recurring problem is that answers arrive fast but still get questioned, that is a different purchase.
Conclusion
ThoughtSpot and Tableau are both capable, and the choice turns on who is doing the work.
Choose ThoughtSpot if the people who need answers are not the people who build reports, if embedding into your own product matters, and if agent-driven querying is central to what you want. The free Developer tier makes the embedded product inexpensive to trial.
Choose Tableau if visual quality is the deliverable, if you have analysts who will invest in learning it properly, and if you want per-seat rates you can model in advance without a sales call.
If neither feels right, the reason is often that the bottleneck is not the reporting tool at all. It is that every question requires someone who knows the data to be available, and that person has a queue. Neither a search box nor a visualization library fixes that on its own.

Try Upsolve for Embedded Dashboards & AI Insights
Embed dashboards and AI insights directly into your product, with no heavy engineering required.
Fast setup
Built for SaaS products
30‑day free trial


