
Compare ThoughtSpot and Power BI across features, pricing, use cases, and limitations to see which analytics platform fits your team and data needs best.

Ka Ling Wu
Co-Founder & CEO, Upsolve AI
10 min

Disclosure: This article is published by Upsolve AI. Where our product is mentioned alongside competitors, we aim to provide balanced coverage based on publicly available information. We encourage readers to evaluate all options independently.
ThoughtSpot and Power BI both sell themselves on making data accessible, but they take opposite routes to get there.
ThoughtSpot built its product around search. You type a question in plain language and get a visual answer back, which is aimed squarely at people who will never open a modeling tool.
Power BI built its product around the Microsoft stack. It assumes you already live in Excel, Teams, and Azure, and it rewards teams willing to learn DAX with a great deal of analytical depth.
This comparison covers ease of use, performance on large datasets, integrations, current pricing, and which situations favor one over the other.
What Is ThoughtSpot?
ThoughtSpot is an AI-powered analytics platform designed to make data accessible and understandable for everyone in a business, even those without a technical background.
It allows users to search and analyze data as easily as doing an internet search.
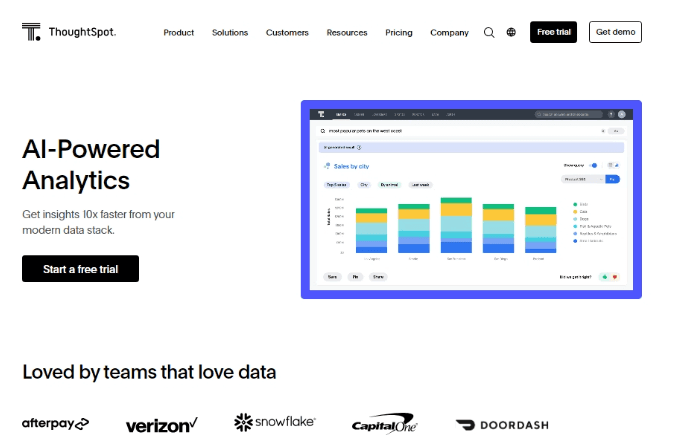
Imagine asking, "What were our top products last quarter?" and instantly getting a clear, visual answer. That’s the power of ThoughtSpot’s search-based analytics.
Key Features Of Using ThoughtSpot
ThoughtSpot’s key features include:
Search-Driven Analytics: Users can query data using natural language, similar to a search engine, enabling quick and intuitive data retrieval without the need for complex query languages.
Spotter AI Agents: ThoughtSpot's agent layer, available on Pro and above, which handles conversational analysis rather than single-shot search. Enterprise and Embedded Enterprise tiers include unlimited LLM tokens.
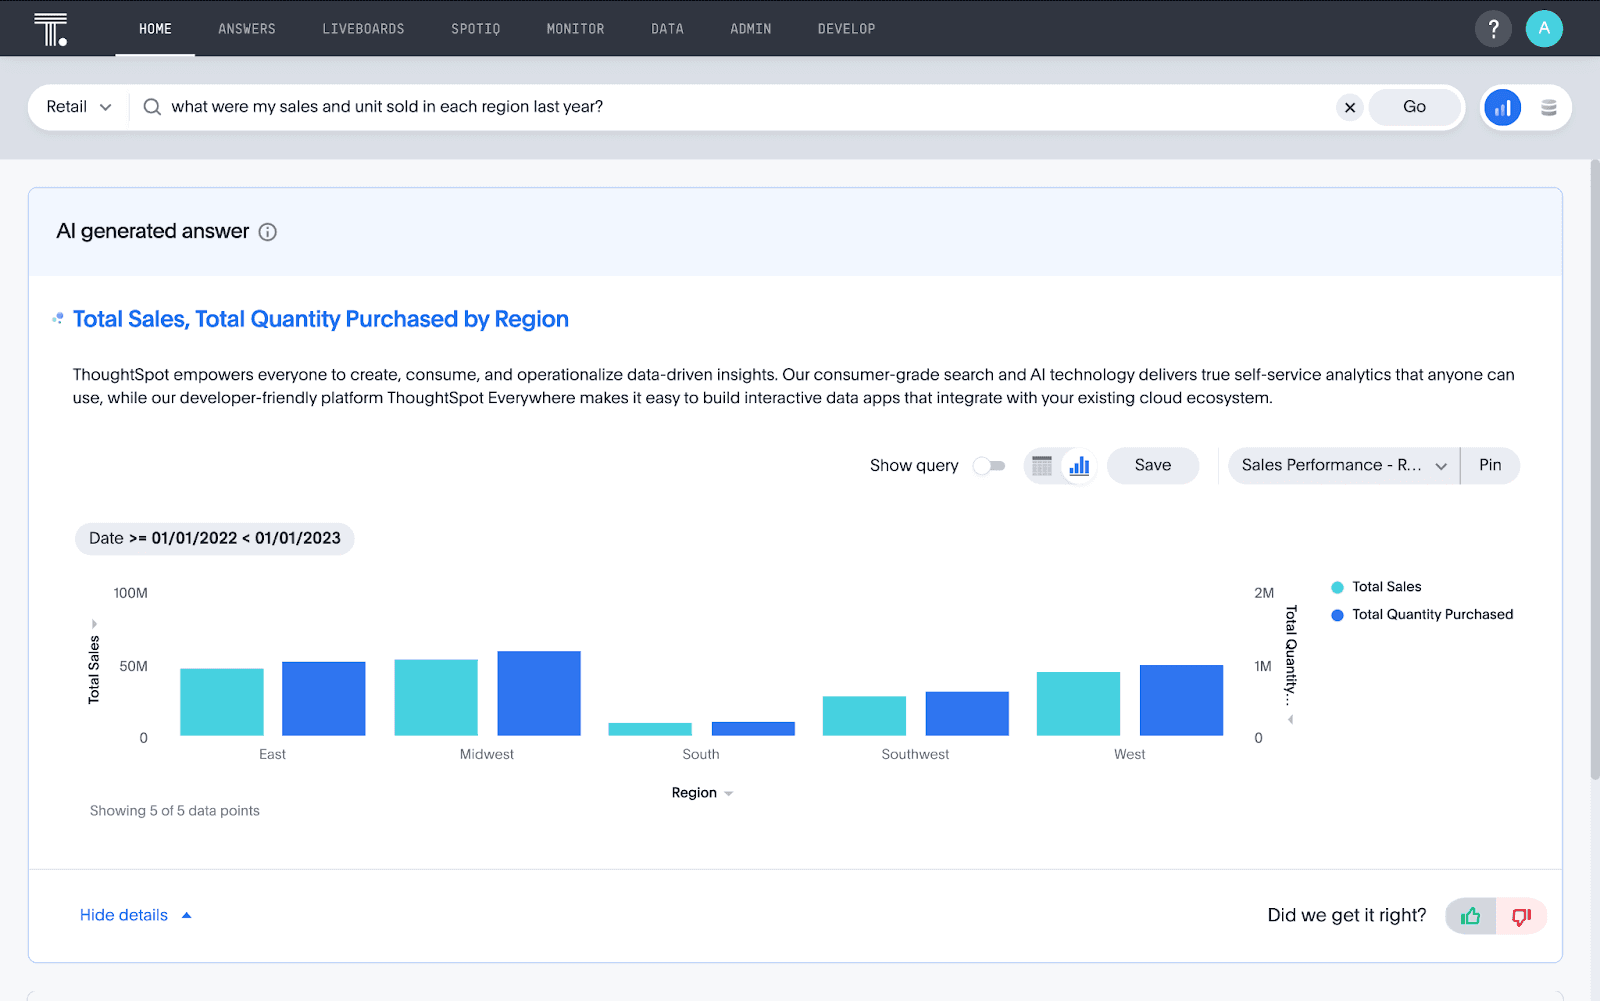
AI-Powered Insights (SpotIQ): The platform's AI engine automatically analyzes data to uncover hidden patterns, trends, and anomalies, providing users with actionable insights.
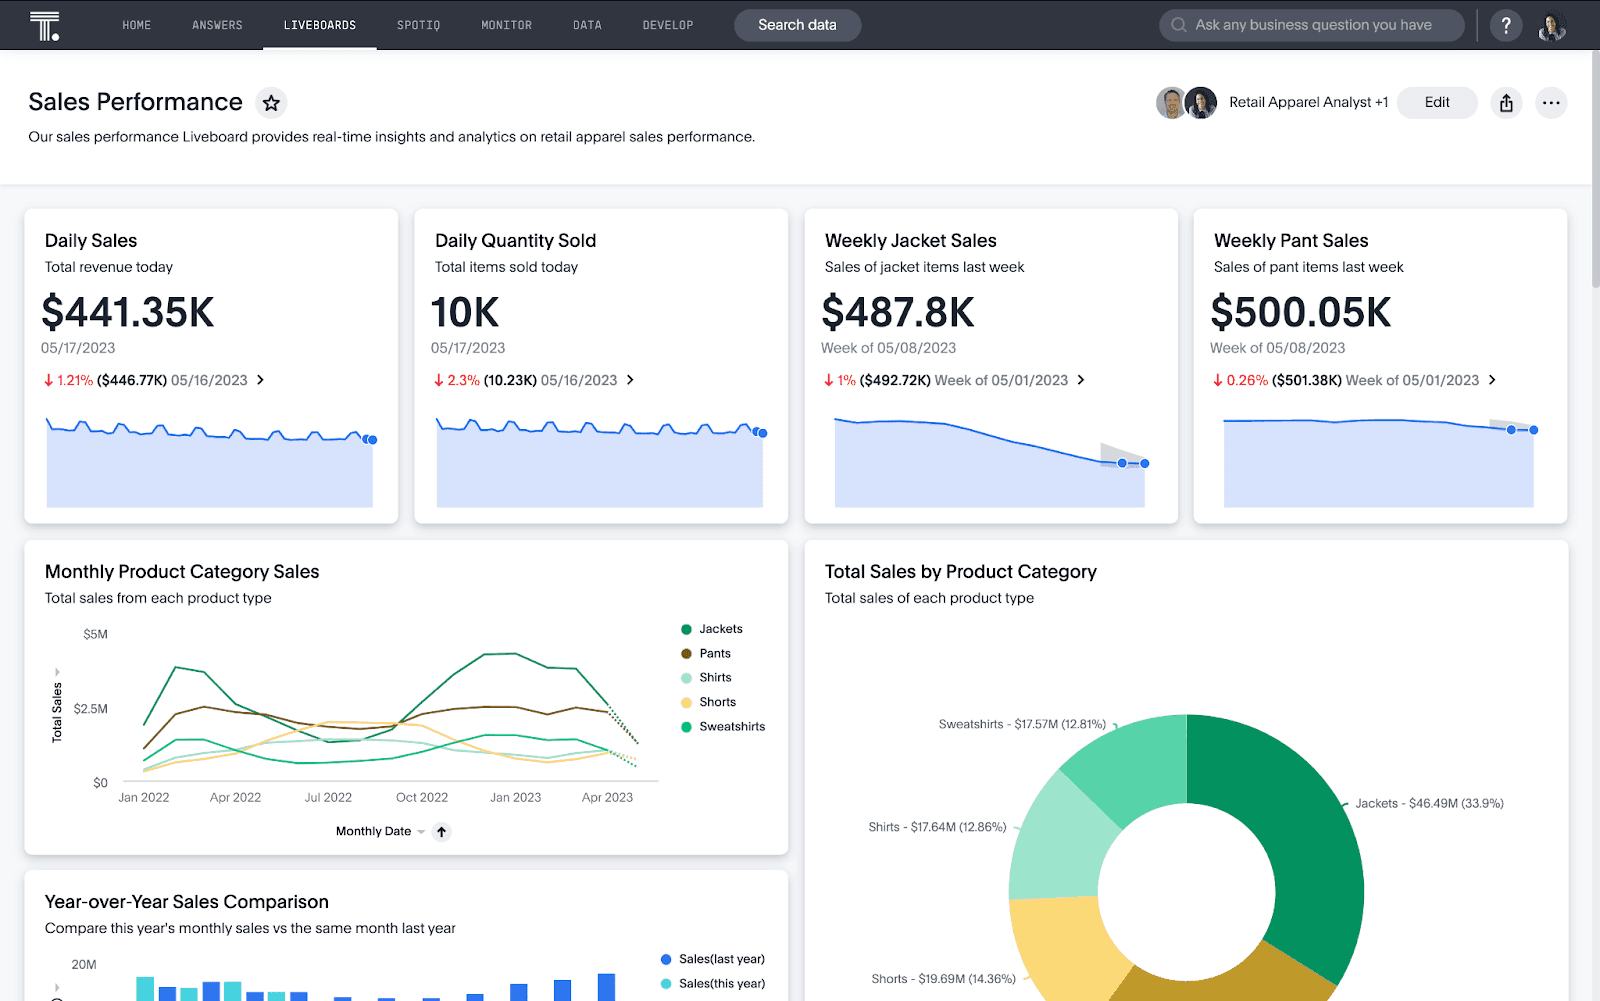
Interactive Liveboards: Unlike static dashboards, ThoughtSpot's Liveboards offer dynamic, real-time data visualizations that allow users to drill down into specific data points and customize views to meet their needs.
Data Integration: ThoughtSpot connects seamlessly with various data sources, including cloud data warehouses like Snowflake, Google BigQuery, and Amazon Redshift, allowing for comprehensive data analysis.
Mobile Accessibility: ThoughtSpot provides native mobile applications, enabling users to access and interact with data insights on the go.
These features help organizations make data accessible to everyone, support data-based decisions, and improve business insights.
Ideal Use Cases for ThoughtSpot
ThoughtSpot is particularly valuable when you want to empower non-technical users to explore and analyze data independently.
For instance:
Sales and Marketing Teams: These teams can pull up reports or customer insights without waiting on data analysts.
Retail and E-commerce Businesses: ThoughtSpot’s real-time capabilities can help track inventory, sales trends, and customer behavior, making it easier to respond to market shifts quickly.
Healthcare and Life Sciences: In industries dealing with large, complex data sets, ThoughtSpot allows users to analyze patient outcomes, operational metrics, or research data without complex workflows.
Overall, ThoughtSpot brings the power of data to every level of your organization. This makes it a very good tool for companies empowering their teams and facilitating data access.
ThoughtSpot Pricing Breakdown
ThoughtSpot splits its pricing into two product lines: ThoughtSpot Analytics for internal use, and ThoughtSpot Embedded for putting analytics inside your own application.
ThoughtSpot Analytics
Essentials: from $25 per user/month, billed annually. Built for small teams, supporting 5 to 50 users and up to 25 million rows of data. Includes dynamic interactive dashboards and automated insights.
Pro: from $50 per user/month, billed annually. Adds AI-powered dashboards, natural language search and data exploration, and Spotter AI Agents at 25 queries per month per user. Unlimited LLM tokens are included. Pro can be priced per user or by usage.
Enterprise: custom pricing. Unlimited users and data, with the same agent and search capabilities plus enterprise governance. Also available on a usage-based model.
ThoughtSpot Embedded
Developer: free for one year. Up to 10 users and 25 million rows, with embeddable dashboards, visualizations, and full API and SDK access. Aimed at individuals and small developer teams.
Enterprise: flexible pricing aligned to your use case, for multi-tenant applications at scale. Adds Spotter AI Agents with unlimited LLM tokens and Analyst Studio.
Current figures are on ThoughtSpot's pricing page. Two things worth noting when you budget. Essentials does not include Spotter, so agent capability starts at Pro. And the free Developer tier makes ThoughtSpot Embedded unusually cheap to evaluate if you are building customer-facing analytics.
User Reviews: Pros and Cons of ThoughtSpot
Here are the pros and cons of using ThoughtSpot based on user reviews on G2 and Reddit.
Pros
Natural Language Search: This feature lets users ask questions in plain English, making data easy to explore without needing technical skills.
Real-Time Analytics: Provides up-to-date insights with live data connections, supporting quick, data-driven decisions.
Straightforward Sharing: Liveboards can be shared across teams directly, keeping everyone working from the same view.
Ad Hoc Analysis: Users can quickly answer new questions without waiting on pre-built reports, enhancing flexibility.
Scalability: Handles large datasets efficiently, making it suitable for complex, high-volume data needs.

Cons
Natural Language Has Limits: Users report that plain-language querying handles direct questions well but struggles with complex or multi-step analysis. Much of this feedback predates the Spotter agent layer, so it is worth testing current behavior against your own questions rather than relying on older reviews.
Limited Visualization Customization: Users find ThoughtSpot's visualization options restrictive, with limited chart resizing and customization, making it hard to create tailored dashboards.
Data Modeling Issues: ThoughtSpot struggles with complex data modeling, especially when joining multiple tables, limiting its flexibility for more intricate data needs.
Setup and Administration Take Time: Asking questions is the approachable part. Configuring worksheets, managing permissions, and maintaining the underlying model are a different job, and users report a real ramp for whoever owns that.
High Maintenance Requirements: Often requires frequent manual adjustments to ensure optimal performance, which can be resource-intensive, especially for smaller teams.
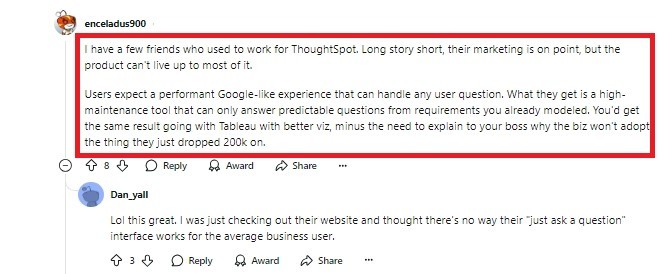
So, if you want non-technical users accessing data and running ad-hoc analysis without waiting on an analyst, ThoughtSpot is a strong fit.
If your priority is fine-grained visual control or modeling across many related tables, the constraints above are worth testing before you commit.
What Is Power BI?
Power BI is Microsoft’s business intelligence tool designed to help you quickly visualize and analyze data.
If you're familiar with other Microsoft products, you’ll find Power BI fits naturally within the Microsoft ecosystem, connecting seamlessly with tools like Excel, Teams, and Azure.
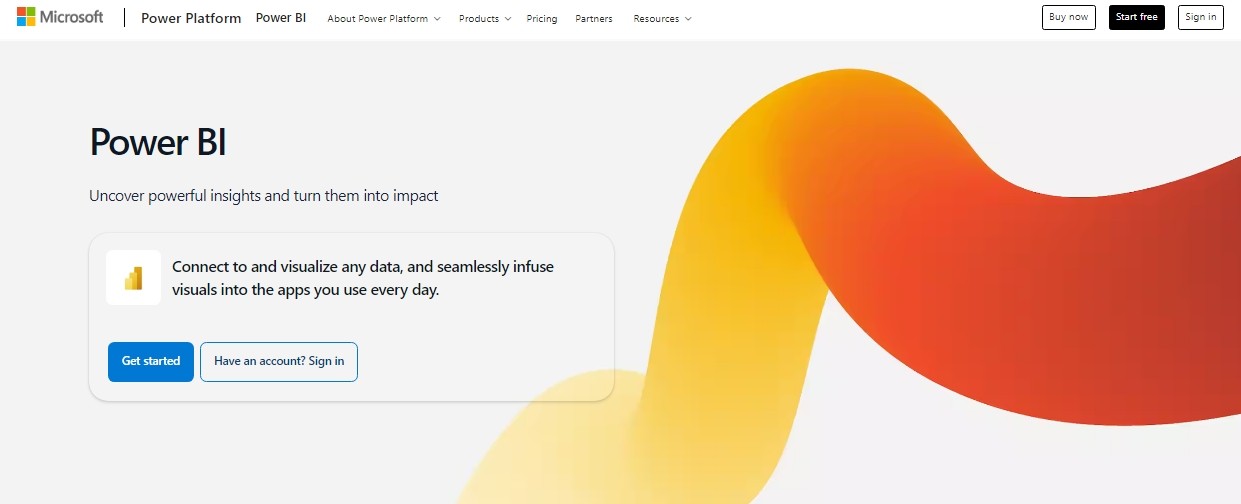
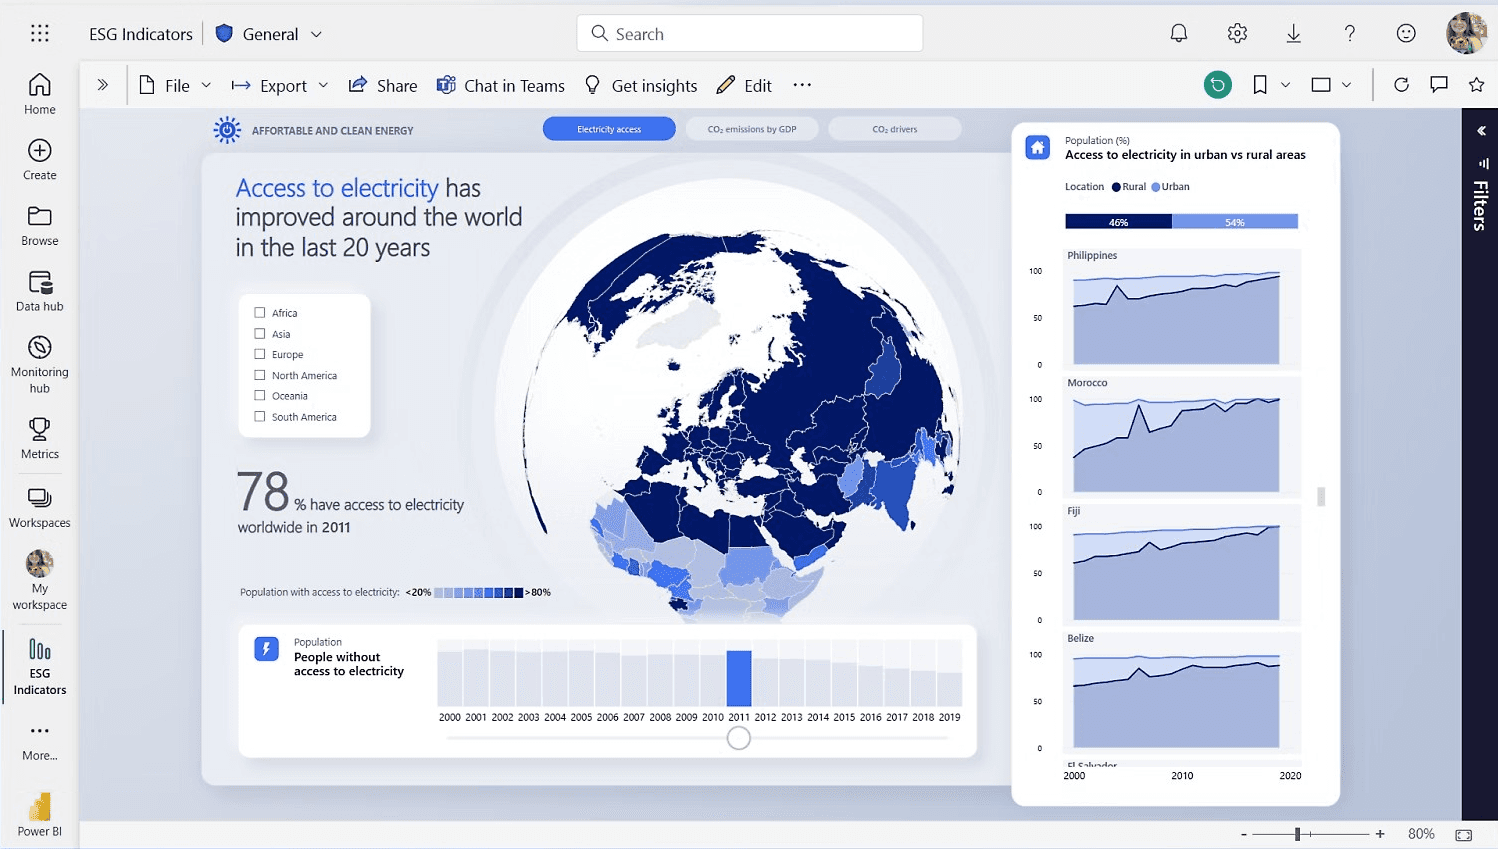
Power BI offers an interactive way to turn your data into meaningful visuals, making complex analytics accessible.
Key Features Of Using Power BI
Here are some of Power BI’s key features:
Comprehensive Data Visualizations: Power BI provides a broad range of visuals like bar charts, line graphs, scatter plots, and heat maps, allowing you to display data in ways that make insights easy to understand and act upon.
DAX for Advanced Analytics: Power BI uses Data Analysis Expressions (DAX), a powerful formula language that lets you create custom calculations and complex data models, making it easier to derive detailed insights.
Seamless Integration with Microsoft Tools: Power BI integrates smoothly with Microsoft applications like Excel, Azure, Dynamics 365, and Teams, making it easy to import data and share insights within the Microsoft ecosystem.
Real-Time Dashboards: With Power BI, you can create live dashboards that update in real time, providing current insights to help you make timely decisions.
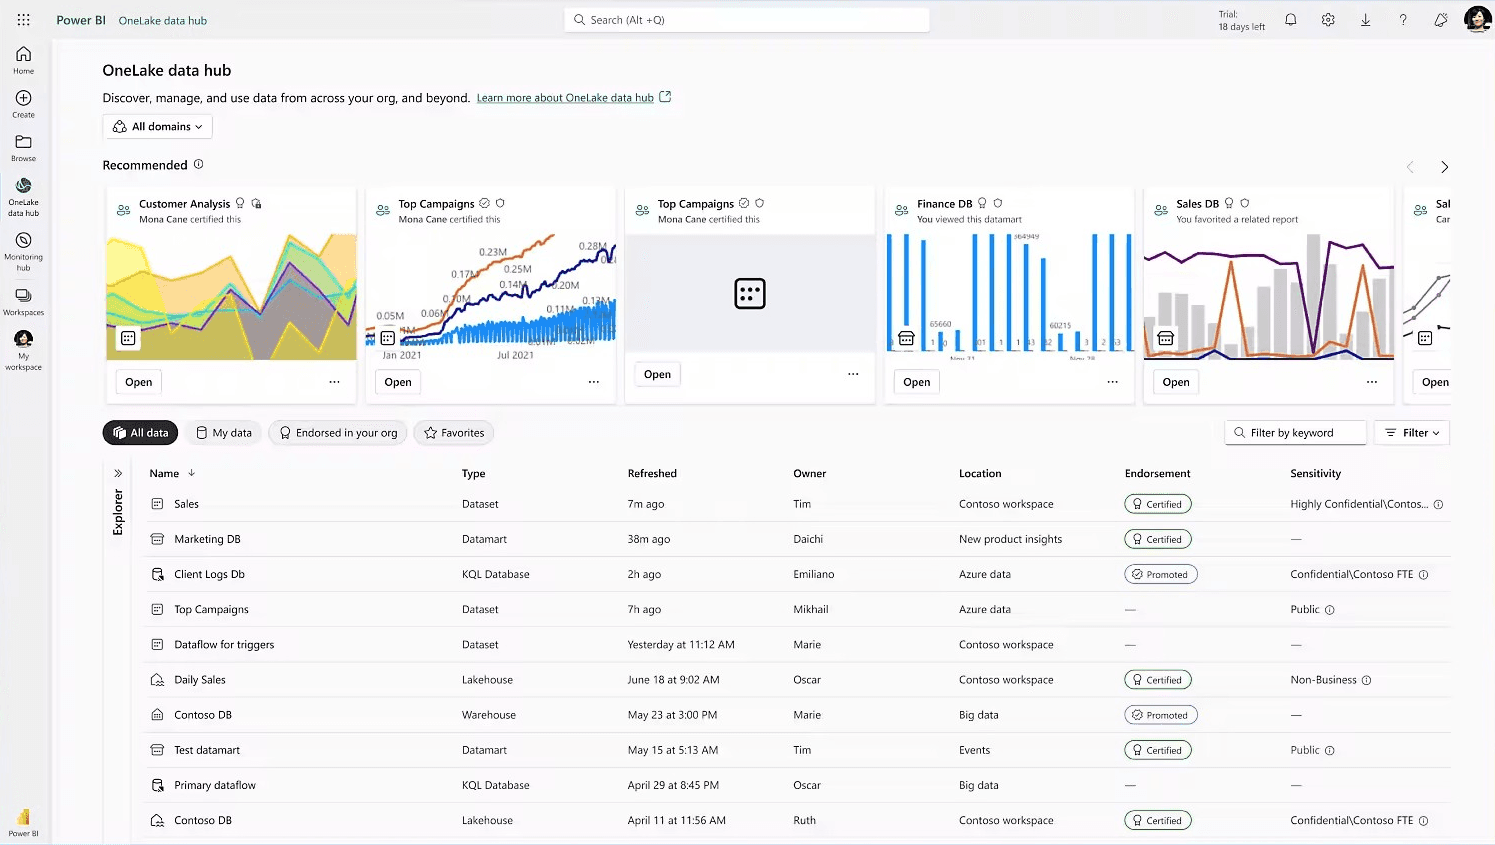
Data Connectivity: Power BI connects with numerous data sources, from Excel spreadsheets to cloud databases like Azure SQL and Google BigQuery, giving you flexibility in accessing your data.
Mobile Accessibility: Power BI offers mobile apps for iOS and Android, allowing you to access, view, and interact with your reports and dashboards on the go.
Together, these features make Power BI a versatile tool for businesses looking to improve data access, visualization, and decision-making across their organization.
Ideal Use Cases for Power BI
Power BI is suitable for businesses of all sizes, especially those already invested in the Microsoft ecosystem. Here are a few scenarios where Power BI excels:
Small Businesses: If you’re starting with business intelligence, Power BI offers an affordable way to visualize and analyze data.
Medium and Large Enterprises: Power BI’s advanced features, like DAX and Microsoft integrations, provide deeper insights that are useful for larger organizations with complex data needs.
Corporate Teams: Power BI allows you to embed reports directly into Microsoft Teams or SharePoint, making it easy for different departments to access and act on data.
By combining powerful visualization options, advanced analytics, and integration with Microsoft’s suite of tools, Power BI enables you to bring your data to life and make informed decisions.
Power BI Pricing Breakdown
Power BI publishes list pricing directly, which makes it one of the easier platforms to budget for.
Power BI Free: report creation in Power BI Desktop, visual analytics for personal use, limited data capacity, and no sharing or collaboration.
Power BI Pro: $14 per user/month, paid yearly. Publishing and sharing reports, collaboration in workspaces, and real-time data access. Also included in Microsoft 365 E5 and Office 365 E5.
Power BI Premium Per User: $24 per user/month, paid yearly. Everything in Pro plus larger model sizes, more frequent refreshes, and advanced AI and dataflow capabilities.
Power BI Embedded: variable, quoted separately. Dedicated capacity for embedding Power BI content into customer-facing applications, with XMLA endpoint support and licensing that does not require a seat per end user.
User Reviews: Pros and Cons of Power BI
Here’s a summary of the top pros and cons of Power BI, based on user reviews.
Pros
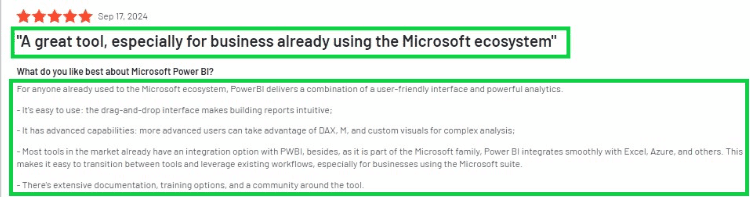
User-Friendly Interface: Drag-and-drop functionality makes it simple for anyone to build reports without needing technical expertise.
Microsoft Integration: Works seamlessly with Excel, Azure, and other Microsoft tools, streamlining data workflows.
Advanced Data Modeling: Tools like DAX and Power Query support complex analysis, offering deep insights.
Strong Community Support: Access to extensive resources and user forums provides help when needed.
Cons
Steep Learning Curve for Advanced Features: Mastering tools like DAX and Power Query can be challenging for new users without structured training.
Performance Issues with Large Datasets: When handling extensive data, Power BI can experience slowdowns and longer loading times, which may require optimization.
High Cost for Premium Features: While basic features are affordable, premium options can be pricey, especially for larger teams.
Limited Customization for Visuals: Some users find it restrictive compared to other BI tools regarding highly customized visualizations.
Dependence on Cloud Services for Sharing: Collaboration and sharing often rely on Power BI’s cloud services, which can be a limitation for organizations with strict on-premises policies.

Overall, Power BI offers powerful analytics and integration with Microsoft tools, making it popular for data visualization and reporting.
However, it has a steep learning curve, especially for advanced features, and can slow down with large datasets.
ThoughtSpot vs Power BI: Full Comparison Table
Attribute | ThoughtSpot | Power BI |
|---|---|---|
Ease of Use | Natural language search puts querying within reach of non-technical users. | Approachable for basic reporting; advanced work requires DAX and Power Query. |
Core Capabilities | Search-driven analytics, AI-generated insights, real-time Liveboards. | Broad visualization library, DAX for custom calculations, Power Query for data prep. |
Data Integrations | Cloud warehouses including Snowflake, BigQuery, and Redshift. | Deep integration with Excel, Azure, and Dynamics 365, plus a wide range of other sources. |
Embedded Analytics | Interactive analytics for customer-facing applications via APIs. | Power BI Embedded supports integration into applications, strongest for Microsoft-based teams. |
Data Modeling | Primarily schema-driven; users report difficulty with complex multi-table joins. | Strong modeling through DAX and Power Query, built for multi-source data. |
Customization and Visualization | More constrained; users report limited chart resizing and formatting control. | Extensive visual options and formatting control. |
Security and Governance | Role-based access, encryption, SSO, and enterprise compliance features. | Enterprise-grade security with role-based access, integrated with Microsoft security tooling. |
Pricing | Essentials from $25 per user/month; Pro from $50 per user/month; Enterprise quoted. Embedded has a free Developer tier. | Free tier; Pro at $14 per user/month; Premium Per User at $24 per user/month; Embedded quoted. |
Scalability | Built for real-time querying at scale, from smaller teams up to enterprise. | Scales well inside Microsoft infrastructure; larger datasets may need premium capacity. |
Best For | Teams that want non-technical users answering their own questions. | Microsoft-centric organizations that need depth in modeling and visualization. |
Both platforms carry real constraints. Power BI's depth sits behind DAX and Power Query, which take time to learn, and performance on large datasets depends on how carefully models are built. ThoughtSpot's search interface is genuinely approachable, but natural language struggles with complex questions, visual customization is limited, and modeling across multiple tables gets difficult quickly.
Something has shifted in this evaluation recently. Analytics decisions increasingly involve agent capabilities layered on top of the reporting tool, and the criteria for judging those are not the criteria for judging a dashboard builder. If that is part of your process, this guide to what to look for in an analytics agent platform covers the dimensions that apply.
Where Agentic Analytics Fits
ThoughtSpot has moved decisively in this direction. Its platform is now marketed as agentic, and Spotter AI Agents ship with Pro and above. That is a real product in the same conversation, not a bolt-on, and anyone evaluating agent capability should look at it seriously.
Upsolve AI builds context infrastructure for analytics agents, which is the layer underneath that problem. Here is the shape of it. Point any AI tool at your warehouse and it will return an answer in seconds. It will also query the deprecated orders table, treat "last quarter" as calendar rather than fiscal, and include the internal test accounts nobody remembers excluding. The query runs. The number is wrong. Nobody catches it until two reports disagree in front of the board.
That failure is not about model quality. It is about knowledge the model cannot reach: which table finance actually trusts, how your company defines an active customer, which exception applied to last year's Q3. That knowledge lives in analysts' heads, in Slack threads, and in a worksheet definition that stopped matching reality when someone renamed a column upstream.
Agent Studio is where a data team encodes that knowledge in a form an agent can use: metric definitions, validated query patterns, business rules, and guardrails on what the agent may answer. The Agentic Dashboard is the other side, where someone in finance or sales asks a question in plain language, or describes the dashboard they want built, instead of joining the reporting queue.
That knowledge is organized into three layers:
Structure: what data exists and how it connects.
Meaning: what a term like revenue means at your company specifically, not in general.
Trust: which answers have been checked by someone who would know.
Where platforms differ is not whether they have an agent. Increasingly they all will. The difference is how much of your institutional knowledge the agent can actually reach, and whether anyone has verified what it says. A capable agent sitting on top of a proprietary semantic model can only reason over what has been defined inside that model. Agents break down in production when Structure or Trust is missing, and Trust is the layer almost nobody builds.
Pricing: free tier, Pro from $500/month, Team at $2,000/month, which adds embedding, role-based access control, multi-tenant support, and semantic layer generation. Enterprise is custom. Annual billing is 20% off. Compliance controls for regulated environments are available.
None of this replaces ThoughtSpot or Power BI on a like-for-like basis, and it is not ranked against them here. If you need a search interface or a Microsoft-native reporting tool, the comparison above is the relevant one. If your recurring problem is that answers arrive fast but still get questioned, that is a different purchase.
Conclusion
ThoughtSpot and Power BI both work, and the choice comes down to who is asking the questions.
Choose ThoughtSpot if the people who need answers are not the people who build reports, and if agent-driven querying is central to what you want. Pricing is per user and published from Essentials up, though Spotter starts at Pro. Budget for the setup work behind the search box. The free Developer tier on ThoughtSpot Embedded also makes it inexpensive to trial if you are building customer-facing analytics.
Choose Power BI if your organization already runs on Microsoft, if you have or can build DAX skills, and if you want published per-seat pricing you can model before talking to anyone.
If neither feels right, the reason is often that the bottleneck is not the reporting tool at all. It is that every question requires someone who knows the data to be available, and that person has a queue. Neither a search box nor a formula language fixes that on its own.

Try Upsolve for Embedded Dashboards & AI Insights
Embed dashboards and AI insights directly into your product, with no heavy engineering required.
Fast setup
Built for SaaS products
30‑day free trial