
Compare top BI tools for financial services—risk, compliance, forecasting, and real-time dashboards—plus why Upsolve AI fits embedded fintech analytics.

Ka Ling Wu
Co-Founder & CEO, Upsolve AI
10 min

Disclosure: This article is published by Upsolve AI. Where our product is mentioned alongside competitors, we aim to provide balanced coverage based on publicly available information. We encourage readers to evaluate all options independently.
Financial institutions no longer rely on spreadsheets alone.
Business intelligence in financial services enables banks, insurers, and fintechs to:
Monitor risk and prevent fraud in real time
Ensure accurate reporting and regulatory compliance
Gain actionable insights into customer behavior and investments
This guide highlights 9 BI tools that help financial teams make smarter, faster decisions while supporting both enterprise and SaaS-based workflows.
TL;DR |
|---|
|
Why is Business Intelligence needed in Finance?
Business Intelligence is essential in finance because it helps teams make faster, more accurate, and data-driven decisions.
BI centralizes financial data, automates reporting, and provides real-time visibility into revenue, costs, cash flow, and risks.
Key reasons:
Real-time insights: Instant visibility into financial performance.
Accurate forecasting: Better planning using trends and automated models.
Automated reporting: Saves hours spent on manual spreadsheets.
Risk detection: Identifies anomalies, compliance issues, and fraud early.
Cost control: Highlights inefficiencies and low-margin areas.
Leadership decisions: Gives CFOs clear dashboards for quick strategic actions.
AI-driven business intelligence helps financial teams because it can:
Analyze large financial datasets quickly
Detect patterns like rising credit risk or unusual transactions
Give early signals of potential fraud or operational issues
Highlight areas where investment performance or cash flow needs attention
Reduce time spent on repetitive reporting and manual reconciliations
Help finance teams make decisions based on data, not assumptions
This makes financial operations faster, more accurate, and data-driven, especially for teams managing complex transactions and regulatory requirements every day.
Key Features to Look for in Financial BI Tools
When evaluating BI for financial services, teams should prioritize features that ensure accuracy, security, and actionable insights.
Strong data governance is essential, so we looked for encryption, role-based access, and controls that can safely handle sensitive financial information.
We measured scalability and cloud integration to ensure the platform can process large, complex financial datasets securely as volumes grow.
We looked for built-in support that makes regulatory reporting easier, including clear audit trails and required documentation.
Real-time dashboards were important so teams can see trading, cash flow, and portfolio changes as they happen.
The tools needed strong AI features that can predict trends, spot fraud, and help with credit or investment decisions.
For fintechs and SaaS products, we made sure the tool could embed dashboards directly into the product for end users.
These features help financial institutions choose BI tools that drive smarter, faster, and compliant decision-making.
Top 9 Business Intelligence Tools for Financial Services
Tool | Financial Analytics Suits | Ease of Financial Data Setup | Type of Insights for Finance | Dashboard Flexibility | Financial-Specific Limitations | |
|---|---|---|---|---|---|---|
Power BI | Strong for enterprise finance teams | Easy within Microsoft ecosystem | KPI dashboards, forecasting, AI insights | Flexible with familiar Excel interface | Embedding dashboards requires developer effort | |
Tableau | Ideal for investment and risk teams | Moderate, multiple source connections | Trend analysis, portfolio visualization, predictive analytics | Flexible with drag-and-drop design | Limited built-in compliance features | |
Qlik Sense | Best for compliance and audit teams | Setup requires data modeling | Regulatory reporting, anomaly detection, risk patterns | Flexible but setup-intensive | Multi-source integration may be complex | |
Sisense | Suitable for embedded financial dashboards | Manual modeling of datasets needed | Live analytics, custom dashboards, multi-tenant support | Highly flexible with SDKs | No ready-made financial templates | |
Looker | Great for cloud-native fintechs | Requires LookML modeling | Governed metrics, investment and customer insights | Flexible semantic layer dashboards | Needs modeling expertise | |
Domo | Executives and cross-department reporting | Simple cloud-native setup | Real-time KPIs, alerts, collaborative dashboards | Moderate flexibility | Less suitable for embedded apps | |
ThoughtSpot | Analysts needing AI-driven insights | Connects to multiple data sources | Search-driven, ad-hoc financial queries | Self-service exploration | Heavy AI workflows may overwhelm simple reporting | |
Zoho Analytics | Small and medium-sized financial firms | Easy setup with automation | Forecasting, performance tracking, white-labeled dashboards | Moderate flexibility | Limited advanced analytics features | |
SAP Analytics Cloud | Large banks and insurers | ERP and enterprise integration | Unified planning, budgeting, and forecasting | Flexible enterprise dashboards | Primarily suited for large enterprises |
1. Power BI
Power BI is a leading analytics platform for banks, investment firms, and large financial institutions, helping teams consolidate data, track KPIs, and visualize insights across multiple systems.
It allows finance teams to connect ERP, accounting, and banking systems, create interactive dashboards, and use AI-assisted insights for revenue, risk, and portfolio performance.
Executives can get real-time financial overviews, while analysts explore trends and anomalies easily.
Key Features |
|---|
|
Limitations
Embedding dashboards in client-facing applications requires developer resources and technical setup.
Requires an active Azure subscription and Power BI tenant configuration before embedding.
Embedding scenarios may still need Power BI Pro licenses for creators.
Works only as an embedding layer, dashboards must be built in Power BI beforehand.
Consumption-based costs fluctuate based on workload and capacity usage.
Pricing
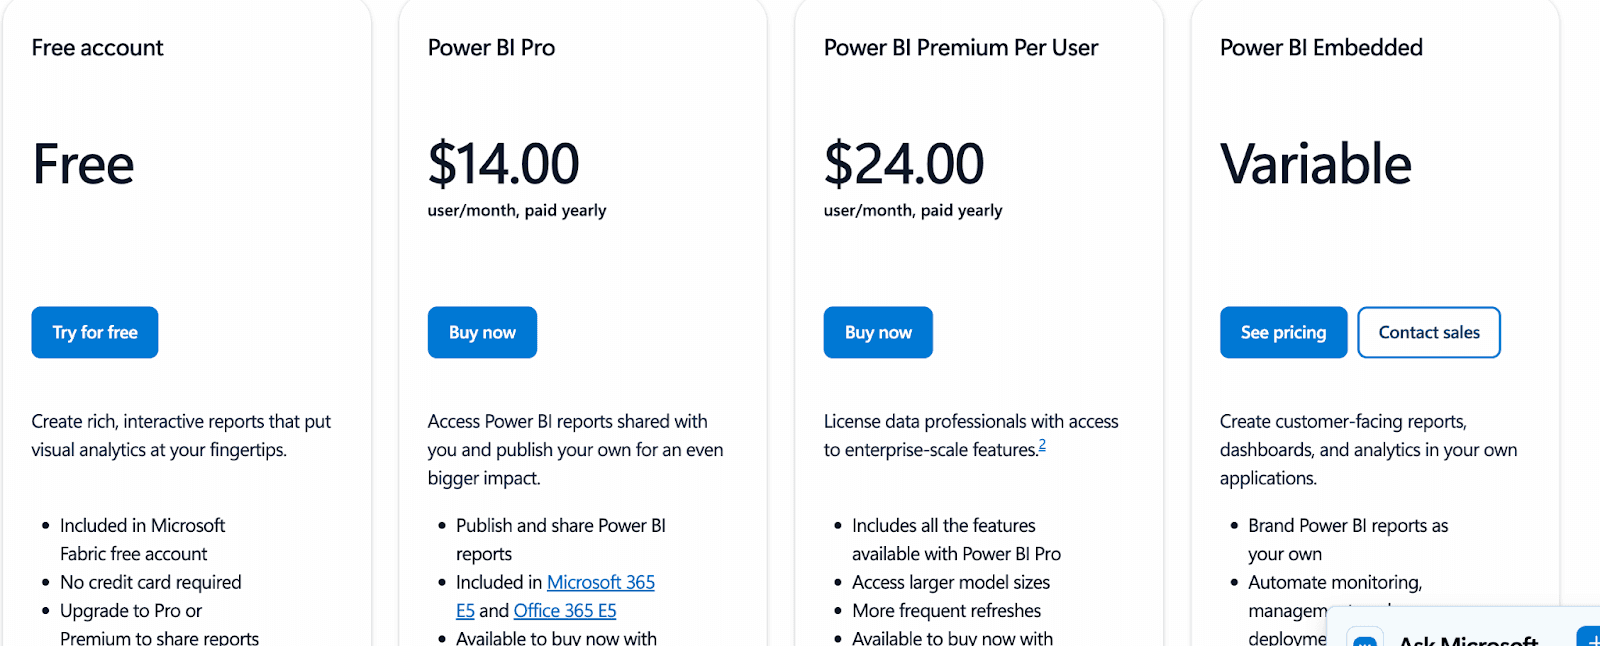
Free Account: Free, Offer interactive reports for a few days then need to upgrade to Pro Premium to share records.
Pro: $14/user/month, offering standard reporting and collaboration
Premium Per User (PPU): $24/user/month, providing advanced analytics, larger datasets, AI features
Embedded / Capacity: Custom pricing for large-scale or client-facing deployments
2. Tableau
Tableau is a powerful analytics and visualization platform used by investment, risk, and banking teams to explore complex financial data and uncover trends.
It enables finance teams to connect multiple data sources, create interactive dashboards, and perform predictive analytics for portfolio performance, credit risk, and revenue forecasting.
Users can explore insights with drag-and-drop simplicity while maintaining strong governance for compliance reporting.
Key Features
Connects to ERP, CRM, data warehouses, and accounting platforms for unified financial reporting
Delivers interactive dashboards for revenue performance, portfolio monitoring, and risk analysis
Provides predictive forecasting and trend modeling through built-in analytics and statistical tools
Offers a drag-and-drop interface that simplifies dashboard and report creation for analysts
Supports row-level security, role-based access, and strong governance for compliance-heavy environments
Available in both cloud and on-premise deployments for regulated financial institutions
Allows automated report delivery and scheduled data refreshes for always-up-to-date insights
Integrates with R and Python for advanced quantitative modeling and financial simulations
Supports real-time data connections for trading analytics, cash flow visibility, and operational monitoring
Limitations
Tableau is primarily a visualization platform, so financial KPIs and dashboards must be manually designed for banking, investment, or risk analysis.
Complex multi-source data integrations (ERP, CRM, trading systems) may require technical expertise.
Pricing
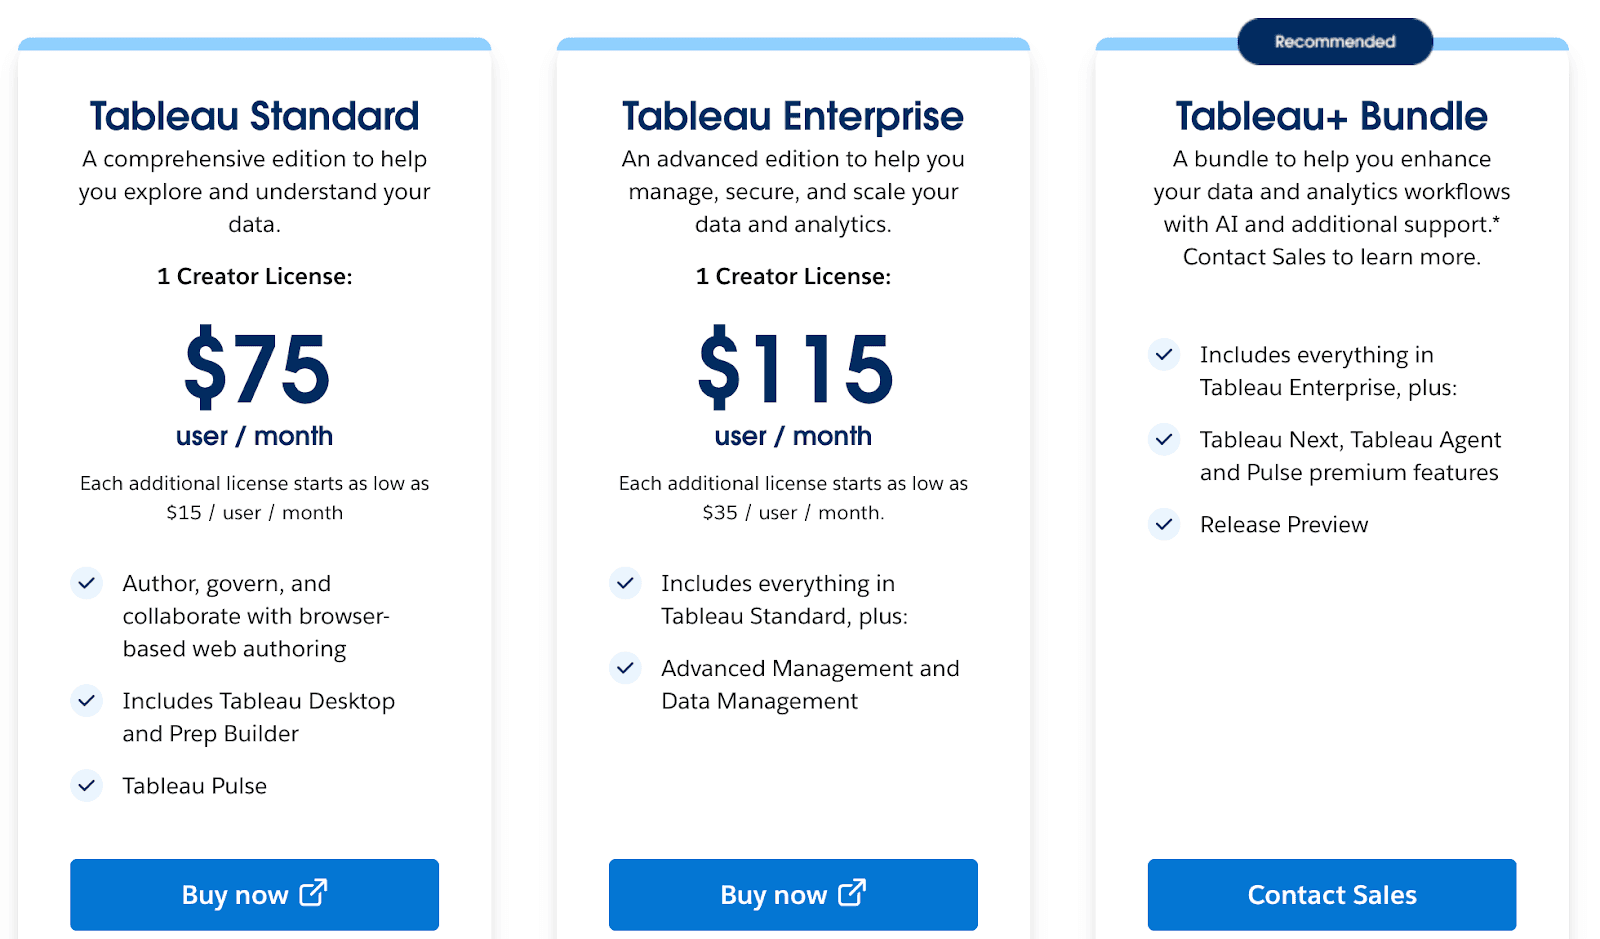
Standard Creator: $75/user/month; additional licenses from $15/user/month
Enterprise Creator: $115/user/month; additional licenses from $35/user/month
Tableau+ Bundle: Includes Tableau Cloud, Tableau Next, Agentforce, Pulse premium, and Data 360; contact sales for pricing
3. Qlik Sense
Qlik Sense is an AI-enabled platform for business intelligence in financial services, offering robust on-premise analytics for regulated teams.
It helps finance and risk functions analyze complex datasets and build compliant, secure dashboards with ease.
It allows teams to connect multiple data sources, analyze structured and unstructured data, and create interactive dashboards for revenue tracking, credit risk, and investment performance.
Finance teams can leverage GenAI features, predictive analytics, and automation to streamline reporting and decision-making.
Key Features
AI-powered dashboards and visualizations for financial metrics
Predictive analytics and GenAI for investment and risk insights
Automated report generation and delivery
No-code automation for dynamic actions across systems
Governance and collaboration spaces for secure data sharing
Integration with ERP, SaaS, and legacy financial systems
Cloud deployment with Qlik Talend Cloud connectivity
Guided onboarding and 24x7 critical support (Standard and above)
Limitations
Qlik Sense is a broad analytics platform, so financial dashboards must be built and configured manually.
Starter or basic setups may have limitations on data capacity and app sizes, affecting large-scale financial analysis.
Pricing

Starter: $200/mo — 10 users, 25 GB, AI analytics, dashboards
Standard: $825/mo — 25 GB, GenAI insights, automation, governance
Premium: $2,750/mo — 50 GB, predictive analytics, SAP integration
Enterprise: Custom — 250 GB+, advanced AI, multi-region deployment
4. Sisense
Sisense is an embedded analytics platform designed for finance teams and SaaS providers to deliver customizable, AI-powered dashboards within applications.
It allows financial organizations to embed analytics directly into client-facing portals, explore revenue, risk, and portfolio metrics, and use AI-driven insights to monitor trends and anomalies.
Analysts and executives can build dashboards with minimal coding, while developers have flexibility for deeper customization.
Key Features
AI-driven tools for modeling, visualizing, and customizing analytics
Sisense Intelligence for guided, insight-ready analysis
Fully embeddable analytics for modern applications and workflows
Simplified dashboard creation and end-to-end analytics development
Broad data connectivity for unifying sources across systems
Designed to deliver complete analytics experiences with reduced complexity
Cloud-ready, composable architecture for scalable deployments
Limitations
Sisense is primarily designed for embedded and client-facing analytics, so internal-only financial dashboards may need extra configuration.
Advanced customization for complex financial metrics may require developer involvement.
Connecting multiple ERP, banking, or legacy systems can require technical setup before dashboards are fully operational.
Some finance-specific reporting templates are not built-in and must be created from scratch.
Pricing
Entry-level self-hosted deployments: $10,000/year
Small-team cloud deployments: $21,000/year
Mid-to-large setups / “Advanced” packages: $40,600 – $109,000/year, depending on user count, data complexity, and features.
Organizations needing full capacity (many users, heavy data, AI/ML features): higher custom quotes — actual cost depends heavily on scale, data volume, and custom needs.
For more detailed breakdowns and the full context around Sisense pricing estimates, check out the original blog post here |
5. Looker
Looker (by Google Cloud) is a data-centric analytics and BI platform ideal for financial operations teams that need governed, scalable insights.
It allows finance teams to model data centrally using LookML, build interactive dashboards, and perform real-time analysis across multiple data sources.
Analysts can explore revenue, risk, and investment KPIs while maintaining strong compliance and data governance.
Key Features
A unified LookML semantic layer that centralizes business rules and data logic
Real-time, governed visibility into data spanning multiple cloud environments
Proactive insights, automated alerts, and rich integrations across ecosystems
No-stale-data reporting with tools to build accurate reports and dashboards
Embedded analytics that plug directly into apps, products, and workflows
Seamless interoperability between Looker and Looker Studio for governed + self-serve reporting
The option to launch and manage Looker directly within the Google Cloud console
Limitations
Dashboards and KPIs for banking, investment, or risk teams must be manually configured, as Looker is not finance-specific.
Advanced features like semantic modeling, multi-cloud integrations, and complex data transformations require significant setup.
Pricing
Here are the Looker pricing estimates, with a clear nudge toward the full breakdown:
Standard Edition: ~$5,000/month
Embed Edition: ~$50,000/year
Enterprise Edition: Custom quote required
Extra Costs:
Setup: $5,000–$20,000
Training: $500–$5,000
Premium support: $1,000–$5,000/year
For a deeper, more detailed breakdown, you can read the full analysis here ➝ |
6. Domo
Domo is a cloud-based, end-to-end analytics platform used by financial teams to centralize data, automate reporting, and build real-time dashboards.
It helps finance teams unify data from ERP systems, banking feeds, forecasting tools, and spreadsheets into one governed layer.
With built-in automation, alerts, and collaboration features, Domo enables faster decision-making across FP&A, compliance, and executive reporting workflows.
Key Features
Real-time dashboards for revenue, expense, and cash-flow tracking
Data integration across ERP, CRM, banking APIs, and cloud finance tools
Magic ETL for preparing financial data without coding
Automated alerts for anomalies in key financial metrics
Built-in forecasting and statistical functions for FP&A teams
App Studio for building finance-specific internal apps and workflows
Collaboration tools for sharing insights across finance and leadership
Governance controls for secure financial data management
Limitations
Financial models and dashboards must often be built manually, which can be time-intensive for smaller teams.
Large financial datasets may require optimization and ETL planning to maintain performance.
Pricing
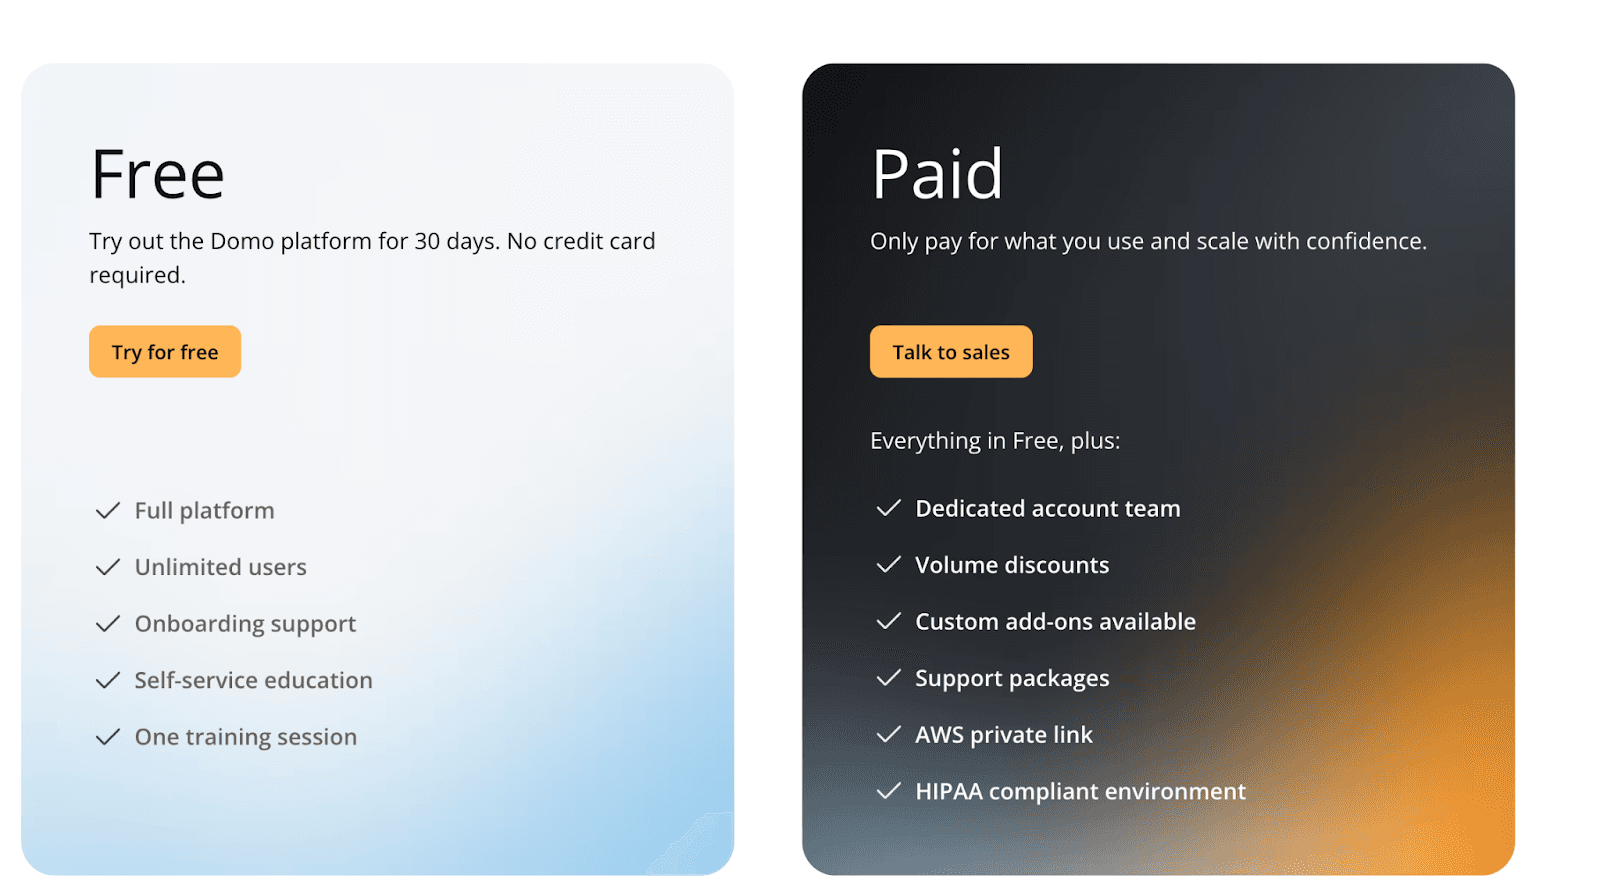
Free Plan – 30-day trial with full platform access, onboarding support, and unlimited users.
Paid Plan (Quote-based) – Includes everything in Free plus a dedicated account team, volume discounts, custom add-ons, enhanced support, AWS PrivateLink, and HIPAA-compliant environments.
Pricing is not publicly listed; organizations must contact Domo for a customized quote based on deployment size and data needs.
7. ThoughtSpot
ThoughtSpot is a search-led, AI-powered analytics platform designed for finance teams that need fast answers across large and complex datasets.
With natural language search, automated insights, and agentic AI capabilities, it helps finance teams explore revenue trends, risk signals, margin changes, and investment performance without relying on BI specialists.
Key Features
Search-driven financial analytics with instant query responses
AI-generated insights, anomaly detection, and narrative summaries
Live dashboards for revenue, cashflow, and risk metrics
Spotter AI Agent for automated question answering
Integrates with major cloud warehouses (Snowflake, BigQuery, Redshift)
Embedded analytics for client-facing finance dashboards
Automated pattern detection (SpotIQ) for uncovering financial trends
Role-based governance for secure access to sensitive financial data
Limitations
Search-first workflows may struggle with multi-step financial models or layered calculations.
Some AI insights require clean modeling and data preparation to work effectively.
Large financial datasets may need warehouse optimization for best performance.
Pricing
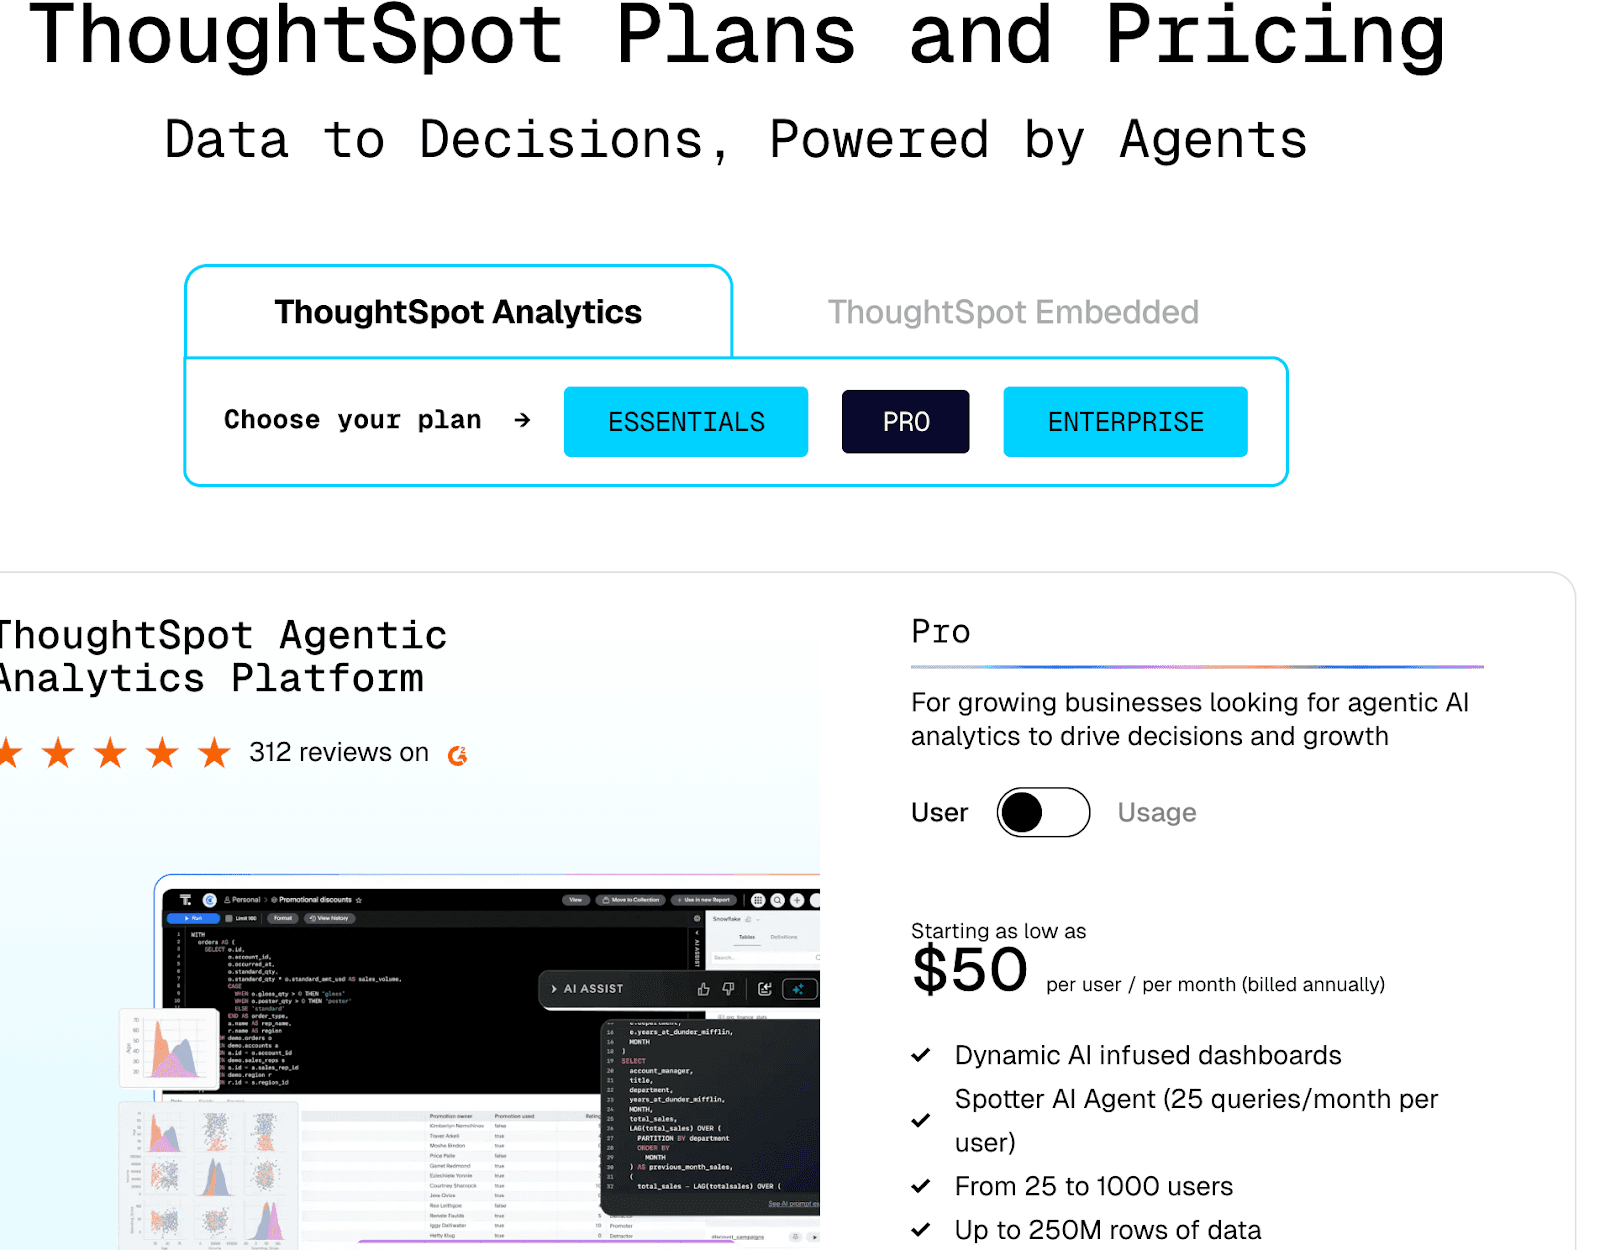
ThoughtSpot pricing for both categories:
ThoughtSpot Analytics
Essentials: $25/user/month (billed annually) — Dynamic dashboards, actionable insights, 5–50 users, up to 25M rows of data.
Pro: $50/user/month (billed annually) — AI-infused dashboards, Spotter AI Agent (25 queries/month per user), 25–1000 users, up to 250M rows of data.
Enterprise: Custom pricing — Unlimited users, unlimited data, full AI analytics and dashboards.
ThoughtSpot Embedded
Free: Up to 10 users, 25M rows, embeddable AI dashboards.
Paid (Custom Quote): Unlimited users, full embeddable AI, Spotter Agent, Analyst Studio, and usage-based scaling.
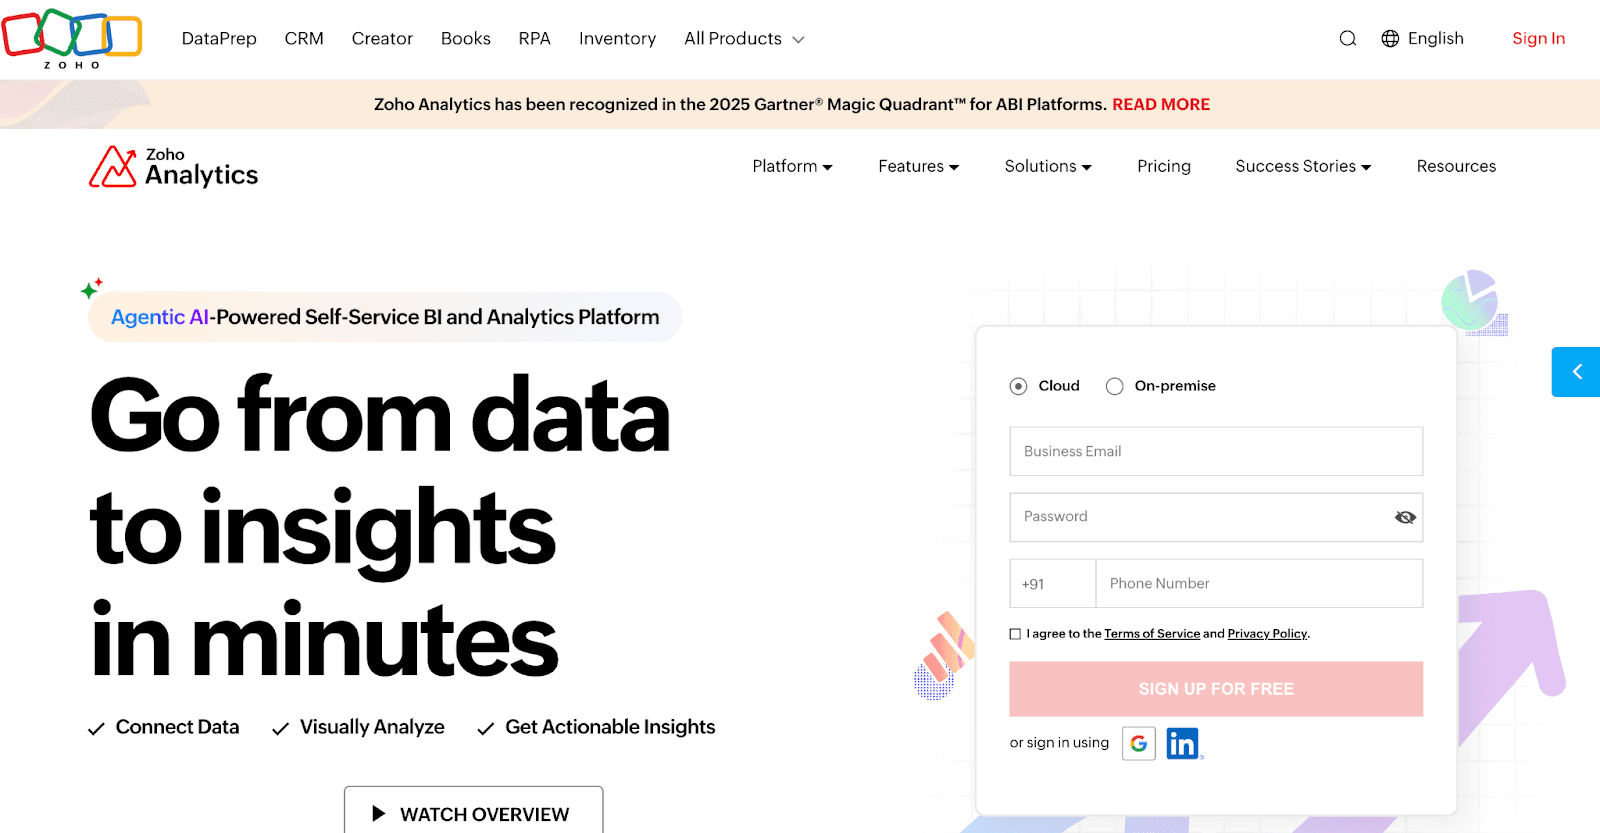
8. Zoho Analytics
Zoho Analytics is a self-service BI platform widely used by finance teams to consolidate multi-source financial data, automate reports, and build dashboards for revenue, expenses, profitability, and cash-flow insights.
Finance teams can connect Zoho Analytics to ERPs, accounting systems, and spreadsheets to build unified financial views.
With forecasting, AI insights, and automation, it streamlines monthly reporting, variance analysis, and executive dashboards.
Key Features
Prebuilt dashboards for revenue, P&L, budgeting, and cash-flow tracking
AI assistant (“Zia Insights”) for automated financial insights and variance explanations
250+ data connectors including accounting tools, ERP systems, and databases
Automated scheduled reports for monthly and quarterly finance cycles
Drag-and-drop dashboard builder for FP&A and operational finance teams
Built-in forecasting models for trend analysis and planning
Role-based sharing and governance for secure financial reporting
Embedded analytics for internal portals or client-facing platforms
Limitations
Complex financial datasets may require manual data modeling before analysis.
Large-scale data refreshes can slow down without optimized pipelines.
Some deep financial workflows (e.g., regulatory reporting) need external systems and cannot be built natively.
Pricing
Here’s Zoho Analytics pricing:
Always Free Plan ($0/month): 2 users, 10,000 rows, 5 Workspaces
Paid Plans: Start at $24/month (billed annually) – 2 users, 500,000 rows, unlimited Workspaces
Top-tier Plan: Up to $45/month (billed annually) – scales with users, rows, and Workspaces.
9. SAP Analytics Cloud (SAC)
SAP Analytics Cloud is a unified analytics and planning platform widely adopted by finance, FP&A, treasury, and risk teams for integrated reporting and forecasting.
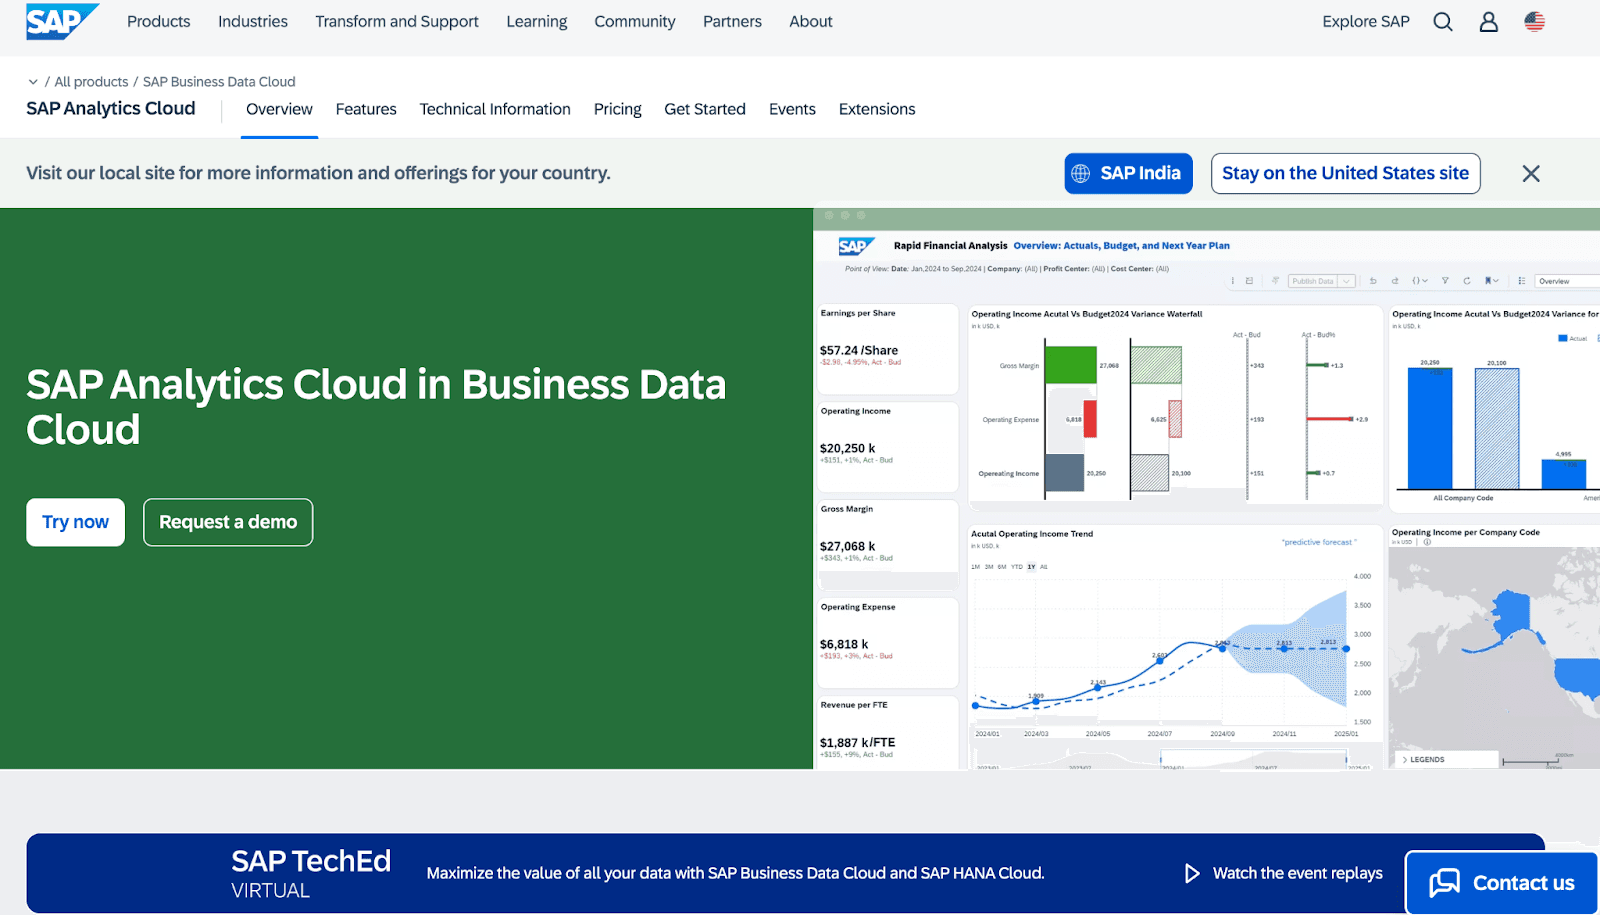
It connects seamlessly with SAP ERP, SAP S/4HANA, SAP BW, and non-SAP systems to help finance teams build real-time dashboards, automate planning cycles, run predictive forecasts, and unify budgeting and performance management in one workspace.
Key Features
Integrated planning + analytics designed specifically for financial workflows
Native connectivity with SAP S/4HANA, SAP ERP, SAP BW, and cloud finance apps
Predictive forecasting for revenue, cost drivers, and cash-flow trends
Real-time dashboards for P&L, balance sheet, and operational metrics
Built-in financial functions for budgeting, allocations, and scenario modeling
Role-based access and governance for sensitive financial data
Collaboration tools for finance teams to coordinate plans and approvals
Automated data refresh and live connections for up-to-date reporting
Limitations
Works best within the SAP ecosystem; connecting non-SAP financial systems may require additional setup.
Performance may vary when handling extremely large or highly granular financial datasets.
Pricing
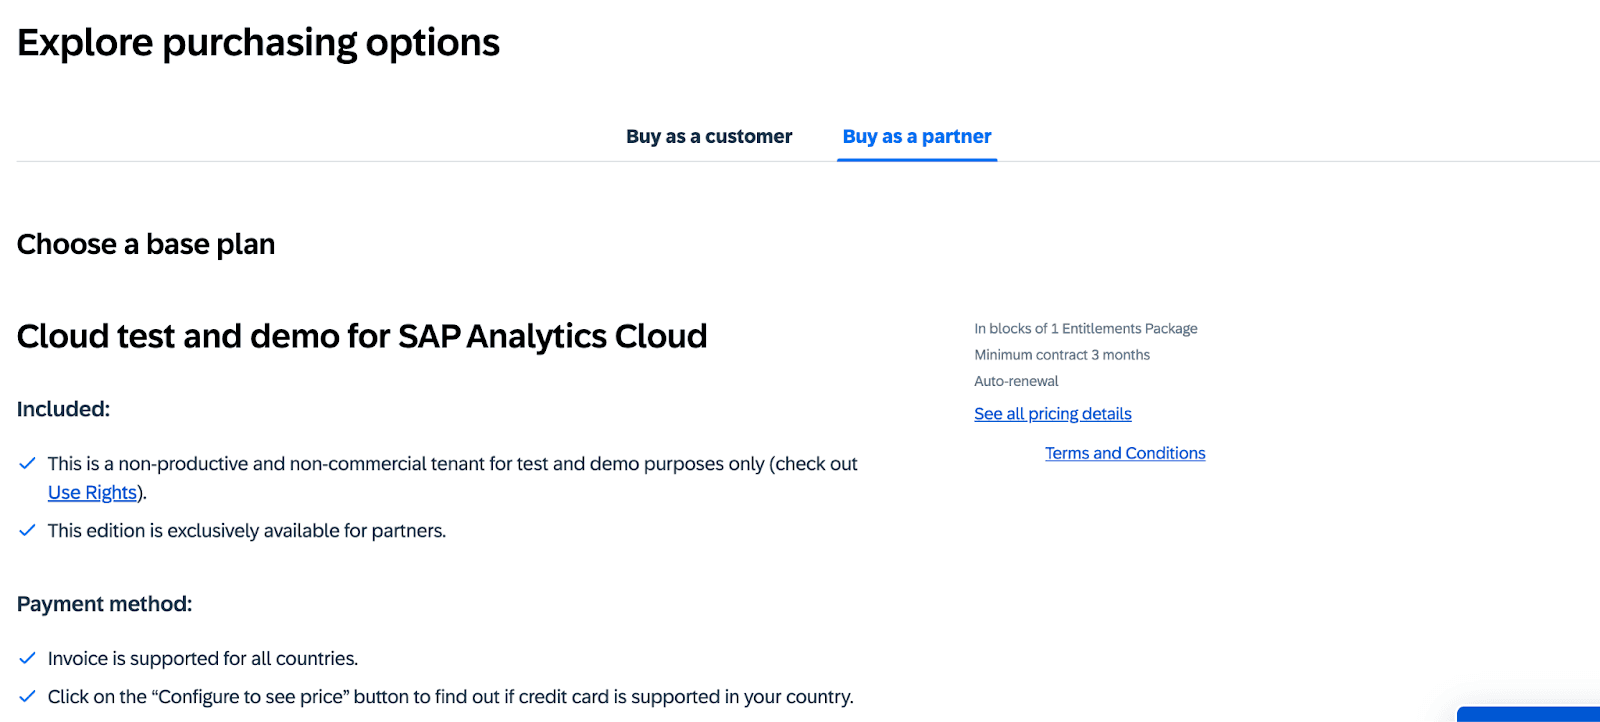
SAP Analytics Cloud does not publish fixed pricing publicly.
Licensing is available through Pay-As-You-Go for SAP BTP or via a SAP BTP Enterprise Agreement.
Where Upsolve AI Fits: Embedded, Customer-Facing Financial Analytics
The tools above are built mainly for internal financial reporting, planning, and risk analysis. There is a related but different job: giving your own customers or end users analytics inside your fintech or financial product rather than in a separate BI seat. That is the use case Upsolve AI is built for.
Upsolve AI is an agentic analytics platform for embedding analytics into a product. Instead of shipping one fixed dashboard, you embed a component (React or iFrame) and each user gets a role-aware view, for example an account holder, a lending customer, or an internal risk lead, plus a natural-language layer for follow-up questions. Your team encodes the metrics and business rules so those answers stay accurate. For fintech and financial SaaS platforms, that means customers can track spending, credit usage, or portfolio performance inside your app without you building and maintaining a separate dashboard for every account. For regulated workflows, it supports VPC, private cloud, and on-premise deployment.
It is not a core banking system, an ERP, or a replacement for internal enterprise BI. It is the embedded, customer-facing analytics layer that sits on top of your financial data.
Conclusion
Business intelligence has become a foundational capability for modern financial institutions.
Whether the goal is improving profitability, strengthening risk oversight, or powering better customer experiences, the right BI platform helps teams turn complex financial data into clear, actionable insights.
Traditional BI tools like Tableau, Power BI, Qlik, Domo, SAP Analytics Cloud, and Looker give finance teams strong analytical depth across reporting, forecasting, and risk.
BI is no longer just a reporting layer,it’s becoming a core driver of operational efficiency, compliance readiness, and customer trust in the financial sector.
FAQs
1. What is business intelligence in financial services?
Business intelligence helps financial institutions turn raw data,like transactions, credit activity, and customer behavior -into dashboards, insights, and reports for faster, data-driven decisions.
2. Which BI tool is best for banks or credit unions?
SAP Analytics Cloud, Qlik, Tableau, Power BI, and ThoughtSpot are strong for enterprise finance.
3. How does BI help in risk and compliance?
BI tools centralize data from multiple systems to monitor exposure, detect anomalies, track regulatory metrics, and generate audit-ready reports for compliance teams.
4. What are the security considerations when using BI in finance?
Financial BI requires data encryption, role-based access, audit logging, VPC or on-prem deployment options, and compliance with standards like SOC 2, ISO 27001, and GDPR.
5. How can embedded BI improve customer-facing financial dashboards?
Embedded BI lets institutions add real-time insights, like spending analysis, credit usage, portfolio trends, or loan eligibility,directly inside their apps to improve customer engagement and self-service.
6. What is the best AI model for financial analysis?
Hybrid setups using LLMs + statistical models work best,LLMs for explanations and insights, and traditional models (ARIMA, XGBoost, Prophet) for forecasting and risk scoring.
7. What are the four types of business intelligence?
The main types are descriptive analytics, diagnostic analytics, predictive analytics, and prescriptive analytics,together covering what happened, why it happened, what will happen, and what action to take.

Try Upsolve for Embedded Dashboards & AI Insights
Embed dashboards and AI insights directly into your product, with no heavy engineering required.
Fast setup
Built for SaaS products
30‑day free trial


