
Explore the best Qlik alternatives tested for BI teams, comparing ease of use, pricing, and integration to find the right solution for your needs.

Ka Ling Wu
Co-Founder & CEO, Upsolve AI
10 min

Disclosure: This article is published by Upsolve AI. Where our product is mentioned alongside competitors, we aim to provide balanced coverage based on publicly available information. We encourage readers to evaluate all options independently.
Trying to use Qlik for a simple dashboard? It’s powerful, no doubt. But unless you’ve got a full data team, it’s often more work than it should be.
Qlik is built for deep analytics and complex data modeling. Great for enterprises, not always ideal for fast-moving teams that want dashboards live and embedded quickly.
That’s why I tested four real Qlik competitors, Power BI, Tableau, ThoughtSpot, and Sisense, by building dashboards, embedding them, and comparing what actually worked.
What You’ll Find in This Guide
We tested four Qlik alternatives: built dashboards, tried embedding, and compared them side by side.
Here’s what you’ll get:
Tools that are faster and easier to use than Qlik
Picks for SaaS teams, analysts, product managers, and execs
Honest insights from real testing — not just feature lists
Let’s find the one that fits your team — and doesn’t need a manual.
Why You Might Be Looking for Qlik Alternatives
Qlik has been a go-to BI tool for years. But if you're reading this, chances are you're hitting some limits — or just curious if there's something better out there.
You're not alone. Many teams are starting to rethink their setup.
Here’s why:
Qlik feels like too hard for simple tasks.
Even basic dashboards can take time and help from a data person. If you just want to see numbers fast, it can slow you down.
Read the full user review
Costs go up as your team grows.
It’s hard to know what you’ll pay. Costs scale with data volume, capacity, and access, not just users. Qlik pricing typically starts around $200 per month on annual plans, but can quickly move into four-figure monthly costs as data volume, capacity, and access expand.
Read the full user review
Not easy for non-data teams.
If you work in product, sales, or support, Qlik can feel confusing. It’s not built for people who just want quick answers.
Doesn’t play well with other tools.
Want to connect Google Sheets or plug a chart into your app? With Qlik, it usually takes extra setup or coding.
Takes time to get started.
You can’t just sign in and build a dashboard. There’s setup, training, and often a long learning curve.
Read the full user review
So, Why Look at Qlik Competitors?
Because the BI market has changed. A lot.
Today, there are modern Qlik alternatives that:
Are easier to use — even if you’re not technical.
Offer flexible pricing (some even have free tiers).
Focus on embedded analytics, real-time dashboards, and faster setup.
Work seamlessly with tools you're already using (like Google Sheets, CRMs, or cloud data warehouses).
Comparing Qlik competitors doesn’t mean Qlik is bad. It just means you're being smart — making sure you're using the best tool for how your business runs today.
Ready to see what we tested? Let’s break down the top Qlik alternatives that actually deliver.
Qlik Competitors We Tested for Faster, Easier Dashboards
We didn’t just list random tools from the internet.
Over the last few weeks, we actually used these tools — imported sample datasets, built dashboards, tested embedding options, and explored what works and what doesn’t.
Some Qlik competitors looked great on paper but struggled when it came to real usage.
These four stood out for setup speed, flexibility, ease of use, and pricing with real value.
🔍 Quick Comparison Table: Qlik vs the Alternatives We Tested
Tool | Best For | Key Benefit Over Qlik | Pricing | Our Setup Time |
|---|---|---|---|---|
Power BI | Microsoft users | Cheaper, easier for Excel users | From $14/user/month | ~1 hour |
ThoughtSpot | Search-based insights | Natural-language querying | From $25/user/month | ~45 mins |
Tableau | Advanced data visualizations | Better visual controls, more templates | From $15/user/month (Viewer); $75/user/month (Creator) | ~1.5 hours |
Sisense | Complex, large-scale data needs | Scales better for big data | Custom enterprise plan | ~2 hours |
Now let’s break down each tool and how it compares to Qlik, based on real testing, not just feature lists.
Power BI vs Qlik: Best Qlik Competitor for Teams Using Microsoft Tools
Here’s how it compares at a glance:
Feature | Power BI | Qlik |
Setup time | ~1 hour | Several hours |
Excel/Teams integration | Seamless | Limited |
Ease of use | Easy for Excel users | More technical overall |
Pricing | Starts at $14/user/month | Higher + session-based costs |
Sharing & collaboration | Built-in with Microsoft 365 | Requires more manual setup |
Embedding dashboards | Possible, but needs dev help | Also needs dev support |
Power BI is probably the easiest Qlik competitor to pick if your team is already using Excel, Outlook, or Teams.
We tested it by uploading a basic Excel file with sales and lead data.
Within the hour, we had a working dashboard — with filters, slicers, and auto-refresh — all without needing any training.
Everything felt familiar. It’s basically Excel’s smarter, better-looking cousin.
✅ Where We Feel Power BI Was Easier Than Qlik
Uploaded an Excel file → dashboard done in 1 hour
Integrated perfectly with Microsoft Teams and OneDrive
Easy to share reports — no need for external tools
Read the full user review
Starts at just $14/user/month — great for small teams
🚫 Where it struggled
Gets messy with complex, multi-source datasets
Read the full user review
Lacks advanced scripting and data logic features
Embedding needs dev time — not ideal for fast product teams
What Felt Different
With Power BI, we didn’t feel like we were “adopting” a new tool. It just blended in with how we already worked.
A sales manager built their own BI dashboard and shared it in Teams in under 2 hours. No BI team involved. That kind of self-service is hard to pull off in Qlik without support.
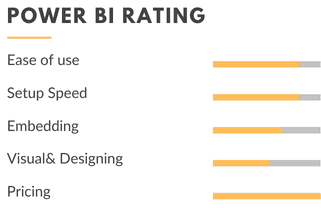
My rating: Overall Rating⭐⭐⭐⭐ (4.0/5)
My Honest Take
If your team already uses Microsoft tools, Power BI is the most obvious Qlik alternative — no migration headache, no steep learning curve, and much cheaper.
It’s perfect for:
✅ Teams who live in Excel and want better visuals
✅ Sales or operations teams who want easy reporting
✅ Anyone looking for a simple, budget-friendly Qlik competitor that just plugs into what they already use
ThoughtSpot vs Qlik: Best for Search-Driven, AI-Powered Insights
Here’s how ThoughtSpot stacks up next to Qlik in our testing:
Feature | ThoughtSpot | Qlik |
Setup time | ~45 mins | Several hours |
Search-based insights | Yes — type questions like Google | No manual drill-down required |
AI suggestions | Built-in smart trends | Limited |
Embedding dashboards | Requires dev support | Also requires dev support |
Ease for business users | Very intuitive | Less beginner-friendly |
Pricing | Custom (scales by usage) | Tiered, can get expensive |
ThoughtSpot flips the BI experience — instead of building charts, you just ask questions and get instant, AI-powered answers.
With ThoughtSpot, we tested a basic sales dataset and simply typed: “Top regions by revenue this year”. The chart popped up instantly — no filters, no drag-and-drop, no config. It’s like having a search engine for your data.
That was the biggest difference from Qlik: Where Qlik wants you to build reports manually, ThoughtSpot just gives you the answer.
✅ Why ThoughtSpot Was Better Than Qlik (For AI + Simplicity)
Just typed a question like “top-performing regions” — got instant insights
No setup, no drag-and-drop — felt like Google for my data
AI suggested trends we hadn’t thought of
Read the full user review
Great for teams who need quick, self-service analytics
🚫 What Was Missing
Embedding needed a developer and was not as smooth as the search experience
Less visual control — can’t tweak charts as much
Pricing is custom and not transparent — tricky to estimate
Read the full user review
What Felt Different
ThoughtSpot flips the BI model. You don’t build dashboards first. You ask a question, get the answer, and move on.
It made data feel accessible to everyone, not just the analytics team.
We even had a product manager pull up key churn trends without needing help. That’s a win.
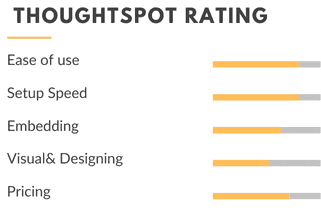
My rating: Overall Rating⭐⭐⭐⭐ (3.8/5)
My Honest Take
If your team’s constantly asking, “Can you check the data for this?” ThoughtSpot will save you hours.
It’s perfect for:
✅ Teams that want fast answers, not complex dashboards
✅ Sales or marketing teams who hate waiting on reports
✅ Companies that want AI-powered insights out of the box
Tableau vs Qlik: Best for Beautiful, Client-Ready Dashboards
Let’s start with the side-by-side:
Feature | Tableau | Qlik |
Setup time | ~1.5 hours | 2–3 hours or more |
Data visualization quality | Best-in-class visuals | Good, but less polished |
Customization options | High (colors, layout, formatting) | Moderate |
Templates & styles | Lots of out-of-the-box options | Limited starter visuals |
Pricing | Starts at $15/user/month (Viewer License) | Higher, capacity-based pricing that scales with usage |
Ease of use | Some learning curve | More technical overall |
Tableau is all about beautiful, interactive dashboards — perfect if you care about design, storytelling, and polished visuals.
We tested Tableau with a sample customer journey dataset and created a funnel dashboard. Within 90 minutes, it looked polished enough to present to a C-suite — no design skills needed.
Qlik could do the same, but it would’ve taken twice as long, and wouldn’t look half as clean.
✅ Why Tableau Worked Better Than Qlik (for Visuals)
Dashboards looked client-ready with zero design work
Huge selection of interactive charts and filters
Best tool we tested for data storytelling
Read the full user review
Perfect for presentations, client reports, or internal reviews
🚫 Where Qlik Still Has the Edge
Learning curve — not beginner-friendly at first
More expensive than Power BI
Qlik still wins on backend flexibility and logic
What Felt Different
Tableau made data feel visual-first.
Even before we added filters or formatting, the dashboards already looked presentable.
There’s something nice about that, especially when your audience isn’t technical.
We sent a marketing performance dashboard to a client during the test — their first comment was, “Wow, this looks great.” That never happens with Qlik unless you spend time customizing everything.
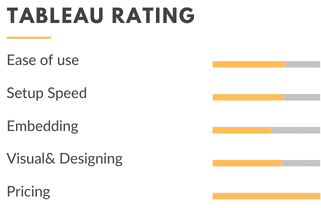
My rating: Overall Rating⭐⭐⭐⭐ (3.6/5)
My Honest Take
If your dashboards are shared with clients, execs, or investors, and you want them to look clean and impressive without extra design work — Tableau is a better Qlik competitor for visuals and storytelling.
It’s perfect for:
✅ Agencies, marketing teams, or customer-facing reports
✅ Teams that want plug-and-play visuals without code
✅ Anyone who wants dashboards that make data look good right away
Sisense vs Qlik: Best Qlik Competitor for Complex, Scalable Analytics
Let’s look at the side-by-side first:
Feature | Sisense | Qlik |
Setup time | ~2 hours | 2–4 hours or more |
Handling large datasets | Excellent — built for scale | Good, but performance varies |
Customization (API & Dev) | Strong API + plugin support | Scripting available, more rigid |
Deployment flexibility | Cloud, on-prem, hybrid | Mostly cloud-focused |
Pricing | Custom (Enterprise-grade) | Tiered, capacity-based pricing that scales with usage |
Ease for non-technical users | Not ideal | Slightly more guided UI |
Sisense gives you full control over data and deployment, built for companies that need serious scale and customization.
Sisense was the most technical tool we tested — but also the most powerful under the hood.
We threw a messy mix of sales logs, user behavior data, and event-level records at it. Once everything was connected and modeled, Sisense handled it like a champ.
Performance was solid, even with larger datasets.
✅ Where Sisense Stood Out Over Qlik
Handled huge, messy datasets without slowing down
Read the full user review
Strong API access — great for our dev team
Supports hybrid deployments — flexible for enterprise setups
Best fit when you need serious scale and control
🚫 Why it is not for everyone
Longer setup time — definitely not plug-and-play
Read the full user review
Needs a technical team to manage and customize
Overkill if you just want simple dashboards and a fast setup
What Felt Different
Sisense feels more like a data engine than a BI tool.
It’s not the fastest to set up, and it’s definitely not no-code. But once it’s running, it’s extremely reliable and scalable.
We had a dev connect multiple sources, create custom logic, and build a role-based dashboard experience. That level of control just isn’t as smooth in Qlik without a lot of workarounds.
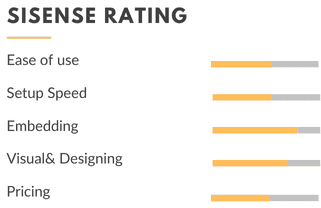
My rating: overall Rating ⭐⭐⭐ (3.2/5)
My Honest Take
If your team is technical and working with huge or messy datasets, Sisense is a strong Qlik alternative — especially when scale and backend flexibility matter.
It’s perfect for:
✅ Data teams managing large volumes across multiple systems
✅ Product and engineering teams who want deep API control
✅ Enterprises that need robust infrastructure, not just visual dashboards
How To Choose the Right Qlik Competitor for Your Business
After testing all four tools, one thing was clear:
There’s no one-size-fits-all BI solution. It depends on your team, your data, and how fast you need to move.
So instead of listing features again, here’s how we’d actually think through the decision, based on what we tested.
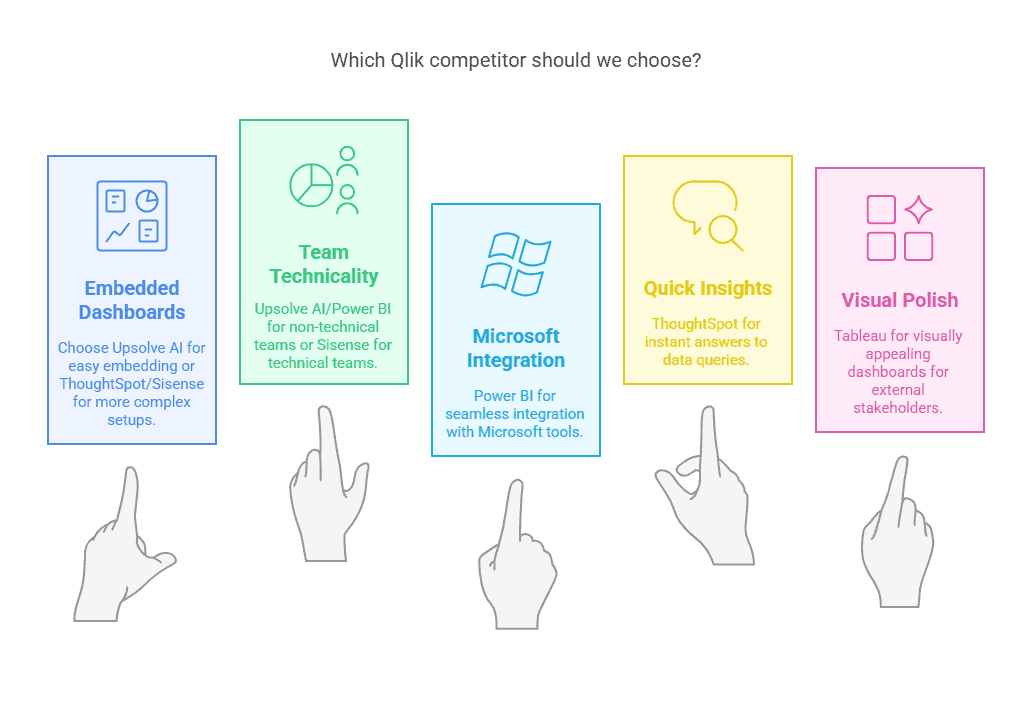
🔹 1. Do you need embedded dashboards?
If you are embedding dashboards inside a product or internal tool and have a dev team to help,
→ ThoughtSpot or Sisense both work, though the setup is heavier.If you want an agent-driven, customer-facing approach rather than a traditional dashboard, see the note on where Upsolve AI fits below.
🔹 2. How technical is your team?
No developers? No problem.
→ Power BI is the most approachable for non-technical users.Got a data engineer or technical team?
→ Sisense gives you full control, but expect a longer setup.
🔹 3. Do you already use Microsoft tools?
If your team lives in Excel, Teams, or OneDrive,
→ Power BI is the natural fit. It feels like an extension of what you're already doing.
🔹 4. Do you want quick insights, not just dashboards?
If your team constantly asks, "Can someone pull this report?"
→ Try ThoughtSpot — just type a question and it gives you the answer. Like Google, but for your data.
🔹 5. Do you care about visual polish?
If you share dashboards with clients, execs, or investors,
→ Tableau gives you the best-looking visuals out of the box.
Quick Cheat Sheet
Scenario | Best Tool | Why |
|---|---|---|
Already using Excel or Teams | Power BI | Works seamlessly with Microsoft tools |
Want search-driven insights | ThoughtSpot | Ask questions, get answers, no dashboard needed |
Need polished visuals for presentations | Tableau | Best for design and storytelling |
Working with large, messy datasets | Sisense | Scales well, highly customizable with dev help |
Where Upsolve AI Fits
Full disclosure, Upsolve is our product, so we left it off the ranked list above and put the straight version here instead.
Upsolve isn't a Qlik competitor in the usual sense. It's an agentic analytics platform: business users just ask questions in plain language and an agent builds the charts and dashboards for them, while the data team encodes the metric definitions and business rules behind the scenes in Agent Studio.
Where it actually overlaps with Qlik is embedded, customer-facing analytics:
Drop-in embedding: add it to your own product with a React component or iFrame.
Role-aware views: each user sees only the data they're cleared to see.
Answers where people work: Slack, Teams, and the other MCP-compatible tools they already use.
The thing that makes or breaks an agent like this isn't the model, it's context. That's the whole idea behind Upsolve's three-layer setup:
Structure: what data you actually have.
Meaning: what those numbers mean at your company.
Trust: which answers have been checked.
If you're torn between an agent and a traditional dashboard tool, these two go deeper: why context, not the model, decides whether an agent is accurate and what to look for in an AI agent builder platform for analytics.
Pricing is a free tier, Pro from $500/mo, and Team at $2,000/mo (that's the plan that adds embedding, RBAC, multi-tenant, and semantic-layer generation), plus a custom Enterprise option. Annual billing takes off 20%.
Conclusion: Quick Recap of the Best Qlik Competitors
Qlik is powerful, but it’s not always the simplest
If your team needs something faster, easier, or more flexible, there are better options
We tested four real Qlik alternatives. Here’s what stood out:
ThoughtSpot: type a question, get instant answers
Power BI: feels like Excel, great for Microsoft users
Tableau: best visuals, great for client or exec reports
Sisense: powerful for large datasets, needs a tech team
You don’t need to rebuild your BI stack. Sometimes the better choice is just simpler.
FAQs
1. Is Qlik still worth it in 2026?
It depends. Qlik is powerful, especially for enterprise teams with complex data setups. But if you want faster setup, easier dashboards, or cleaner embedded analytics, other modern tools may be a better fit.
2. Which Qlik competitor is best for startups or SaaS teams?
It depends on whether you need internal dashboards or customer-facing ones. For internal reporting on a small team already using Microsoft tools, Power BI is the lightest lift. For analytics embedded inside your own product, compare how each tool handles embedding and per-customer views before deciding.
3. What’s the easiest tool to switch to from Qlik?
Power BI, if you already use Microsoft tools like Excel or Teams. If your priority is embedded, customer-facing dashboards, weigh each tool’s embedding workflow rather than raw setup time.
4. Can these tools handle embedded dashboards like Qlik?
Yes, but with different approaches.
Sisense and ThoughtSpot offer embedding, but need technical setup.
Power BI and Tableau support it, but it’s more manual.
5. What’s the most affordable Qlik alternative?
Power BI is the most budget-friendly of the tools we tested, starting at $14/user/month. Pricing models vary widely, so compare per-user plans against usage-based or capacity-based pricing for your expected data volume. Qlik’s pricing can scale quickly as usage grows.

Try Upsolve for Embedded Dashboards & AI Insights
Embed dashboards and AI insights directly into your product, with no heavy engineering required.
Fast setup
Built for SaaS products
30‑day free trial


