
Discover practical procurement dashboard examples and the KPIs teams use to track spend, suppliers, inventory, contracts, and cost savings.

Ka Ling Wu
Co-Founder & CEO, Upsolve AI
10 min

Procurement does not have to be a guessing game.
When teams rely on spreadsheets, important data gets scattered. That leads to delayed approvals, budget overruns, and supplier issues that surface too late.
A procurement dashboard brings everything into one place. It gives you real-time visibility into spend, suppliers, inventory, and performance so teams can make decisions faster and with more confidence.
The problem is that many dashboards are cluttered or focus on the wrong KPIs.
That is why we put together 10 procurement dashboard examples that teams actually use:
✅ Clear, visual dashboards that are easy to read
✅ KPIs that matter for spend, suppliers, and performance
✅ Practical use cases and template-style dashboards for real procurement workflows
This guide is built to cut through the noise and help you choose dashboards that make procurement reporting simpler, clearer, and more reliable.
What is a Procurement Dashboard?
A procurement dashboard is a visual tool that quickly shows key procurement data like spending, vendor performance, order statuses, and cost savings in one place.

It helps your team spot what's important instantly, without checking multiple files or running manual reports.
With a procurement dashboard, you can:
See exactly how much you're spending and on what.
Evaluate and rank your suppliers easily.
Quickly track inventory levels and reorder points.
Identify cost-saving opportunities at a glance.
Simply put, procurement dashboards help you make smarter purchasing decisions faster, saving your team valuable time and money.
Why a Procurement KPI Dashboard Matters
A procurement KPI dashboard turns data into action.
Companies tracking KPIs cut procurement costs by up to 15% and improve contract compliance rates.
With these dashboards, you can:
Spot Cost Savings: Compare supplier prices, highlight maverick spending, and see where to negotiate better rates or terms.
Monitor Supplier Performance: Track on-time delivery, quality, and compliance issues to avoid costly supply chain surprises.
Control Inventory: Keep tabs on stock-outs or overstock, reducing waste and last-minute purchases.
Track Spend Trends: Reveal high-spend categories and adjust your budget or vendor mix in real-time.
Increase Team Accountability: See performance by buyer or department for better transparency.
In short, dashboards give you control and help you move from guesswork to data-driven procurement.
Customer Experience Analytics - 10 KPIs and Metrics You Need To Know
10 Procurement Dashboard Examples You Can Actually Use
There are a ton of procurement dashboards out there, but most are either too complex or too basic.
But, these 10 procurement dashboard examples are actually usable and perfect to start tracking important KPIs for your team.
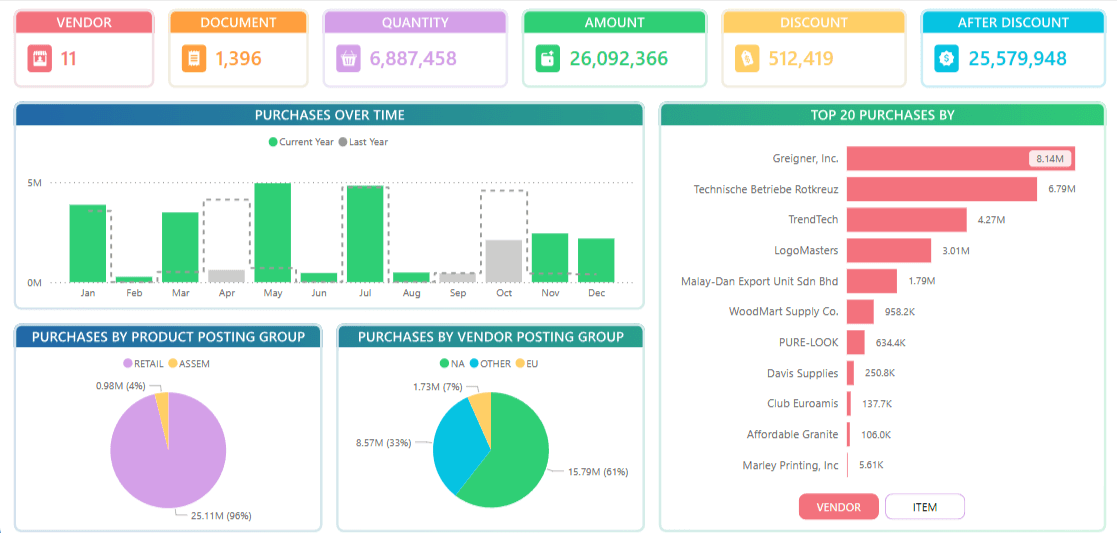
1. Procurement Spend Analysis Dashboard
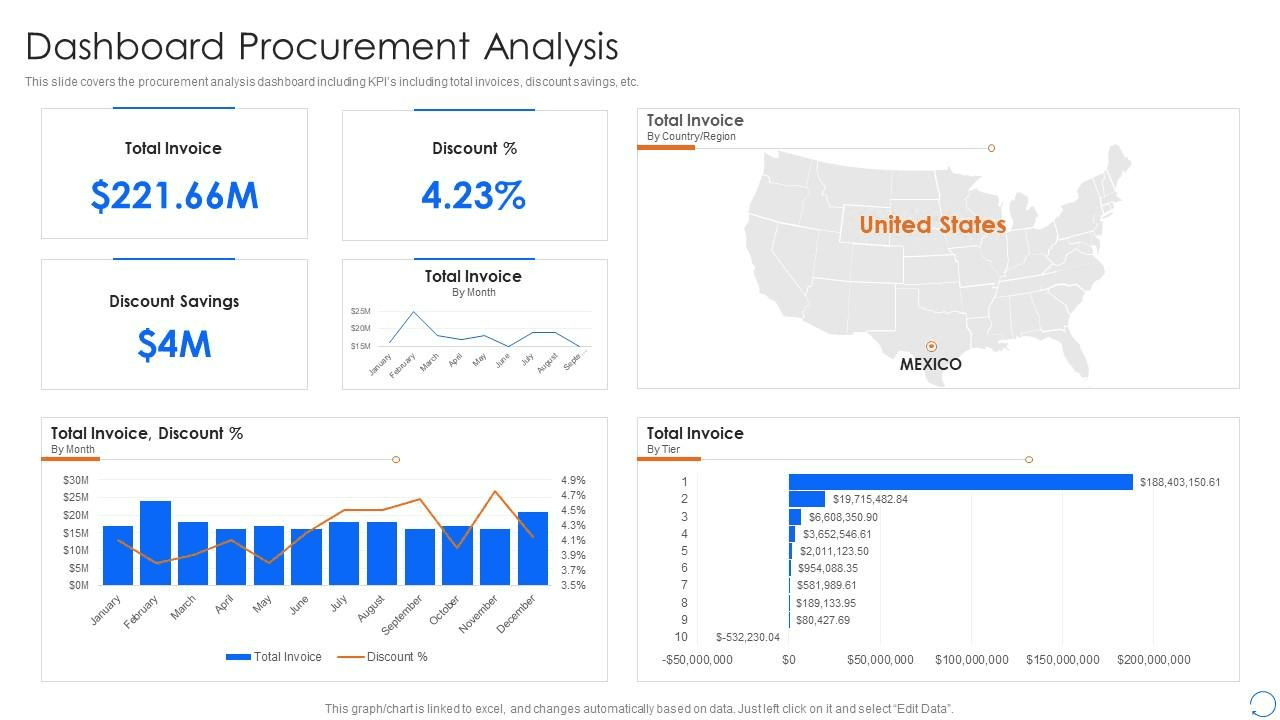
A procurement spend analysis dashboard gives you a clear, high-level view of where procurement dollars are going across the organization.
It breaks down spending by category, supplier, and time period in seconds.
Here's what KPIs this dashboard tracks:
Total Spend
Spend by Supplier
Spend by Category
Spend Variance (Actual vs. Budget)
Why this dashboard is useful:
This dashboard is a go-to when you want to spot inefficiencies and trim costs without digging into spreadsheets.
Here’s how it helps:
Highlights top spending areas to guide budget reviews
Flags maverick or unapproved spend quickly
Helps you compare vendors and identify negotiation opportunities
Tracks spending trends over time for better forecasting
Who this dashboard is mostly useful for:
This dashboard is ideal for procurement managers, finance teams, or CFOs who want to keep spending under control, track trends over time, and report savings with confidence.
2. Supplier Performance Dashboard

A supplier performance dashboard gives a complete view of how suppliers are performing across delivery, quality, and reliability metrics.
Here's what KPIs this dashboard tracks:
On-Time Delivery Rate
Order Accuracy
Supplier Quality Score
SLA Compliance
Number of Late Deliveries
Why this dashboard is useful:
If you're working with multiple vendors, this dashboard helps you separate the strong from the risky.
Here’s how it adds value:
Flags unreliable suppliers before they disrupt operations
Helps you build a preferred supplier list based on real data
Identifies trends in late deliveries or quality issues
Supports better contract renegotiation with performance data
Who this dashboard is mostly useful for:
This dashboard is especially useful for procurement leads, operations managers, and vendor management teams who want to improve supplier relationships and reduce risk across the supply chain.
3. Raw Material Procurement Dashboard
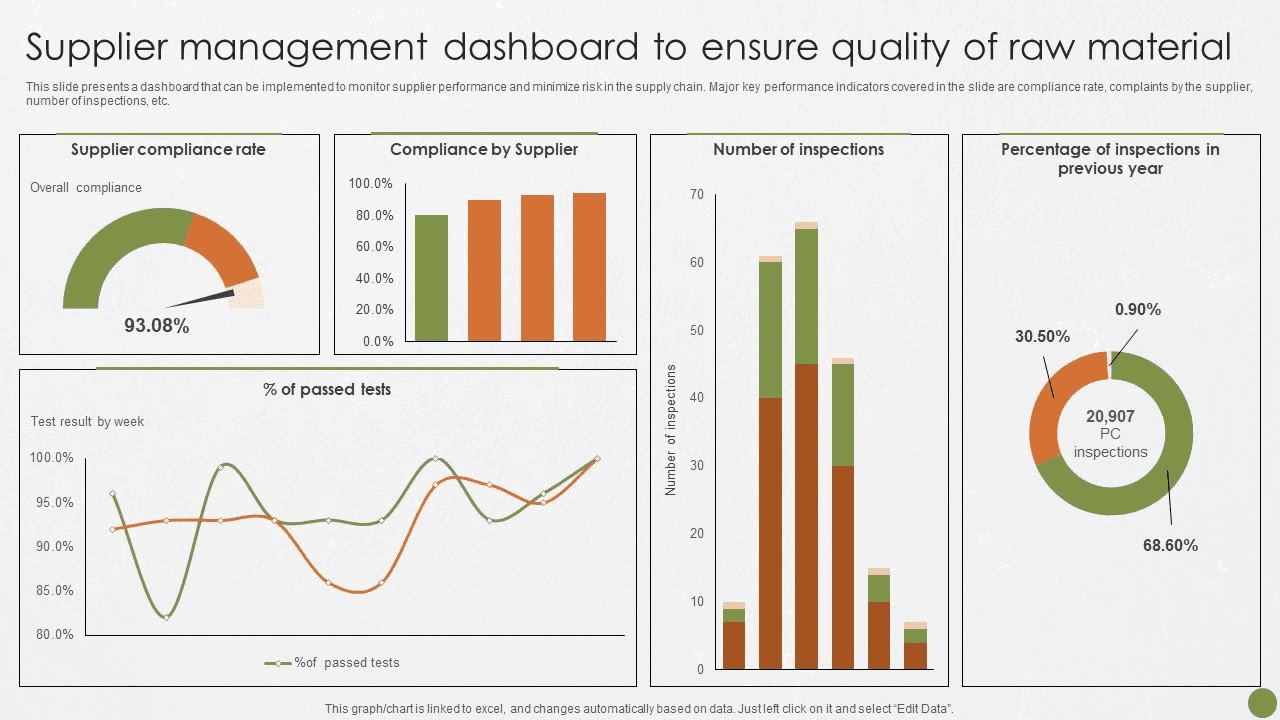
A raw material procurement dashboard is designed for teams that depend on timely material supply to keep production moving. It tracks availability, costs, and supplier lead times in a single, clear view.
Here's what KPIs this dashboard tracks:
Raw Material Cost Trends
Lead Time by Supplier
Stock Availability
Order Delays
Reorder Alerts
Why this dashboard is useful:
When you’re managing time-sensitive raw materials, even small delays hurt.
This dashboard helps by:
Flagging lead time issues that could slow down production
Tracking cost fluctuations to optimize purchase timing
Keeping tabs on material availability to prevent stockouts
Who this dashboard is mostly useful for:
This one’s perfect for manufacturing teams, supply chain managers, and operations heads who need real-time visibility into the raw material flow to keep production on track.
4. Purchase Dashboard for Order Tracking
A purchase order tracking dashboard covers the full lifecycle of purchase orders, from request and approval to delivery, making it easy to see what is delayed, completed, or stuck.
Here's what KPIs this dashboard tracks:
Purchase Order Status
Order Cycle Time
Delayed Orders
Average Approval Time
Why this dashboard is useful:
If you’re managing hundreds of POs, this dashboard makes it easier to keep things moving.
Here’s how it helps:
Tracks where each PO is in the process
Flags bottlenecks and delays early
Helps improve PO approval speed
Boosts visibility across procurement and operations
Who this dashboard is mostly useful for:
This dashboard works best for procurement teams, purchasing coordinators, and supply chain leads who handle large volumes of purchase orders and need to keep things flowing smoothly.
5. Procurement Cost Savings Dashboard

A procurement cost savings dashboard is designed to measure the ROI of procurement efforts and make savings visible across the organization.
It tracks how much money is saved through negotiations, discounts, and smarter buying decisions.
Here's what KPIs this dashboard tracks:
Total Cost Savings
Cost Avoidance
Savings vs. Target
Why this dashboard is useful:
Need to prove procurement is more than just paperwork?
This dashboard does the talking. Here's what it helps with:
Shows real dollar savings from procurement activities
Tracks if you're hitting cost reduction goals
Highlights where more spending can be brought under control
Supports quarterly and annual ROI reporting
Who this dashboard is mostly useful for:
This one’s a favorite for CFOs, finance leads, and senior procurement managers who need to report savings clearly and justify the value of procurement to leadership.
6. Contract Management Dashboard
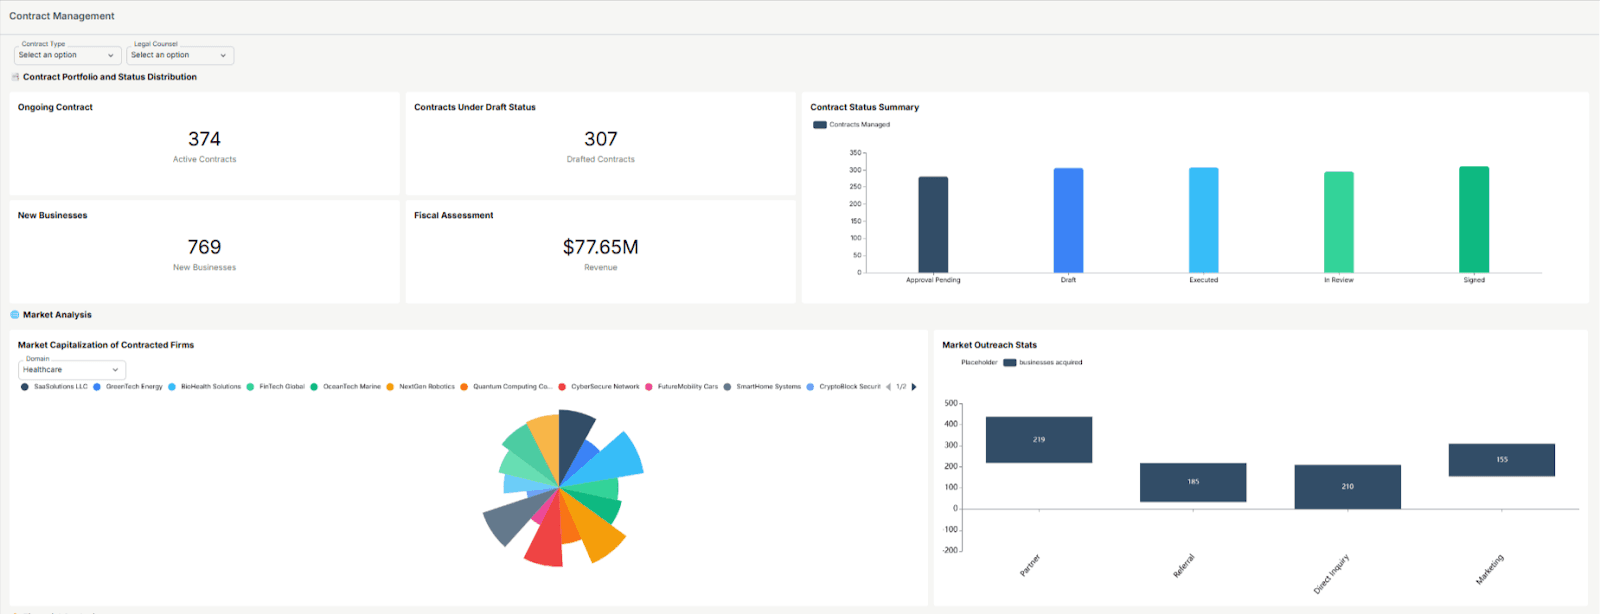
A contract management dashboard helps teams stay on top of supplier contracts, including active agreements, upcoming expirations, and potential compliance risks.
Here's what KPIs this dashboard tracks:
Number of Active Contracts
Contract Compliance Rate
Contract Utilization
Average Contract Value
Why this dashboard is useful:
If contracts are scattered or managed manually, things slip.
This dashboard solves that by:
Alerting you to expiring contracts before they lapse
Showing which contracts are underutilized or need renegotiation
Keeping your procurement and legal teams aligned
Who this dashboard is mostly useful for:
Ideal for legal teams, procurement heads, and vendor relationship managers who need to track contract performance, stay compliant, and avoid last-minute renewals.
7. Inventory-Linked Procurement Dashboard
An inventory-linked procurement dashboard connects procurement data with inventory levels, giving teams real-time visibility into stock availability, shortages, and excess inventory.
Here's what KPIs this dashboard tracks:
Inventory Turnover Rate
Reorder Point Breaches
Stock Availability
Overstock Alerts
Procurement vs. Usage Trends
Why this dashboard is useful:
When procurement and inventory aren't in sync, money leaks.
This dashboard helps by:
Preventing over-ordering and stockouts
Aligning purchases with real inventory movement
Highlighting slow-moving or excess stock
Supporting smarter reorder decisions
Who this dashboard is mostly useful for:
Best suited for inventory managers, procurement teams, and supply chain analysts who need to balance stock levels with actual demand and reduce holding costs.
8. Risk Management Procurement Dashboard

A procurement risk management dashboard helps teams identify supplier-related risks early, including delivery delays, compliance gaps, and geopolitical exposure.
Here's what KPIs this dashboard tracks:
Supplier Risk Score
On-Time Delivery Failures
Contract Breach Incidents
Country or Region Risk Flags
Supplier Dependency Ratio
Why this dashboard is useful:
Procurement risk can sneak up fast.
This dashboard helps you stay proactive by:
Highlighting high-risk suppliers in real time
Tracking delivery failures or missed SLAs
Identifying over-reliance on a single vendor
Mapping supplier risks across regions or categories
Who this dashboard is mostly useful for:
Perfect for procurement directors, compliance officers, and supply chain risk teams looking to reduce exposure and build a more resilient supplier base.
9. Procurement Dashboard Template for Budgeting

A procurement budgeting dashboard compares actual spend against budget targets, giving teams real-time visibility into budget performance. This dashboard reflects a common budgeting template structure that procurement teams use when setting up spend and cost tracking.
Here's what KPIs this dashboard tracks:
Budget vs. Actual Spend
Forecast Accuracy
Overspend Alerts
Spend by Department
Variance from Planned Budget
Why this dashboard is useful:
Budget overruns happen quietly unless you're tracking them.
This dashboard helps by:
Showing how much budget is used in real-time
Improving monthly and quarterly forecasting
Helping reallocate unused budget smartly
Who this dashboard is mostly useful for:
A great fit for finance teams, procurement controllers, and department leads who need to keep spending aligned with budget targets and avoid last-minute surprises.
10. Sustainable & Ethical Sourcing Dashboard

A sustainable and ethical sourcing dashboard helps teams track how procurement decisions align with ESG goals, including sustainability, ethical sourcing, and supplier compliance.
Here's what KPIs this dashboard tracks:
Sustainable Suppliers Percentage
Carbon Footprint by Vendor
Ethical Compliance Score
Green Spend Ratio
ESG Audit Status
Why this dashboard is useful:
Procurement teams are under pressure to be sustainable.
This dashboard helps by:
Showing progress on ESG procurement targets
Identifying non-compliant or high-risk vendors
Helping switch to greener alternatives
Supporting reporting for sustainability audits
Who this dashboard is mostly useful for:
Especially useful for sustainability teams, ESG officers, and procurement heads in industries with strict compliance or public sustainability commitments.
Before we move on, here’s a quick side-by-side comparison of all 10 procurement dashboards so you can decide which one fits your team best:
Dashboard Type | Tracks These KPIs | Best For |
Spend Analysis | Total Spend, Supplier Spend, Category Breakdown | Budget control, cost savings |
Supplier Performance | On-Time Delivery, Quality Score, SLA Compliance | Vendor evaluations, supplier negotiations |
Raw Material Procurement | Material Costs, Lead Times, Reorder Alerts | Manufacturing and production planning |
Purchase Order Tracking | PO Status, Cycle Time, Fulfillment Rate | Monitoring and managing purchase flows |
Cost Savings | Negotiated Savings, Cost Avoidance, Savings vs Target | Showing ROI of procurement initiatives |
Contract Management | Expiring Contracts, Compliance, Utilization | Reducing risk and improving contract control |
Inventory-Linked Procurement | Inventory Levels, Turnover, Overstock Alerts | Syncing procurement with inventory movement |
Risk Management | Supplier Risk, Geo Risk, Delivery Failures | Avoiding disruptions and managing supplier risk |
Budgeting Dashboard Template | Budget vs Actual, Forecast Accuracy, Overspend Alerts | Staying on budget, forecasting spend |
Sustainable & Ethical Sourcing | ESG Score, Green Spend, Supplier Compliance | Meeting sustainability and ethical sourcing goals |
This gives you a bird’s-eye view of what each dashboard is built for and helps you pick the ones that solve your biggest challenges right now.
How to Pick the Right Procurement Dashboard Template
Selecting the ideal procurement dashboard depends on your organization's size, procurement objectives, and scalability requirements.
Here’s what you should consider before making your choice:
✅ Pre-built Templates
Pros: Quick implementation, minimal setup, ideal for smaller teams with straightforward procurement needs.
Cons: Limited flexibility, may not adapt well as your procurement complexity grows.
✅ Custom Dashboards
Pros: Highly adaptable, tailored precisely to your workflows, and scalable as your procurement needs evolve.
Cons: Higher initial effort and cost, often requiring dedicated resources or external expertise.
To simplify your decision, here are three practical scenarios:
SMBs with Limited Data: Opt for pre-built spend-tracking templates. These dashboards quickly deliver clear insights into procurement spend without unnecessary complexity.
Enterprises with Advanced Needs: Choose custom dashboards that focus deeply on supplier performance, contract management, and procurement risk for comprehensive visibility and control.
Organizations Reporting on Sustainability or ESG: Start with ethical sourcing dashboards that specifically monitor sustainable procurement practices, compliance standards, and environmental impact for streamlined reporting.
Align your choice with your current procurement landscape, ensuring your dashboard grows effectively alongside your team’s evolving needs.
How to Build Procurement Dashboards With Upsolve AI
If you want to move from examples to implementation, Upsolve AI makes it possible to build procurement dashboards without heavy engineering work.

Upsolve AI is an agentic analytics platform. Business users ask for what they need in plain language and an analytics agent builds the procurement dashboard, while the data team encodes the metric definitions and supplier rules behind the scenes in Agent Studio.
The dashboards can run inside your internal tools or be embedded in customer-facing products, so teams can replace spreadsheets and static reports with live views tailored to each role.
What Upsolve AI brings to procurement dashboards:
Natural-language dashboard building: describe the view you want and the agent assembles it, no manual chart wiring
AI-driven insights and follow-up questions, not just static charts
Real-time integrations with ERP and procurement systems
Role-based views tailored to each user, so a CFO and a buyer see different cuts of the same data
Fully embeddable into your existing applications through an iFrame or React components
Teams commonly use Upsolve AI to build dashboards such as:
Spend Analysis Dashboards to monitor category, supplier, and budget-level spend
Supplier Performance Dashboards to track delivery reliability, quality, and compliance
Contract Management Dashboards to monitor renewals, utilization, and risk
Sustainability and ESG Dashboards to measure ethical sourcing and environmental impact
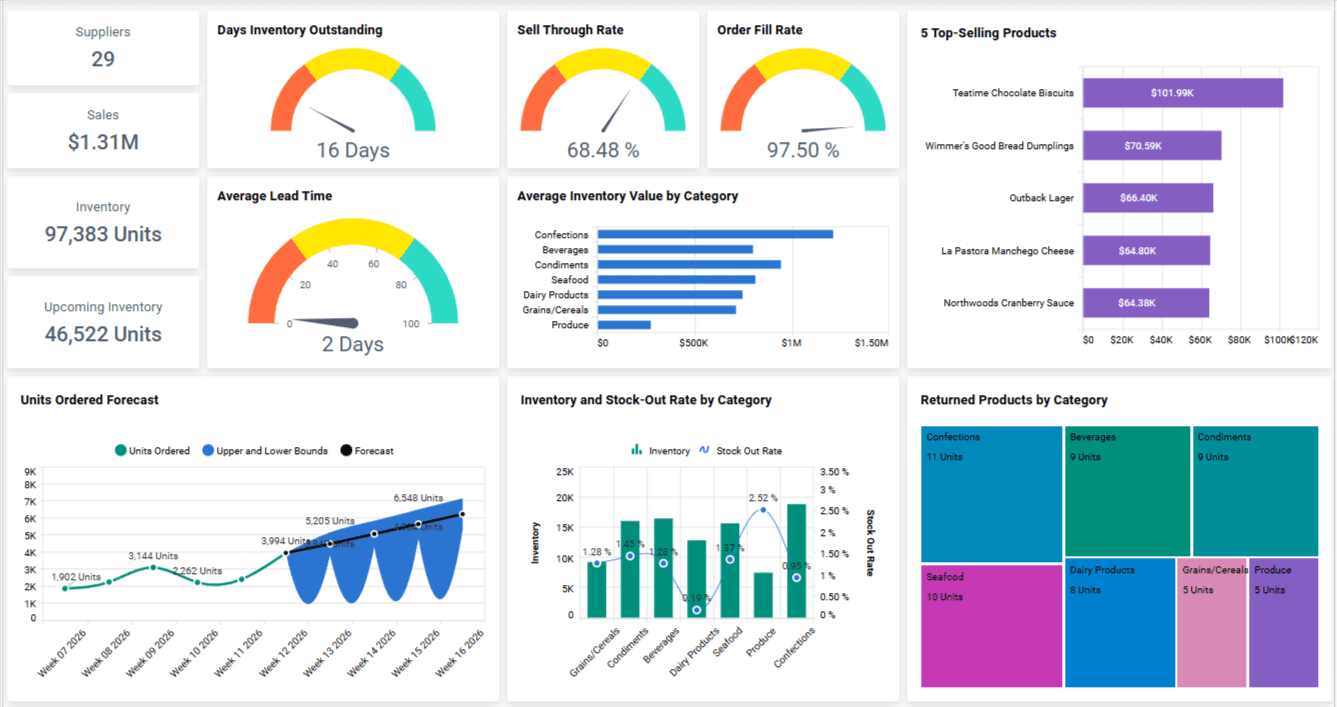
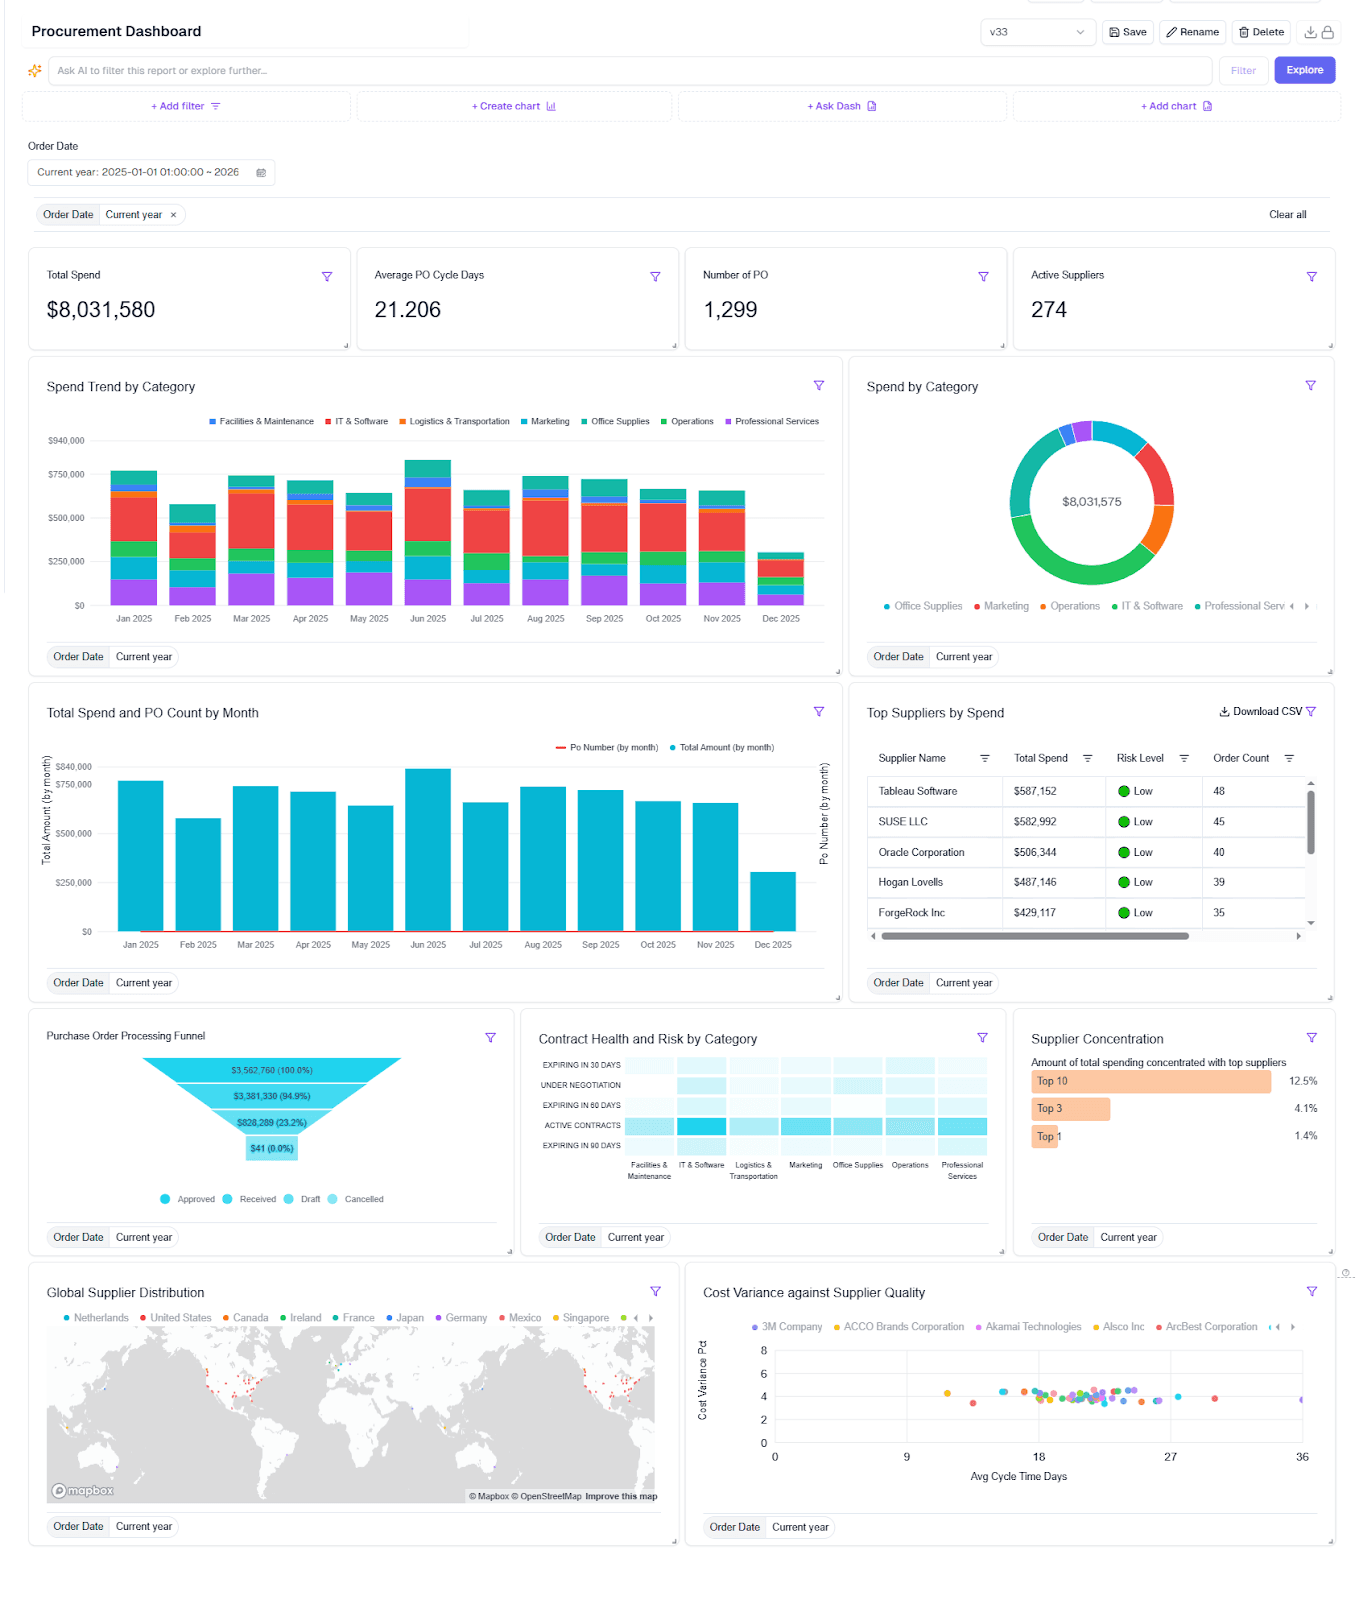
Below is an example of a procurement dashboard built with Upsolve AI, showing how the different procurement views are presented in a single interface.
From an implementation perspective, Upsolve AI is used as a build-and-embed layer rather than a standalone BI tool. Pricing scales with usage: a free tier to test-drive, Pro from $500/month, and a Team plan at $2,000/month that adds embedding, role-level security, and multi-tenant support, plus a custom Enterprise option. Annual billing takes off 20%.
How teams use it in practice
Companies like Guac, a grocery forecasting startup, leveraged Upsolve AI to deploy customized analytics dashboards rapidly.
Guac needed customized dashboards to help grocery chains understand product demand down to individual SKUs.
By using Upsolve AI, Guac built these customized, interactive dashboards in just days, enabling their grocery customers to significantly reduce waste and improve product availability through precise forecasting analytics.
👉 Read more customer success stories.
Where Procurement Dashboards Are Headed: From Static Views to Analytics Agents
Even the cleanest dashboard still sits there waiting for someone to read it and ask the next question. When a buyer notices spend creeping up, the real work starts: pulling the supplier breakdown, checking it against budget, figuring out which contract is driving it. A static view doesn't do that part for you.
That's where analytics agents come in. Instead of clicking through filters, someone asks a question in plain language, like "which suppliers slipped on delivery last quarter and what did it cost us," and an analytics agent retrieves the answer and builds the view on the spot. The dashboard stops being a static report and becomes something closer to a conversation.
The catch is accuracy. An agent is only as reliable as the context it's given: which supplier table is authoritative, how your team defines maverick spend, which fiscal calendar a "quarter" follows. Without that, agents guess, and wrong answers in procurement are expensive. It's the main reason so many AI analytics projects stall before production, and why the context you feed an agent matters more than the model behind it.
So as you choose from the examples above, it's worth thinking one step ahead: not just what the view shows today, but whether the underlying data and definitions are clean enough for an agent to answer questions against tomorrow.
Best Practices for Using Procurement Dashboards (Full Checklist)
Just building a dashboard isn’t enough.
If it’s cluttered, outdated, or unclear, it won’t get used. Here’s a quick checklist to make yours effective:
Best Practice | Why It Matters |
Limit to 5–8 core KPIs | Keeps dashboards focused, so teams can act fast without feeling overwhelmed |
Use role-based views | Tailors insights for finance, operations, or leadership—no one-size-fits-all data |
Add filters for time, supplier, and category | Allows teams to drill down and investigate patterns quickly |
Set automatic data refreshes | Ensures your team always works with the most up-to-date information |
Enable alerts and notifications | Flags budget overruns, delivery delays, or expiring contracts in real-time |
Keep your dashboards lean, relevant, and role-specific.
That’s what turns dashboards into real decision-making tools.
Conclusion
Procurement dashboards simplify how your team uses data.
They turn complex reports into clear insights your team actually uses.
The right dashboards help you control spending, boost supplier performance, reduce risk, and streamline inventory, without manual updates or spreadsheets.
So, make sure you don’t just choose a dashboard that looks good, but pick one that genuinely matches your procurement goals and business size.
FAQs About Procurement Dashboards
Here are some quick answers to questions people often ask when evaluating procurement dashboards:
Q1: What’s the difference between a spend dashboard and a purchase order dashboard?
A spend dashboard tracks total procurement costs, categories, and supplier-wise spending. A PO dashboard monitors order status, cycle times, and delivery timelines.
Q2: How often should procurement KPIs be reviewed?
Review high-level KPIs monthly. For operational teams, weekly reviews help catch issues early. In fast-moving environments, daily checks are ideal.
Q3: Can procurement dashboards connect with ERP tools like SAP or NetSuite?
Yes. Tools like Upsolve AI support direct integration with major ERPs, allowing real-time data sync for accurate and automated insights.
Q4: Are procurement dashboards customizable by role or team?
Absolutely. With Upsolve AI, you can set up role-based views so that CFOs, buyers, and inventory leads each see only the data that matters to them.
Q5: Do I need a developer to build dashboards in Upsolve AI?
No. Business users describe the dashboard they need in plain language and the agent builds it, so you can launch real-time procurement dashboards without writing code. Your data team sets up the definitions and access rules once in Agent Studio.

Try Upsolve for Embedded Dashboards & AI Insights
Embed dashboards and AI insights directly into your product, with no heavy engineering required.
Fast setup
Built for SaaS products
30‑day free trial


