
Guide to customer experience analytics metrics that reveal loyalty, churn risk, and engagement, with tips to act on insights.

Ka Ling Wu
Co-Founder & CEO, Upsolve AI
10 min

Why do some customers stop engaging with your brand, even after a great first experience?
Businesses often focus on delivering quality products, but understanding customer interactions is just as important.
A study found that 73% of consumers say a great experience drives loyalty, yet one-third would leave after just one bad interaction.
Companies that track customer experience analytics achieve higher retention, better engagement, and lower churn. In fact, a 5% increase in retention can boost profits by up to 95%.
This shows that tracking the right KPIs and metrics helps businesses measure and improve customer satisfaction, retention, and engagement.
So, in this blog, you’ll learn:
What customer experience analytics is and why it matters.
10 key KPIs that reveal customer behavior.
Real-world examples of how businesses improve CX.
How to calculate, choose, and act on the metrics that matter.
Let’s explore how data can create better customer experiences.
What Is Customer Experience Analytics?
Customer experience analytics is the process of tracking and analyzing customer interactions across multiple touchpoints to understand their behavior, preferences, and satisfaction levels.
It helps businesses identify patterns that influence retention, loyalty, and overall engagement.

Through this approach, companies can measure key aspects such as:
How satisfied customers are with their interactions.
The effort required to resolve issues or complete a purchase.
The likelihood of customers recommending the brand.
By monitoring these metrics, businesses gain actionable insights to enhance customer journeys and foster long-term loyalty.
For example: An online store noticing a high cart abandonment rate can analyze customer experience data, such as slow checkout times or unclear pricing, and use these insights to make improvements, which can lead to better conversions and customer satisfaction.
CX metrics vs. business metrics: it helps to separate the two. Customer experience metrics, like CSAT, CES, and NPS, measure how customers feel about their interactions.
Business metrics, like customer acquisition cost, lifetime value, and revenue, measure company-side outcomes. Both matter, but they answer different questions: business metrics tell you what happened, while CX metrics help explain why. This guide focuses on the CX side.
Why Are Customer Experience Analytics KPIs Important?
Tracking customer experience analytics KPIs helps businesses measure, understand, and improve customer satisfaction. These metrics then provide clear insights that drive customer loyalty, engagement, and retention.
Here’s why they matter:
Identify pain points: Businesses can detect issues like slow support response times or confusing navigation.
Boost retention: Studies show that a 5% increase in retention can boost profits by up to 95%, so it’s important to keep track of CX metrics.
Enhance customer satisfaction: Monitoring KPIs like NPS and CSAT helps improve service quality.
Drive revenue growth: Companies that invest in CX analytics see 23% higher revenue than competitors.
So, when you know what’s made for customers and what’s not, it can proactively improve experiences, build stronger customer relationships, and drive long-term success.
10 Best KPIs and Metrics for Customer Experience Analytics
Measuring customer experience analytics requires tracking the right KPIs and metrics to understand satisfaction, engagement, and retention. Here are the 10 key CX metrics every business should monitor:
1. Net Promoter Score (NPS): Measuring Customer Loyalty
Net Promoter Score (NPS) measures how likely customers are to recommend your brand on a scale of 0 to 10.
Based on their responses, customers fall into three categories:
Promoters (9–10): Loyal customers who actively recommend your brand.
Passives (7–8): Satisfied but not enthusiastic enough to promote.
Detractors (0–6): Unhappy customers who may discourage others from using your brand.
Why NPS Matters:
Measures customer loyalty and overall satisfaction.
Helps predict business growth potential and retention rates.
Identifies brand advocates who can drive referrals.
Highlights areas where customer experience needs improvement.
How to Improve Your NPS:
Gather and act on customer feedback to address concerns.
Enhance customer support by providing multi-channel support and personalized interactions.
Engage passively satisfied customers by exceeding expectations.
Reward loyal customers with incentives, exclusive perks, or personalized discounts.
By improving NPS, businesses can strengthen customer relationships, increase referrals, and drive long-term growth.
Benchmark scale you need to look at:
Score | Meaning |
Above 50 | Excellent – Strong brand loyalty. |
20 - 50 | Good – Room for improvement. |
Below 20 | Poor – Address customer concerns. |
2. Customer Satisfaction Score (CSAT): Measuring Customer Happiness
Customer Satisfaction Score (CSAT) measures how happy customers are with a specific product, service, or interaction. Businesses typically collect CSAT scores through surveys that ask customers to rate their experience on a 1–5 or 1–10 scale.
Higher CSAT scores indicate satisfied customers, while lower scores highlight areas needing improvement.
Unlike NPS, which measures long-term loyalty, CSAT focuses on immediate customer sentiment after a specific interaction.
Why CSAT Matters:
Directly reflects customer happiness and satisfaction.
Helps evaluate service, product performance, and support quality.
Provides quick feedback for real-time improvements.
Correlates with customer retention and long-term loyalty.
How to Improve Your CSAT:
Respond promptly to customer concerns and support requests.
Ensure seamless, hassle-free service across all touchpoints.
Simplify the buying process and improve website/app navigation.
Personalize customer interactions based on preferences.
By improving CSAT, businesses can increase customer satisfaction, loyalty, and brand trust, leading to higher retention rates and repeat purchases.
Benchmark scale you need to look at:
Score | Meaning |
Above 85% | Excellent – Customers are highly satisfied. |
70% - 85% | Good – Consider minor improvements. |
Below 70% | Poor – Improve service quality. |
3. Customer Effort Score (CES): Measuring Ease of Customer Interactions
Customer Effort Score (CES) measures how easily customers can accomplish tasks or resolve issues with your brand.
It’s typically gathered through short surveys asking customers how much effort they had to put into completing an interaction, using a scale such as “Very Easy” to “Very Difficult.”
Lower effort indicates a smoother, friction-free experience, boosting satisfaction. Higher effort signals issues needing attention.
Why CES Matters:
Customers prefer simple, effortless interactions.
Lower effort experiences increase customer loyalty.
High effort can lead to frustration and churn.
Helps pinpoint customer experience bottlenecks.
How to Improve Your CES:
Streamline website navigation and simplify checkout processes.
Automate routine support interactions (chatbots, FAQs).
Train your team to resolve issues quickly and efficiently.
Provide clear self-service resources (help centers, knowledge bases).
Improving your CES means reducing friction in customer experiences—leading to happier customers, stronger loyalty, and better retention.
Benchmark scale you need to look at:
Score | Meaning |
Above 75% | Excellent – Customers find interactions effortless. |
60% - 75% | Good – Some areas may need improvement. |
Below 60% | Poor – Customers face difficulties. |
4. Customer Churn Rate: Measuring Customer Retention & Business Stability
Customer Churn Rate measures the percentage of customers who stop using your product or service over a given period.
It’s one of the most critical KPIs for businesses, as a high churn rate indicates customer dissatisfaction, competitive threats, or ineffective retention strategies.
Churn is particularly important for subscription-based businesses, SaaS companies, and service providers, where consistent customer retention directly impacts revenue and growth.
Why Churn Rate Matters:
High churn means losing recurring revenue and increasing acquisition costs.
Directly impacts long-term business sustainability and profitability.
Helps identify reasons customers leave and refine retention strategies.
A low churn rate signals strong customer satisfaction and loyalty.
How to Reduce Your Churn Rate:
Improve onboarding to ensure new customers see value quickly.
Address pain points by proactively resolving common customer frustrations.
Implement loyalty programs to encourage repeat business.
Re-engage inactive customers with personalized offers or targeted outreach.
By lowering churn, businesses can boost customer lifetime value (CLV), enhance revenue stability, and build long-term relationships with their audience.
Benchmark scale you need to look at:
Score | Meaning |
Below 5% | Excellent – Low customer turnover. |
5% - 10% | Good – Keep improving retention. |
Above 10% | Poor – High risk of losing customers. |
5. Retention Rate: Measuring Customer Loyalty & Business Growth
Retention Rate measures the percentage of customers who continue doing business with your company over a specific period.
A high retention rate indicates strong customer satisfaction and loyalty, while a low rate signals potential churn risks.
Retention is crucial because acquiring a new customer costs five times more than retaining an existing one.
It directly impacts revenue stability, long-term growth, and brand reputation.
Why Retention Rate Matters:
Indicates customer trust, satisfaction, and brand loyalty.
Improves revenue predictability and long-term business growth.
Lowers acquisition costs by reducing the need for constant new customers.
Strengthens brand reputation through positive customer relationships.
How to Improve Your Retention Rate:
Enhance customer service with proactive support and quick issue resolution.
Personalize interactions based on customer preferences and behavior.
Offer exclusive loyalty rewards to encourage repeat business.
Gather and act on feedback to continually refine the customer experience.
A strong retention rate ensures higher customer lifetime value (CLV), better engagement, and long-term revenue growth.
Benchmark scale you need to look at:
Score | Meaning |
Above 80% | Excellent – Strong customer loyalty. |
70% - 80% | Good – Room for improvement. |
Below 70% | Poor – Address retention issues. |
6. First Response Time (FRT) & Average Resolution Time (ART): Measuring Customer Support Efficiency
First Response Time (FRT) measures how quickly a business responds to customer queries, while Average Resolution Time (ART) tracks the total time taken to fully resolve an issue.
These metrics directly impact customer satisfaction, brand perception, and loyalty.
Customers expect quick and efficient support and delays can lead to frustration and churn.
Businesses that optimize FRT and ART can improve customer relationships and reduce operational costs.
Why FRT & ART Matter:
Faster responses enhance customer satisfaction and experience.
Shorter resolution times reduce frustration and support costs.
Quick, effective support strengthens brand credibility and trust.
Lower FRT and ART increase customer retention and loyalty.
How to Improve FRT & ART:
Implement AI chatbots for instant responses to common queries.
Train support teams to prioritize urgent tickets and complex issues.
Optimize workflows by streamlining ticket routing and escalation processes.
Offer self-service options like knowledge bases and FAQs for faster resolutions.
By improving FRT and ART, businesses can provide seamless customer support, reduce churn, and build stronger relationships.
Benchmark scale you need to look at:
Score (FRT) | Meaning |
Below 5 min | Excellent – Fast response. |
5 - 12 min | Good – Can improve efficiency. |
Above 12 min | Poor – Customers may get frustrated. |
7. Customer Lifetime Value (CLV): Measuring Long-Term Revenue Potential
Customer Lifetime Value (CLV) estimates the total revenue a customer is expected to generate throughout their relationship with a brand.
A high CLV indicates strong customer loyalty and engagement, while a low CLV suggests a need for better retention strategies.
CLV helps businesses understand how much they should invest in customer acquisition, retention, and engagement to maximize profitability.
Why CLV Matters:
Helps allocate marketing budgets effectively by focusing on high-value customers.
Predicts long-term revenue potential, ensuring sustainable business growth.
Identifies loyal customers who contribute the most to profitability.
Encourages customer engagement strategies that drive repeat purchases.
How to Improve CLV:
Upsell and cross-sell relevant products based on customer preferences.
Personalize interactions to enhance customer experience and retention.
Strengthen relationships through loyalty programs and proactive support.
Improve post-purchase engagement with follow-ups, offers, and educational content.
By increasing CLV, businesses can maximize customer value, profitability, and long-term success.
Benchmark scale you need to look at:
Score | Meaning |
Above $10,000 | Excellent – Highly valuable customers. |
$5,000 - $10,000 | Good – Strong customer base. |
Below $5,000 | Needs improvement – Increase value per customer. |
8. Customer Feedback & Sentiment Analysis: Understanding Customer Opinions
Customer Feedback & Sentiment Analysis measures and evaluates customer emotions, perceptions, and satisfaction through surveys, reviews, social media, and direct interactions.
By analyzing sentiment, businesses can clearly understand how customers truly feel about their brand, product quality, and overall experience.
Why Feedback & Sentiment Analysis Matter:
Reveals customer perceptions and areas needing improvement.
Helps identify issues proactively before they escalate.
Enhances product and service quality through actionable insights.
Strengthens brand reputation and customer trust.
How to Improve Feedback & Sentiment:
Proactively collect feedback via surveys, reviews, and social listening.
Quickly address negative sentiments to prevent further dissatisfaction.
Prioritize and improve areas identified by customers as weak.
Regularly monitor sentiment trends to adapt to changing customer expectations.
By leveraging Customer Feedback & Sentiment Analysis, businesses can better understand customer expectations, enhance customer satisfaction, and build long-lasting relationships.
Benchmark scale you need to look at:
Score | Meaning |
Above 75% | Excellent – Strong positive sentiment. |
60% - 75% | Good – Some mixed feedback. |
Below 60% | Poor – Needs attention. |
9. Website & App Experience Metrics: Enhancing Digital Customer Experiences
Website & App Experience Metrics like bounce rate, page load time, and session duration measure how users interact with your website or app.
They show the quality of your digital user experience and highlight areas for improvement.
These metrics help businesses pinpoint exactly where users may face difficulties, enabling them to enhance digital experiences and boost engagement.
Why Website & App Metrics Matter:
Directly impact customer engagement and satisfaction.
Strongly influence conversion rates and sales.
Reduce customer frustration and abandonment.
Improve overall brand perception and loyalty.
How to Improve Website & App Metrics:
Optimize loading speed to reduce wait times.
Enhance mobile responsiveness for better user experience across devices.
Simplify navigation so users easily find information and complete actions.
Personalize content recommendations to boost engagement.
By improving these digital experience metrics, businesses create smoother, more enjoyable online experiences that lead to higher customer satisfaction and greater conversions.
Benchmark scale you need to look at:
Metric | Ideal Benchmark |
Bounce Rate | Below 50% |
Page Load Time | Under 3 sec |
Session Duration | Above 2 min |
10. Social Media Engagement & Brand Perception: Measuring Your Brand’s Online Impact
Social Media Engagement & Brand Perception refers to how customers interact with your brand on social platforms, including likes, comments, shares, mentions, and overall sentiment.
Analyzing these interactions gives businesses insight into how audiences perceive their brand, content effectiveness, and areas needing attention or improvement.
Why Social Media Engagement & Brand Perception Matter:
Directly indicates overall brand reputation and public perception.
Measures the success of your content strategy and audience engagement.
Highlights opportunities for viral content and increased exposure.
Strengthens customer relationships and brand loyalty.
How to Improve Social Media Engagement & Brand Perception:
Share relevant, engaging content consistently to attract interactions.
Respond promptly to comments, messages, and mentions to foster community.
Collaborate with influencers to amplify brand reach and credibility.
Monitor trends and audience feedback to refine your social strategies regularly.
Improving these metrics helps businesses build stronger, positive relationships with their audience, enhancing long-term loyalty and growth.
Benchmark scale you need to look at:
Metric | Ideal Benchmark |
Engagement Rate | Above 2% |
Response Time | Under 1 hr |
Positive Sentiment | Above 75% |
By consistently monitoring these KPIs, businesses can refine their customer experience strategies, leading to higher retention, satisfaction, and revenue growth.
How to Calculate the Core CX Metrics
Most of the quantitative CX KPIs above share simple, standard formulas. Here is a quick reference you can apply to your own data:
Metric | Formula |
|---|---|
Net Promoter Score (NPS) | % of Promoters minus % of Detractors |
Customer Satisfaction Score (CSAT) | (Satisfied responses divided by total responses) times 100 |
Customer Effort Score (CES) | Average of the effort ratings on your survey scale |
Churn Rate | (Customers lost in the period divided by customers at the start) times 100 |
Retention Rate | ((Customers at the end minus new customers acquired) divided by customers at the start) times 100 |
Customer Lifetime Value (CLV) | Average purchase value times purchase frequency times average customer lifespan |
Calculating these consistently, over the same time windows, is what lets you compare periods and spot real trends rather than noise.
How to Leverage These KPIs for Better Customer Experience
Tracking customer experience KPIs is only the first step.
To truly improve customer satisfaction, businesses need to analyze these metrics and take meaningful action. Here’s how:
1. Collecting and Analyzing Data Effectively
Gather data from the right sources: post-interaction surveys, feedback forms, support tickets, review sites, and social listening.
Time surveys to the moment: send CSAT and CES right after an interaction, and run NPS on a set schedule.
Track multi-channel interactions (website, social media, chat, and in-store visits).
Segment customers based on behavior to identify trends and pain points.
2. Using Analytics Tools to Automate Insights
Use AI-powered analytics tools to uncover patterns and predict customer needs.
Integrate real-time dashboards for tracking KPIs without manual effort.
Use automated alerts to address negative feedback or service delays quickly.
3. Making Data-Driven Decisions to Improve CX
Adjust pricing, product offerings, and service based on customer feedback.
Optimize customer journeys by reducing friction points in digital and physical experiences.
Train support teams based on KPI insights to enhance service quality.
By actively measuring and acting on these tips, businesses can enhance customer retention, reduce churn, and boost brand loyalty.
Customer Engagement Analytics: 10 Metrics + Use Cases To Boost Engagement
How to Choose the Right CX KPIs for Your Business
You do not need to track all ten metrics at once. The most effective programs pick three to five core KPIs tied to the outcome they are trying to improve, then build from there.
Start from the business goal. If the priority is reducing churn, focus on Churn Rate, NPS, and CLV. If it is service quality, focus on CSAT, CES, and resolution times (FRT and ART).
Match the metric to the moment. Use CSAT and CES right after a specific interaction, and NPS or Retention Rate on a schedule to read longer-term loyalty.
Keep the set small enough to act on. A short list you review regularly beats a long dashboard nobody opens.
Review on a cadence. Many teams monitor a few live KPIs weekly and run deeper reviews monthly or quarterly to catch emerging trends.
Choosing deliberately keeps the focus on the metrics that actually move your business, instead of tracking everything and acting on nothing.
The Role of AI in Customer Experience Measurement
AI has changed how teams measure and act on customer experience, moving from manual reporting toward continuous, predictive analysis.
Automated sentiment and text analysis score sentiment, effort, and intent across survey responses, reviews, support tickets, and social posts at scale, rather than reading them one by one.
Predictive analytics flag customers at risk of churning before they leave, using behavioral signals like drops in usage or repeat escalations.
Real-time dashboards and automated alerts surface issues as they happen, so teams can respond to negative feedback or service delays quickly.
Used well, these capabilities shift CX work from describing what already happened toward anticipating and preventing problems, which is where most of the value now sits.
Real-World Use Cases of Customer Experience Analytics
Customer experience analytics helps businesses understand customer behavior, improve engagement, and reduce churn. Here are four real-world use cases across different industries:
1. E-commerce
How CX Analytics Helps:
Tracks purchase history to recommend relevant products.
Monitors browsing behavior to personalize discounts and offers.
Analyzes cart abandonment rates to optimize the checkout experience.
For example: An online fashion retailer used customer experience analytics to track repeat purchases and send personalized discount codes, increasing retention by 25%.
2. SaaS
How CX Analytics Helps:
Measures Customer Effort Score (CES) to improve onboarding.
Uses sentiment analysis to detect dissatisfaction early.
Tracks support interactions to identify high-risk churn users.
For example: A SaaS company found that customers who contacted support twice within the first month were 40% more likely to churn. By improving onboarding, they reduced churn by 15%.
3. Retail
How CX Analytics Helps:
Uses Net Promoter Score (NPS) to gauge customer satisfaction.
Analyzes feedback to optimize store layouts and reduce wait times.
Tracks online-to-offline purchase journeys for a better omnichannel strategy.
For example: A major electronics retailer used real-time feedback to identify long checkout times as a key issue. By adding self-checkout kiosks, they improved NPS by 18 points.
4. Financial Services
How CX Analytics Helps:
Tracks First Response Time (FRT) to reduce customer wait times.
Uses AI-driven chatbots to automate FAQs and reduce ticket volume.
Monitors transactional behavior to detect fraud risks.
For example: A digital bank used AI-powered support analytics to reduce average resolution time by 30%, leading to a 12% increase in customer satisfaction scores.
Want to read a real case study on how businesses use customer experience analytics to drive more loyalty and engagement?
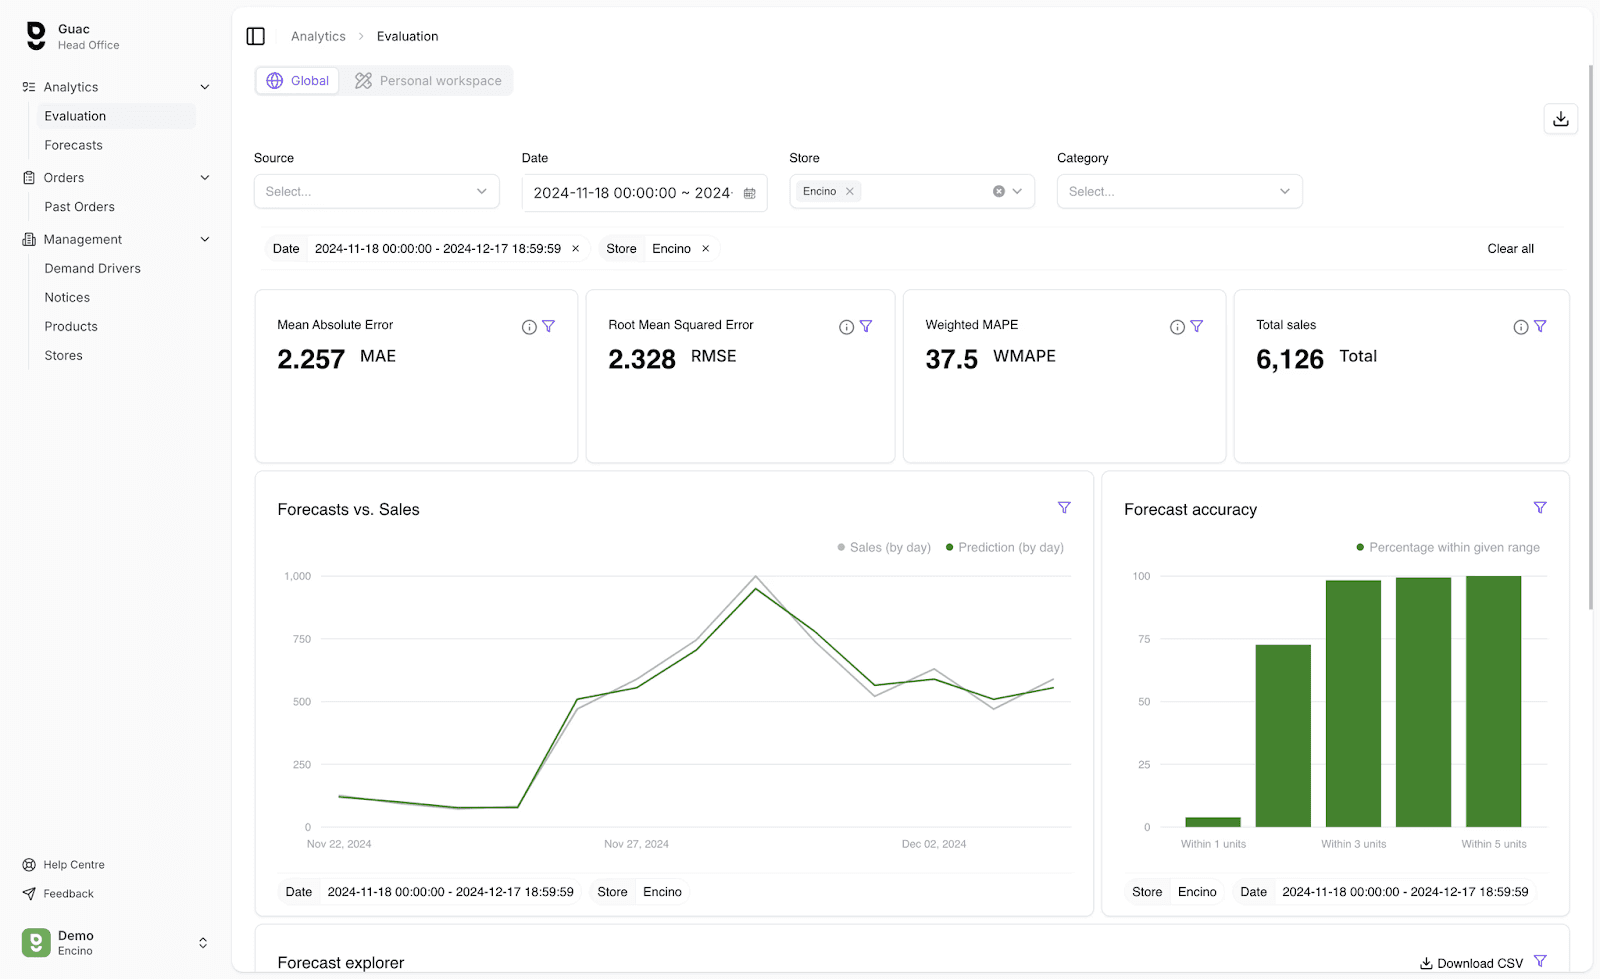
Guac leveraged Upsolve AI to embed real-time customer experience analytics into their platform, allowing users to track spending insights effortlessly.
This helped Guac enhance engagement and retention through data-driven decision-making.
👉 Read more success stories on how Upsolve AI transforms customer experience here.
Conclusion
Customer experience analytics isn't limited to simple data collection instead it helps you deeply understand customer behavior, boost retention, and build lasting relationships.
By tracking crucial KPIs like NPS, CSAT, and Customer Churn Rate, you can make smarter, data-driven decisions.
You don't have to tackle every metric immediately. Start with the two or three KPIs that map to your biggest goal, for example improving your First Response Time or personalizing experiences using Customer Lifetime Value (CLV).
Then surface them where teams and customers can act on them, embedding the metrics directly into the experiences you already run rather than leaving them in a separate report.
FAQs
1. What is customer experience analytics?
Customer experience analytics tracks and analyzes customer interactions to improve satisfaction, retention, and overall engagement.
2. Why are customer experience KPIs important?
They help businesses measure satisfaction, reduce churn, and optimize strategies for better customer engagement and loyalty.
3. Which KPIs should I track first?
Start with Net Promoter Score (NPS), Customer Satisfaction Score (CSAT), and Churn Rate to assess overall customer experience.
4. How can businesses improve customer experience using analytics?
By identifying pain points, personalizing interactions, and acting on real-time customer feedback for better engagement.
5. What is the best tool for customer experience analytics?
It depends on what you are measuring. Dedicated CX and feedback platforms are built for surveys, sentiment, and voice-of-customer analysis. If you also need to embed these KPIs into a customer-facing product, a product-analytics or embedded-analytics platform is the better fit. Match the tool to the metrics that matter most to you.

Try Upsolve for Embedded Dashboards & AI Insights
Embed dashboards and AI insights directly into your product, with no heavy engineering required.
Fast setup
Built for SaaS products
30‑day free trial


