
Learn how customer engagement analytics helps track behavior, improve retention, and drive growth using practical metrics and real-world use cases.

Ka Ling Wu
Co-Founder & CEO, Upsolve AI
10 min

Customer engagement rarely declines without warning. Before users churn, there are usually clear behavioral signals, such as reduced feature usage, longer gaps between sessions, or stalled activation.
Customer engagement analytics helps SaaS teams identify and interpret those signals. By analyzing how users interact with a product over time, teams gain a clearer view of what drives engagement, where it weakens, and how those patterns affect retention and growth. Rather than relying on assumptions, engagement analytics connects real in-app behavior to measurable outcomes.
When used effectively, customer engagement analytics allows product and growth teams to focus on the metrics that matter most, spot early risks, and take action to improve long-term engagement.
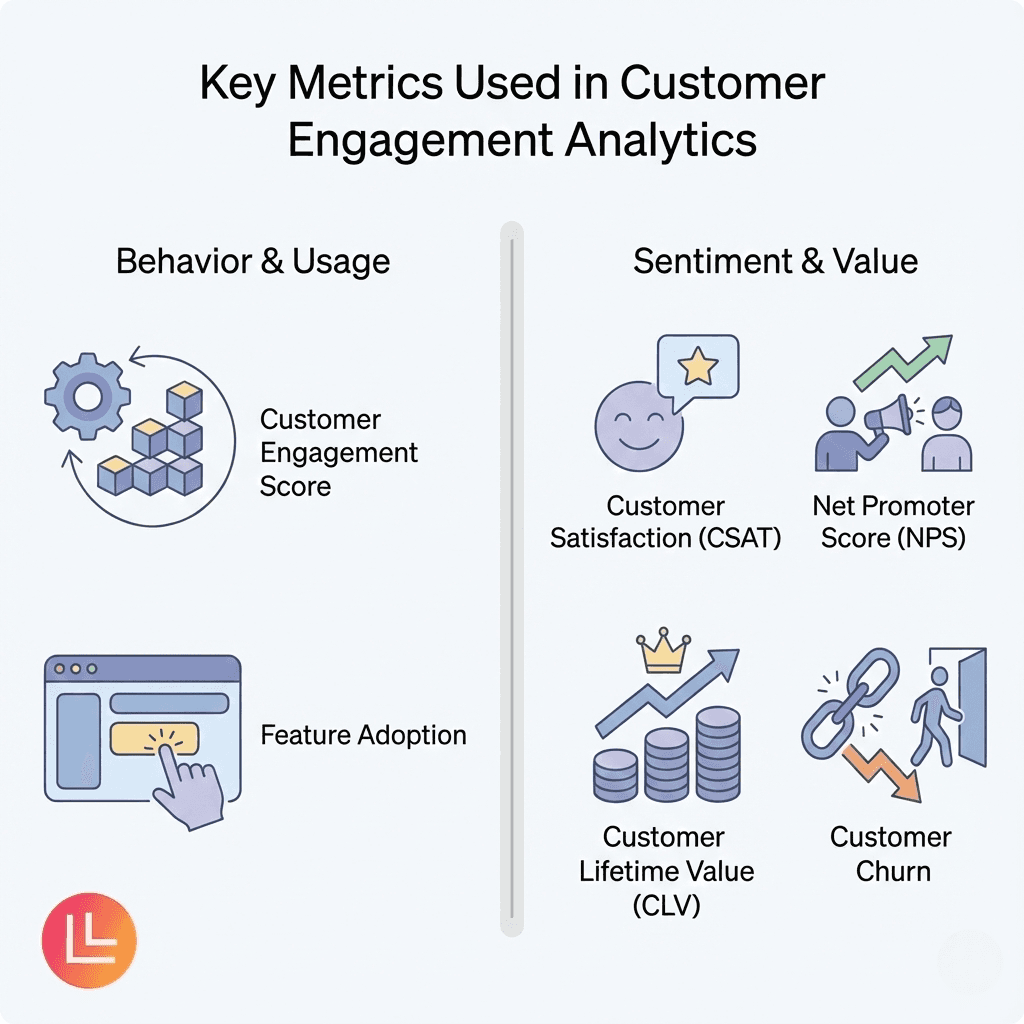
Below is an overview of the core customer engagement analytics metrics used by SaaS teams in practice.
What Is Customer Engagement Analytics?
Customer engagement analytics is the practice of measuring and analyzing how users interact with a product over time. It focuses on in-app behavior, feature usage, and customer health signals to understand whether users are finding ongoing value and staying engaged.
Unlike surface-level analytics that track isolated actions, customer engagement analytics connects interactions across the full user journey. It shows how often users return, which features they adopt, how their usage changes over time, and where engagement begins to decline.
While it overlaps with customer experience analytics, which often emphasizes sentiment and touchpoints across channels, customer engagement analytics focuses more narrowly on behavioral signals that indicate product value realization over time.
By analyzing these signals together, product and growth teams gain a clearer view of user intent and product value. This makes it easier to identify friction early, prioritize improvements, and support long-term retention and expansion.
Also Read: AI vs BI: 5 Key Differences to Know
Key Metrics for Customer Engagement Analytics
Metric | What It Tells You |
Customer engagement score | A combined signal showing how actively customers interact with your product over time |
Feature adoption rate | Whether customers are using the features that deliver core product value |
Engagement frequency | How often customers interact with your product within a defined period |
Product stickiness | How consistently customers return and whether usage becomes habitual |
Engagement recency | How recently a customer last interacted with your product |
Customer retention rate | How well customers continue using your product over time |
Customer churn rate | How many customers disengage or stop using your product |
Customer satisfaction score (CSAT) | How satisfied customers are after specific interactions or experiences |
Net promoter score (NPS) | How likely customers are to recommend your product to others |
Conversion rate | How often engaged users complete a meaningful action |
Customer lifetime value (CLV) | The long-term value a customer generates through continued engagement |
In practice, no single metric explains engagement on its own, which is why context and combinations matter more than isolated values. Instead of treating each metric as a standalone indicator, teams should understand what each metric leads, what it confirms, and what action it should trigger.
Because these signals need to be monitored together over time, teams often rely on customer analytics dashboards to track behavioral, outcome, and sentiment metrics in a single view.
Below are the core customer engagement metrics, rewritten with decision context and clear usage guidance.
1. Customer Engagement Score (Leading Indicator)
What it measures
Customer engagement score is a composite metric that combines multiple meaningful user actions into a single signal of overall engagement.
How it’s typically calculated
Teams assign weights to actions that represent value, such as feature usage, workflow completion, or account activity, and aggregate them over time.
Decision logic
Use engagement score when you need an early signal of customer health
Prioritize it when retention and churn have not yet moved
Treat trends as more important than absolute values
When it matters most
If engagement score drops while retention remains stable, it signals hidden friction that has not yet turned into churn.
2. Feature Adoption Rate (Value Realization Indicator)
What it measures
Feature adoption rate shows whether customers are using the features that deliver core product value.
How it’s calculated
The percentage of eligible users who meaningfully use a specific feature within a defined period.
Decision logic
High frequency + low adoption = shallow engagement
Low adoption early in the lifecycle = onboarding or positioning issue
Adoption stagnation = feature discoverability or usability gap
When it matters most
Feature adoption should be prioritized when engagement exists but retention is weak.
3. Engagement Frequency (Habit Indicator)
What it measures
Engagement frequency captures how often users interact with your product over time.
How it’s calculated
Count of meaningful actions per user within a defined window (daily, weekly, monthly).
Decision logic
High frequency suggests habit formation
Declining frequency signals weakening attachment
Frequency without adoption does not equal value
When it matters most
Use frequency to understand whether your product is becoming part of a customer’s routine.
4. Product Stickiness (Habit Strength Indicator)
What it measures
Product stickiness reflects how consistently users return to your product over time. It is commonly expressed as a ratio, such as daily or weekly active users divided by monthly active users, and captures how embedded the product is in a user’s routine.
Decision logic
High stickiness indicates strong habit formation
Low stickiness with steady acquisition suggests weak habit formation
Stickiness shows how habitual usage is, but not what drives it.
When it matters most
Use product stickiness to validate whether engagement frequency translates into sustained, repeat usage rather than sporadic activity.
5. Engagement Recency (Risk Indicator)
What it measures
Engagement recency tracks how long it has been since a customer last interacted with your product.
How it’s calculated
Time elapsed since the most recent meaningful action.
Decision logic
Recency is one of the strongest early churn predictors
Long recency gaps require immediate intervention
Combine with engagement score to prioritize outreach
When it matters most
Recency should be monitored continuously to trigger timely re-engagement.
6. Customer Retention Rate (Outcome Indicator)
What it measures
Retention rate shows how many customers remain active over a defined period.
How it’s calculated
The percentage of customers active at the end of a period compared to the start, excluding new users.
Decision logic
Retention confirms whether engagement efforts are working
Stable retention with falling engagement = future risk
Retention improves last, not first
When it matters most
Use retention to validate long-term impact, not as an early warning signal.
7. Customer Churn Rate (Failure Indicator)
What it measures
Churn rate reflects the percentage of customers who stop using your product.
How it’s calculated
Customers lost during a period divided by customers at the start of that period.
Decision logic
Churn is a lagging metric
Always analyze churn alongside engagement and adoption
Churn explains what happened, not why
When it matters most
Use churn to identify systemic problems and prioritize root-cause analysis.
8. Customer Satisfaction Score (Experience Indicator)
What it measures
CSAT captures how satisfied customers are after specific interactions.
How it’s calculated
Average or percentage-based rating collected immediately after a key touchpoint.
Decision logic
CSAT explains short-term sentiment
Drops often correlate with specific experiences
CSAT alone does not predict retention
When it matters most
Use CSAT to diagnose experience-level friction, not long-term engagement health.
9. Net Promoter Score (Loyalty Indicator)
What it measures
NPS measures customer loyalty and willingness to recommend your product.
How it’s calculated
Percentage of promoters minus detractors based on recommendation likelihood.
Decision logic
NPS reflects brand trust, not daily usage
Declining NPS can precede long-term churn
Best analyzed by cohort and lifecycle stage
When it matters most
Use NPS to understand advocacy and long-term perception.
10. Conversion Rate (Action Indicator)
What it measures
Conversion rate tracks how often users complete a defined meaningful action.
How it’s calculated
Users who convert divided by users exposed to the opportunity.
Decision logic
Low conversion with high engagement = friction in flows
Conversion improvements often yield immediate revenue impact
Always define conversions clearly by funnel stage
When it matters most
Use conversion rate to optimize activation, upgrades, and monetization moments.
11. Customer Lifetime Value (Impact Indicator)
What it measures
CLV estimates the total revenue a customer generates over time.
How it’s calculated
Average revenue multiplied by expected customer lifespan.
Decision logic
CLV connects engagement to financial outcomes
Use directionally, not as a precise forecast
Compare across segments to guide investment
When it matters most
Use CLV to prioritize high-value customers and justify retention investments.
How These Metrics Work Together
Indicator Category | Metrics Included | Strategic Intent |
Leading Indicators | Engagement score, feature adoption, recency | Surface early behavioral changes before retention or churn are affected |
Behavioral Indicators | Engagement frequency, product stickiness, conversion rate | Explain how customers interact with the product on an ongoing basis |
Outcome Indicators | Retention rate, churn rate, customer lifetime value (CLV) | Confirm whether engagement behavior results in long-term business outcomes |
Sentiment Indicators | CSAT, NPS | Add qualitative context to behavioral engagement signals |
Customer engagement metrics deliver the most value when interpreted together rather than in isolation. Each metric plays a different role, from early behavioral signals to long-term business outcomes. This distinction becomes especially important when comparing customer-facing analytics vs customer analytics, where engagement metrics often serve both internal teams and end users, depending on how insights are surfaced and consumed.
To simplify analysis, group metrics by what they indicate and when they become useful.
Leading indicators
These metrics surface early changes in customer behavior before retention or churn are affected.
Customer engagement score: Captures overall engagement trends across multiple behaviors
Feature adoption rate: Shows whether customers are realizing core product value
Engagement recency: Identifies early disengagement risk based on inactivity
Behavioral indicators
These metrics explain how customers interact with the product on an ongoing basis.
Engagement frequency: Measures how often users interact within a given period
Product stickiness: Indicates how consistently users return and whether usage becomes habitual
Conversion rate: Shows how effectively engagement translates into meaningful actions
Outcome indicators
These metrics confirm whether engagement and behavior result in long-term success.
Customer retention rate: Reflects sustained product value over time
Customer churn rate: Captures disengagement after value breaks down
Customer lifetime value (CLV): Connects engagement patterns to revenue impact
Sentiment indicators
These metrics add qualitative context to behavioral signals.
Customer satisfaction score (CSAT): Explains sentiment after specific experiences
Net promoter score (NPS): Measures loyalty and long-term brand advocacy
Rule of thumb
If leading and behavioral indicators decline, outcome metrics will follow. Teams that monitor engagement score, feature adoption, recency, and stickiness together can intervene early, before disengagement turns into churn.
To act on these signals consistently, teams need reliable access to behavioral, feedback, and lifecycle data across the customer journey.
Common Mistakes in Customer Engagement Analytics
Even well-instrumented teams often misinterpret engagement data by focusing on the wrong signals or viewing metrics in isolation. The most common mistakes include:
Relying on retention or churn alone: Retention confirms outcomes but rarely explains causes. Without leading indicators like engagement score, recency, or stickiness, teams react too late.
Tracking activity without value realization: High login frequency or session counts can mask shallow engagement if core features are not adopted or used meaningfully.
Treating stickiness as a vanity metric: Stickiness shows habit strength, not value delivery. Without context from feature adoption and outcomes, it can lead to false confidence.
Many of these misinterpretations are further compounded by data quality and data context challenges, where incomplete event tracking, inconsistent definitions, or delayed data make engagement signals harder to interpret reliably.
Legacy engagement metrics
Metrics such as bounce rate, average time on site, social media engagement, and repeat purchase rate are often used as engagement proxies. While useful for diagnosing channel and UX performance (web, marketing, content), they rarely explain why product engagement changes and should be interpreted alongside in-app behavioral metrics.
High bounce rate or short time-on-site: Can signal messaging mismatch or UX friction. Validate impact by checking conversion rate, recency, and feature adoption.
High social engagement: Shows content resonance. Confirm product impact by tracking conversion rate and downstream retention.
Repeat purchase rate: An outcome signal. Diagnose why it moves by checking feature adoption, recency, and conversion rate across cohorts.
How to Collect and Visualize Customer Engagement Analytics Data
Collecting customer engagement analytics starts with understanding where meaningful signals come from and how they fit together. Engagement is not captured through a single metric or tool. It emerges from a combination of behavioral data, feedback signals, and lifecycle outcomes.
Teams that collect these signals in isolation often struggle to connect engagement to decisions. A more effective approach is to align data sources with how mature your analytics capability is and how quickly insights need to turn into action.
Product usage and behavioral data
Behavioral data is the foundation of customer engagement analytics. It shows what customers actually do inside your product, including feature usage, session frequency, workflow completion, and progression through key moments.
This data is typically collected using:
Event tracking tools to capture in-product actions
Product analytics platforms to analyze usage patterns and cohorts
Data warehouses to store and combine raw event data over time
Web and marketing engagement data (GA4, landing pages, email, paid campaigns) to understand pre-product intent and acquisition quality.
At early stages, teams often track basic activity such as logins or sessions. As maturity increases, focus shifts toward value-based events, such as feature adoption, activation milestones, and repeated usage. These signals are essential for identifying engagement trends before retention or churn changes.
Customer feedback and experience signals
Behavior alone rarely explains why engagement changes. Feedback data adds qualitative context by capturing how customers feel about specific interactions and experiences.
Common feedback sources include:
CSAT surveys after onboarding, feature usage, or support interactions
NPS surveys to measure loyalty and advocacy
Support tickets and qualitative feedback from customer-facing teams
Feedback tools work best when connected to behavioral data. For example, pairing a drop in feature adoption with low CSAT after onboarding helps teams pinpoint friction faster than either signal alone.
Lifecycle and retention data
Lifecycle data connects engagement behavior to long-term outcomes. It helps teams understand how usage patterns relate to retention, churn, repeat behavior, and revenue.
This data often comes from:
Subscription and billing systems
CRM platforms
Retention and cohort analysis tools
By tracking engagement across lifecycle stages and cohorts, teams can identify when customers are most likely to disengage, which behaviors predict long-term value, and where intervention has the greatest impact.
Bringing engagement data together
Customer engagement analytics becomes actionable when these data sources are analyzed together in a single, consistent view. Many teams reach a point where data exists, but insights are slow to access because analysis depends on SQL queries, static dashboards, or data team availability.
For teams that already collect engagement data, the challenge is often turning it into accessible, decision-ready insights. This is where embedded analytics tools such as Upsolve can add practical value. Instead of building and maintaining static dashboards, teams can explore engagement trends, feature adoption, and cohort behavior directly on top of their existing data and share insights across product, marketing, and customer success.
[PLACEHOLDER: Screenshot - Engagement score trend over time visualized in Upsolve]
As analytics maturity increases, some teams go a step further by enabling AI-powered data agents to explore engagement metrics conversationally. Rather than navigating dashboards manually, teams can ask questions in natural language, such as “Which features are most correlated with retention?” or “How has engagement changed for new users this month?”, and receive structured, data-backed answers.
This agentic approach removes friction between data and decisions by allowing non-technical teams to interact with engagement metrics conversationally, while still operating on governed, trusted data.
[PLACEHOLDER: Screenshot - Natural language query or AI agent interface analyzing engagement or feature adoption trends in Upsolve]
For teams moving into the execution stage, combining visualization with AI-driven exploration:
Shortens the time from signal to decision
Makes engagement insights accessible beyond analysts
Reduces reliance on ad-hoc queries and custom dashboards
Supports faster iteration on onboarding, feature adoption, and retention strategies
The goal is not more tools, but faster understanding and clearer action based on the engagement signals that matter most.
[CTA BLOCK: See how Upsolve visualizes data]
Real-Life Use Cases of Customer Engagement Analytics
Customer engagement analytics delivers value when metrics lead to clear decisions. These examples show how teams combine engagement signals to diagnose issues and drive measurable improvements.
Boosting repeat-purchase retention with CSAT and engagement recency
Problem
A retail brand saw strong first-purchase conversion but low repeat purchases.
Insight
Customers with low CSAT scores were 32% less likely to return within 30 days. These users also showed longer gaps in engagement recency, indicating early disengagement.
Action
The team improved post-purchase communication and delivery transparency.
Result
Repeat-purchase retention increased by 25% across new customer cohorts.
Metrics used: CSAT, engagement recency, retention rate
Improving loyalty by aligning NPS with feature adoption
Problem
A SaaS company experienced subscription cancellations after the first contract period despite steady usage.
Insight
Users who adopted core features within the first two weeks had 2x higher NPS than users with frequent but shallow usage.
Action
Onboarding was redesigned to guide users toward high-impact features earlier.
Result
The share of promoters increased by 30%, contributing to stronger long-term retention.
Metrics used: NPS, feature adoption rate, engagement frequency
Reducing churn using recency and product stickiness
Problem
An e-commerce platform faced rising churn without clear early warning signals.
Insight
Customers with declining product stickiness were 40% more likely to churn within the next month, even if they had been active previously.
Action
The team launched targeted re-engagement campaigns based on inactivity thresholds.
Result
Customer churn decreased by 18%, while repeat purchases increased by 12%.
Metrics used: Engagement recency, product stickiness, churn rate
How to Start with Customer Engagement Analytics
Getting started with customer engagement analytics does not require complex setups or dozens of metrics. The goal is to focus on a small number of signals that clearly show how customers interact with your product and where engagement improves or drops over time.
1. Define what engagement means for your business
Before selecting metrics, clarify which behaviors represent meaningful engagement in your context. For some teams, this may be feature usage or repeat actions. For others, it may be retention, satisfaction, or conversion. Defining this upfront ensures you measure value, not surface activity.
2. Select a focused set of engagement metrics
Avoid measuring everything at once. Start with two or three metrics that align directly with your goal. For example, engagement score and feature adoption help assess long-term value, while engagement recency and conversion rate surface short-term intent. A narrow focus makes patterns easier to identify and act on.
3. Collect engagement data across key touchpoints
Engagement data should reflect the full customer journey. This typically includes product usage, key actions, feedback signals, and lifecycle events. Centralizing these signals into a single view makes it easier to compare segments, track trends, and maintain consistency over time.
4. Analyze patterns instead of isolated numbers
Look for changes in engagement over time rather than reacting to single data points. Declining usage, stalled feature adoption, or increasing inactivity often signal friction before churn appears. Segmenting users by behavior or lifecycle stage helps reveal where engagement breaks down.
5. Turn insights into action and iterate
Customer engagement analytics only delivers value when it informs decisions. Use insights to improve onboarding flows, refine feature discovery, adjust messaging, or personalize re-engagement efforts. Track results, learn from changes, and refine your approach continuously.
Must Read: How to use AI for Data Visualization?
Conclusion
Customer engagement analytics helps teams move from assumptions to evidence by revealing how customers actually interact with a product over time. When engagement signals are tracked together, rather than in isolation, they expose early risks, clarify what drives value, and connect behavior to retention and growth.
To get started, focus on a small set of metrics that reflect real engagement. Track engagement score, feature adoption, recency, and stickiness weekly to spot early changes in behavior. Use retention and churn to validate long-term impact, and tie improvements back to clear retention goals. When engagement data is used consistently and acted on early, it becomes one of the most reliable tools for improving customer experience and sustaining growth.
FAQs
What is the difference between customer engagement analytics and product analytics?
Customer engagement analytics focuses on understanding how users interact with a product over time and how those behaviors relate to retention, satisfaction, and growth. Product analytics is broader and may include performance, feature usage, experiments, and funnels. Engagement analytics is a subset of product analytics, centered specifically on user behavior and ongoing value realization.
Which customer engagement metrics matter most for SaaS teams?
The most valuable metrics depend on goals, but SaaS teams typically prioritize engagement score, feature adoption, engagement recency, and product stickiness as leading and behavioral indicators. Retention and churn confirm outcomes, while CSAT and NPS add sentiment context. No single metric is sufficient on its own.
How often should customer engagement metrics be reviewed?
Leading and behavioral metrics such as engagement score, recency, and stickiness should be reviewed weekly to detect early changes. Outcome metrics like retention, churn, and CLV are better reviewed monthly or quarterly to validate long-term impact. The key is consistency, not frequency.
Can customer engagement analytics predict churn?
Customer engagement analytics does not predict churn directly, but it surfaces early behavioral signals that often precede churn. Declining engagement score, reduced feature adoption, increasing inactivity, or weakening stickiness usually appear weeks before churn occurs, allowing teams to intervene early.

Try Upsolve for Embedded Dashboards & AI Insights
Embed dashboards and AI insights directly into your product, with no heavy engineering required.
Fast setup
Built for SaaS products
30‑day free trial


