
Comparison of nine embedded analytics tools, covering features, pricing, scalability, integrations, and which platforms fit startups, SaaS, and enterprises.

Ka Ling Wu
Co-Founder & CEO, Upsolve AI
10 min

Finding the right embedded analytics tool isn’t easy, especially when many platforms look similar but behave very differently once embedded into a real product.
Some tools work well for internal dashboards but struggle with customer-facing analytics. Others offer flexibility but require heavy engineering effort or unclear pricing as you scale.
To make this easier, we tested and reviewed nine embedded analytics tools used by SaaS teams and product leaders. Each tool was evaluated based on setup effort, embedding options, pricing, scalability, and suitability for customer-facing analytics.
In this guide, you’ll learn:
What embedded analytics tools are and how they work
Which platforms fit startups, growing SaaS teams, or enterprises
How pricing and trade-offs differ across embedded BI tools
By the end, you’ll know which embedded analytics tool best fits your product, team, and budget without wasting time on trial and error.
What Are Embedded Analytics Tools?
Embedded analytics tools are software that seamlessly integrates analytics features into your apps or websites, allowing you to view, analyze, and interact with data directly within the platform you already use.
These tools eliminate the need to switch between applications, making insights more accessible and actionable.
How Do Embedded Analytics Tools Work?
These tools embed dashboards, charts, and data visualization capabilities directly into your business software.
They pull raw data from multiple sources, process it in real-time, and present it visually engagingly.
For example:
If you’re running an e-commerce platform, embedded analytics can show your sales trends on your admin dashboard.
Or, if you’re using a customer service app, it might display customer satisfaction metrics directly on your team's interface.
In short, embedded analytics tools show you data insights exactly where you need them with no extra clicks or tools required.
Why Are Embedded Analytics Tools Important for Your Business?
Using embedded analytics tools can make a world of difference for your business. Here’s why:
Improves Decision-Making: When data insights are embedded into your workflow, you can make faster and better decisions without wasting time switching between apps.
Enhances User Experience: Customers and employees get all the insights they need in one place, which saves time and reduces frustration.
Saves Money and Effort: Instead of building custom analytics tools, you can use pre-made ones that fit right into your system.
Boosts Business Growth: By identifying trends and opportunities quickly, you can take action and stay ahead of your competitors.
Why Choosing the Right Tool is Important?
With so many options, picking the right embedded analytics tool might feel overwhelming. But you could easily do it by focusing on tools that:
It is easy to integrate with your software.
Have user-friendly dashboards that anyone on your team can understand.
Offer scalable features to grow your business.
Choosing the right embedded tool can save time, reduce complexity, and give your business the edge it deserves without adding any add-ons.
Also Read: Top 5 Embedded BI Tools to Test
Top 9 Embedded Analytics Tools for SaaS (Pros, Cons & Pricing)
If you’re in a hurry, here's a quick comparison of the best-embedded analytics tools that will help you decide quicker without going through each tool's information.
Tool | What It Does | Pros | Cons |
Upsolve.ai | Integrates analytics right into your apps | • ✅ Easy setup• ✅ User-friendly• ✅ Real-time data• ✅ Good support | • ❌ Limited theme options |
Power BI | Adds analytics to Microsoft-based tools | • ✅ Rich visuals• ✅ Works with Microsoft• ✅ Scalable | • ❌ Might need a Microsoft account |
Tableau Embedded Analytics | Embeds visuals into your platforms | • ✅ Strong visuals• ✅ Many data sources• ✅ Customizable | • ❌ Steep learning curve |
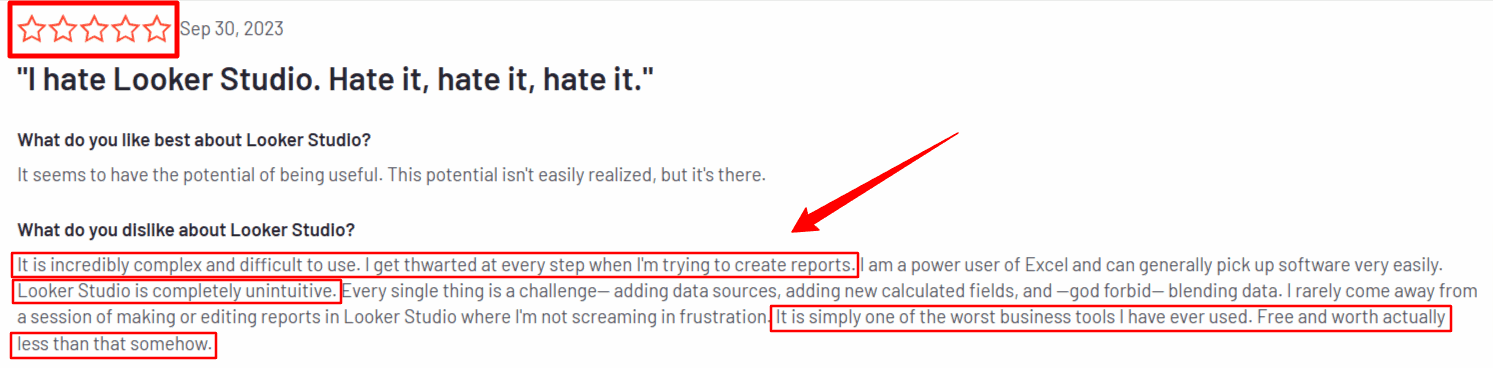
Looker | Places data insights inside your workflows | • ✅ Detailed reports• ✅ Smart filters• ✅ Easy sharing | • ❌ Higher cost for advanced features |
Sisense | Puts analytics inside your apps and portals | • ✅ Scalable• ✅ Flexible• ✅ Good for large data | • ❌ May need tech support |
Klipfolio | Embeds dashboards into your sites or apps | • ✅ Simple UI• ✅ Many integrations• ✅ Easy customization | • ❌ Limited advanced functions |
Qlik Sense Embedded Analytics | Places analytics inside your existing tools | • ✅ Fast queries• ✅ Good automation• ✅ Flexible design | • ❌ Pricing can get high |
Google Data Studio | Embeds free dashboards and charts into your pages | • ✅ Free• ✅ Easy Google integration• ✅ Quick setup | • ❌ Limited advanced features |
TIBCO Spotfire | Embeds analytics with strong visual capabilities | • ✅ Deep insights• ✅ Advanced visual tools• ✅ Supports complex data | • ❌ May feel complex to beginners |
This comparison gives you a quick insight into the embedded analytics tool's ins and outs and may help you make better decisions.
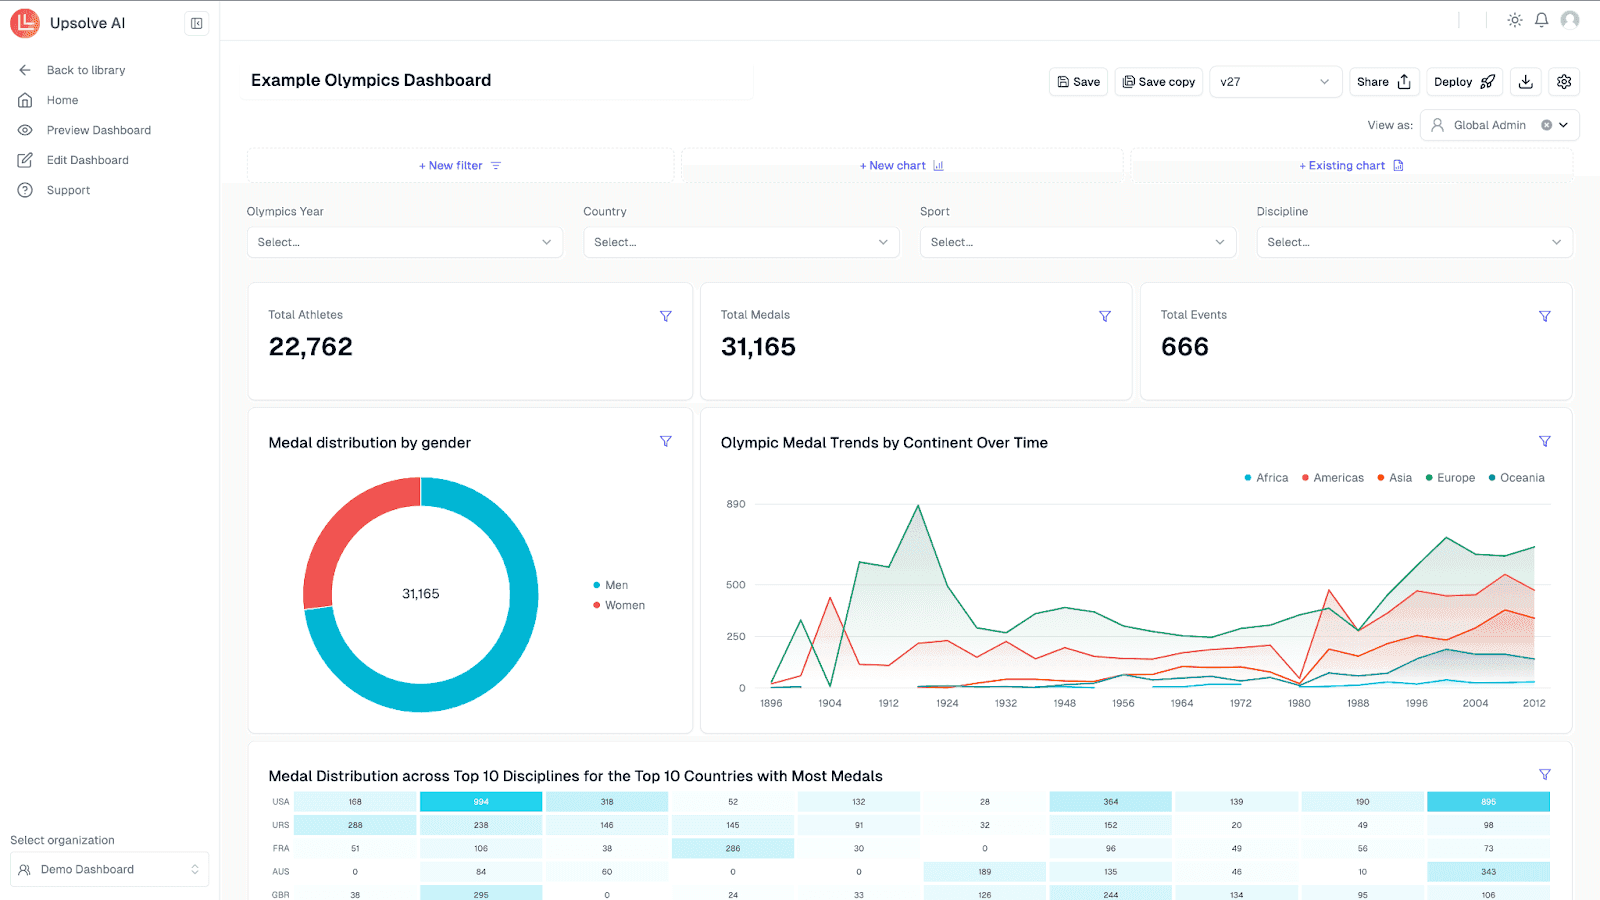
Upsolve
Upsolve is an excellent choice for businesses integrating easy-to-use, interactive analytics directly into your apps or websites. It simplifies complex data into clear and actionable insights that anyone can understand in just minutes.
Whether you aim to enhance customer engagement, improve decision-making, or boost your business growth, Upsolve brings data to the forefront, making it accessible and impactful for businesses of all sizes.
Key Features
Intuitive Dashboards: Upsolve helps you build user-friendly dashboards that provide valuable insights in one place. These dashboards are interactive and designed to be explored easily.
Real-Time Data Insights: The platform provides instant updates, so you always have the most accurate data to make timely decisions.
Seamless Integrations: Upsolve supports a wide range of integrations from databases to data warehouses, making it flexible for various business needs.
Customizable for Users: Empower your customers or teams to personalize dashboards to suit their needs, reducing dependency on technical support and saving time.
Pros and Cons
✅ Pros:
Easy to set up and navigate, even for beginners.
Offers real-time data visualization for quick decision-making.
Highly customizable dashboards tailored to user preferences.
Seamlessly integrates with the most popular data sources.
❌ Cons:
Some advanced features may require additional learning.
Upsolve AI Pricing
Upsolve AI offers a free plan plus three paid tiers; embedding and multi-tenant analytics start on the Team plan ($2,000/mo).
Free ($0): 2,000 one-time credits (~200 questions); all Pro features, to test-drive
Pro ($500/mo): 2,000 credits/month; 50+ data connections, unlimited agents, full observability
Team ($2,000/mo): 10,000 credits/month; adds embedding, RBAC/row-level security, multi-tenant, and semantic-layer generation
Enterprise (custom): on-prem/VPC, SAML SSO, HIPAA, SOC 2, and BYOM
Annual billing is 20% off.
Upsolve stands out for its simplicity, flexibility, and scalability, making it a top choice for businesses that integrate embedded analytics into their workflows.
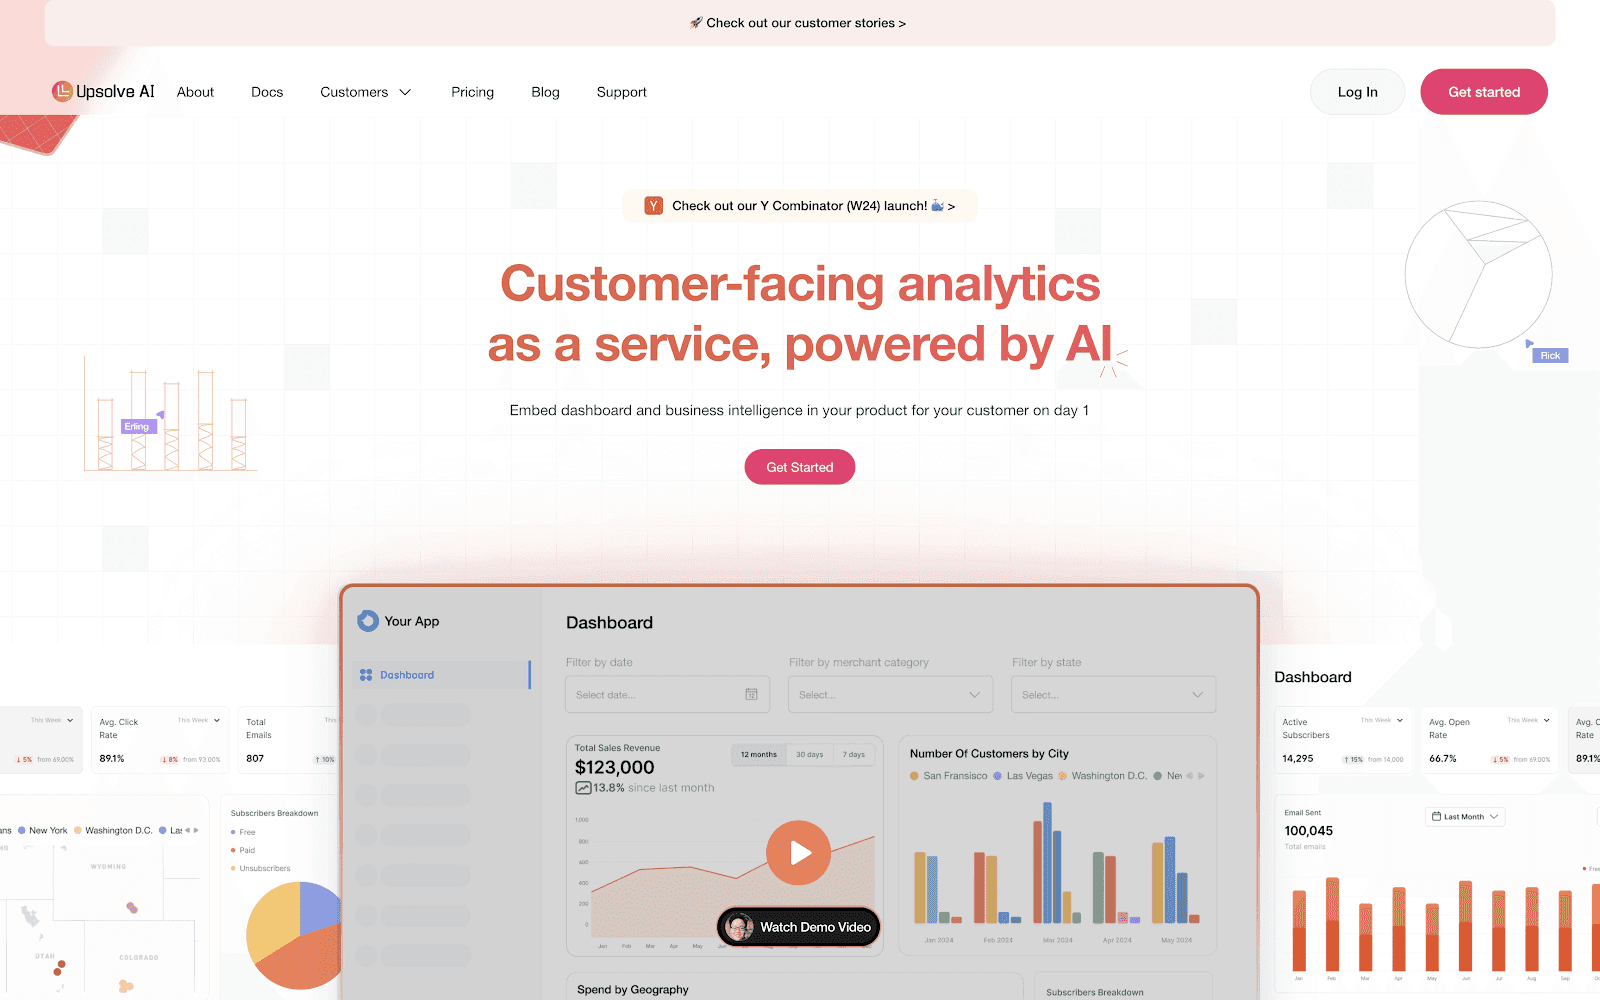
Embeddable
Embeddable is a modern embedded analytics platform built for product and engineering teams.
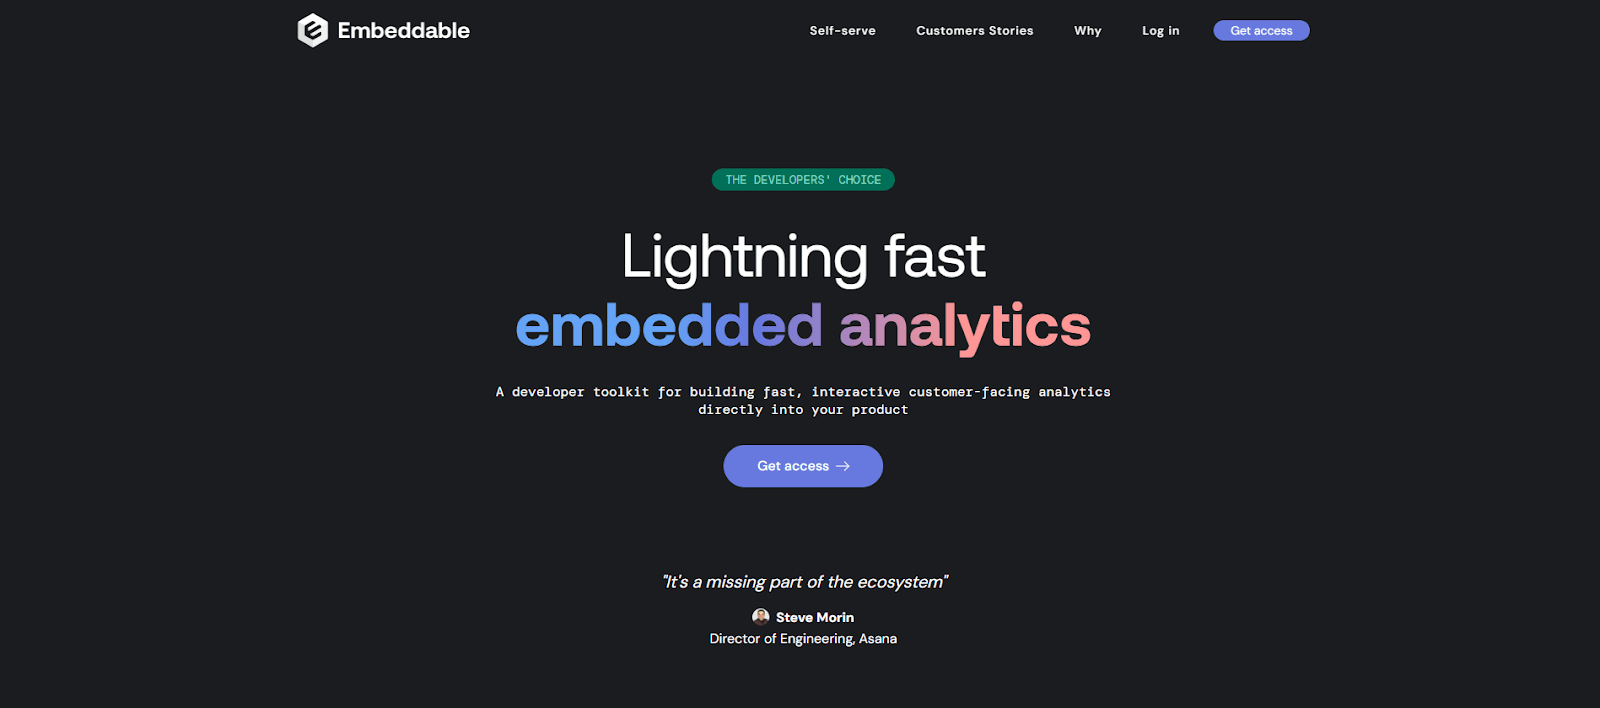
It combines no-code dashboard building and developer-level extensibility so SaaS companies can ship fully native, high-performance analytics experiences inside their apps — without long dev cycles or compromising on UI/UX.
Key Features
Secure, lightweight and performant embedding via web components or React/Vue SDKs (no iframes)
Millisecond-level load times via fast data service and multi-layer caching
Full code-level control over styling, theming, and chart behavior
Developer tools: SDKs, APIs, CI/CD integration, version control
End-user features: localization, exports, drilldowns, self-serve dashboards etc.
Seamless support for single-tenant and multi-tenant SaaS models
Use Case
A fast-growing SaaS company used Embeddable to improve its dashboard offering within its web application. By adopting Embeddable, the team was able to iterate faster and continuously ship new ways of visualizing data for customers, creating a stronger foundation for product growth.
Why It Stands Out
Embeddable built a new architecture specifically to deliver customer-facing analytics. Whilst remaining familiar and easy for teams to get to value, its re-imagining of embedded analytics with the product, engineering and the end customer in mind enables it to deliver speed, customisability and compatibility in a way that leaves its customers thinking ‘why has nobody built this before’. The result is a customer-facing analytics experience that feels native, performs superbly at scale, and keeps both your product and engineering teams happy along the way.
Power BI Embedded
Power BI Embedded is a leading choice for businesses already leveraging Microsoft tools. It allows you to embed rich, interactive analytics into your apps, making it an ideal solution for businesses prioritizing visualization and scalability.
Key Features
Rich Visualizations: Power BI Embedded is known for its advanced visuals, including custom charts, graphs, and detailed reports that bring your data to life.
Microsoft Integration: Seamlessly integrates with the Microsoft ecosystem, including Azure, Excel, and SharePoint, ensuring a smooth workflow.
Scalability: Whether a small business or an enterprise, Power BI Embedded adapts to your growing needs without compromising performance.
Embedded Reports: It allows users to interact with reports directly within your app, providing a smooth and engaging experience.
Pros and Cons
✅ Pros:
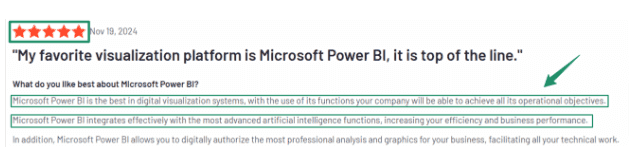
Provides powerful data visualization capabilities.
Integrates seamlessly with Microsoft tools for enhanced functionality.
Offers scalable options for businesses of all sizes.
Highly customizable to meet diverse analytics needs.
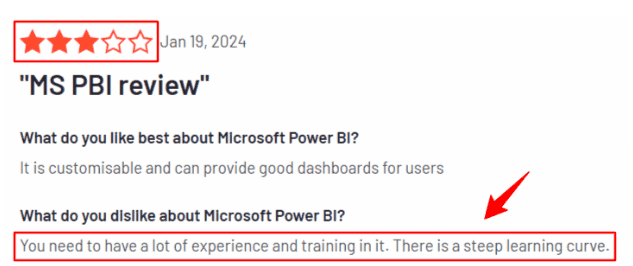
❌ Cons:
Requires a Microsoft account for integration.
It may have a steeper learning curve for non-technical users.
Power BI Pricing
Power BI Embedded offers flexible pricing options depending on your usage and needs:
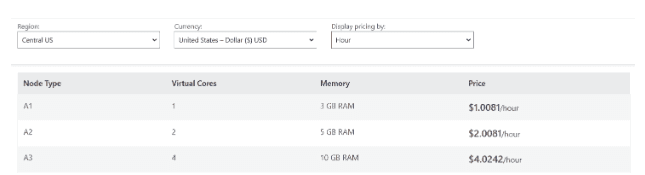
Per Session Pricing: Starting at $1 per session, it’s ideal for small businesses with low-volume requirements.
Per Capacity Pricing: This plan, starting at $735 per month, suits larger businesses needing consistent high-performance analytics.
Pricing is based on usage, so you pay only for what you need, making it cost-effective for businesses at all stages.
Why Choose Power BI Embedded?
Power BI Embedded is a natural choice if your business already uses Microsoft tools. Its ability to deliver stunning visuals and integrate seamlessly with familiar software makes it a standout option.
Plus, its scalability ensures that as your business grows, your analytics capabilities grow with it.
Tableau Embedded Analytics
Tableau Embedded Analytics is a top-tier choice for businesses that need powerful data visualization and analytics capabilities embedded directly into their platforms.
With its focus on customization and integration, Tableau makes analyzing and sharing data seamless and impactful.
Key Features
Advanced Visualizations: Tableau offers highly detailed and customizable visuals, from heat maps to interactive dashboards, to help your data achieve desired results.
Customizable Reports: Tailor reports to meet specific business needs, giving users relevant and actionable insights.
Seamless Data Integration: Connects effortlessly with various data sources, including databases, cloud platforms, and CRMs, providing a unified view of your data.
Real-Time Insights: Tableau processes data in real-time, helping you stay updated on critical metrics as they change.
Pros and Cons
✅ Pros:
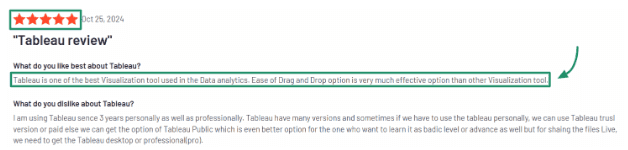
Delivers rich, interactive visualizations that are easy to share.
Supports integration with multiple data sources for a holistic view.
Offers extensive customization to match specific business workflows.
Enables real-time analytics for fast decision-making.
❌ Cons:
Comes with a steeper learning curve for new users.
Pricing can be high, especially for smaller businesses.
It needs more system resources, so it can slow down if you have a lot of data.
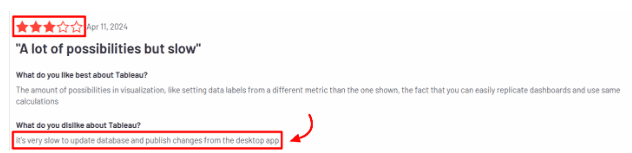
Tableau Embedded Analytics Pricing
Tableau offers flexible pricing catering to different business needs:
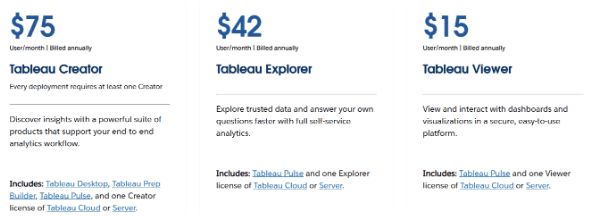
Tableau Viewer ($15/user/month): For users needing dashboard access.
Tableau Explorer ($42/user/month): Designed for users who need data exploration and reporting capabilities.
Tableau Creator ($75/user/month): Includes complete data prep, reporting, and dashboard creation capabilities.
Custom enterprise pricing is also available for larger businesses with specific requirements.
If your business values are highly customizable and visually stunning analytics, Tableau Embedded Analytics is an excellent choice. It’s perfect for organizations that need deep insights into complex data and want better results.
Looker
Looker is a cloud-based embedded analytics tool designed to help teams access their data without complexity. Its focus is on flexible data modeling, real-time insights, and intuitive dashboards.
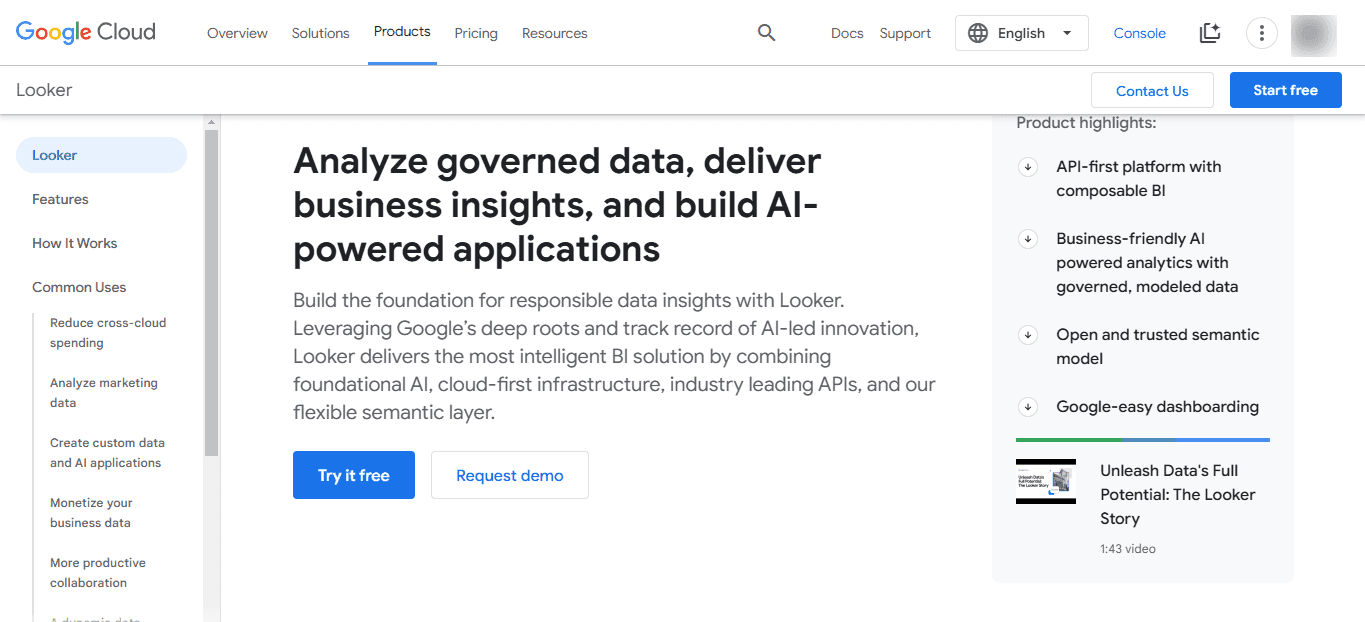
It offers a smart alternative to Power BI for businesses that need a cloud-first approach.
Whether you’re a startup looking to scale or an established enterprise seeking more efficient analytics, Looker delivers powerful reporting features that let you uncover patterns, understand trends, and make quick, well-informed decisions.
Key Features
Advanced Data Exploration: Quickly access insights through real-time views, customizable reports, and LookML, which helps define data relationships.
Powerful Dashboards: Build and edit dashboards by dragging and dropping widgets, diving deep into metrics, and setting alerts for important updates.
Seamless Integrations: Connect with various cloud databases, CRMs, and APIs to make data flow naturally into your daily operations.
Embedded Analytics: Embed analytics into your product, use white-label options, and rely on a scalable architecture that grows with your business.
Pros and Cons
✅ Pros:
Flexible exploration tools that make customizing data views simple.
Interactive dashboards that highlight essential details and trends.
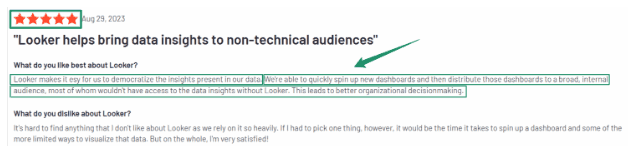
Scalable solutions that fit both small startups and large enterprises.
❌ Cons:
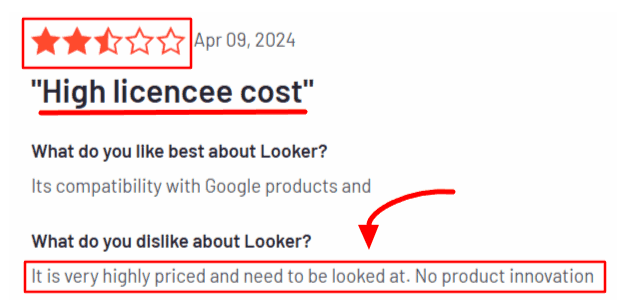
Learning LookML can be tough if you’re not tech-savvy.
Pricing might feel high for smaller teams with limited budgets.
Looker Pricing
Looker doesn’t list prices openly. Instead, it offers customized plans based on:
The number of users you need to support
The specific features and integrations you require
Your choice between cloud or on-premise deployment
For a precise quote, you’ll need to contact Looker directly. It’s generally best suited for mid-sized to large companies with more complex analytics needs. If you want to know how much the Looker may charge? Read here the detailed Looker pricing breakdown!
Sisense
Sisense is a powerful embedded analytics tool built for businesses with large datasets needing advanced analytics.
Whether you’re creating internal reports or customer-facing dashboards, Sisense offers a complete solution that simplifies data preparation, visualization, and embedding all in one platform.
Key Features
End-to-End Analytics: Sisense's Elastic Data Hub lets you clean, merge, and transform data from multiple sources. You can embed dashboards into apps or websites, making insights accessible in real-time.
Scalable Architecture: It handles massive datasets with ease. Sisense’s architecture ensures high performance as your data and user base grows, with deployment options for cloud, on-premise, or hybrid setups.
Wide Data Integrations: It connects seamlessly to various sources, from cloud databases like Amazon Redshift to on-premise systems like SQL Server. You can even use APIs for custom data connections.
Custom Alerts and Automation: When key metrics change, you will receive alerts via email or Slack. The system also automates workflows and schedules reports to keep your team in sync with the latest insights.
Pros and Cons
✅ Pros:
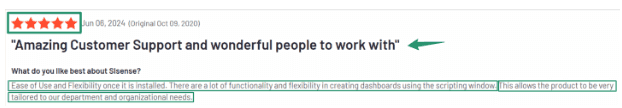
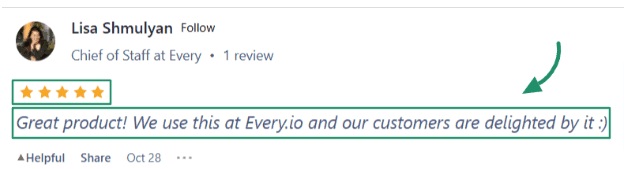
Alt tag: User review highlighting Sisense’s customer support, flexibility, and dashboard customization capabilities
Handles large, complex datasets efficiently.
Highly customizable for embedding analytics into your platforms.
It is scalable for businesses of any size, making it a long-term solution.
❌ Cons:
Learning the platform can be challenging, especially for non-technical users.
Higher upfront costs might be a hurdle for smaller businesses.
Sisense Pricing
Sisense offers custom pricing created for different business needs. Factors that influence pricing include:
The number of users and data sources.
Deployment preferences (cloud, on-premise, or hybrid).
Advanced features like AI tools or embedding options.
You’ll need to contact Sisense directly for a quote. Its robust capabilities make it a favorite for mid-sized and large enterprises that require a reliable and scalable analytics platform.
Also Read: 5 Best Sisense Competitors or Alternatives You Must Try In 2025
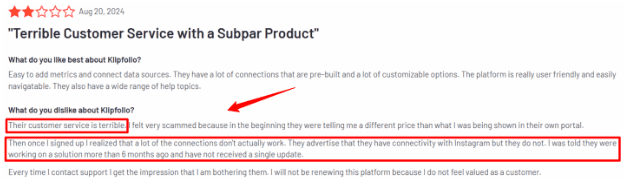
Klipfolio
Klipfolio is an easy-to-use embedded analytics tool designed for small to medium businesses. It focuses on helping teams create beautiful, interactive dashboards without needing advanced technical skills.
Klipfolio is perfect if you’re looking for a cost-effective way to make data insights accessible and engaging for your team or customers.
Key Features
Customizable Dashboards: Build dashboards with a drag-and-drop interface that lets you easily display metrics, KPIs, and data visualizations.
Data Integrations: Connect Klipfolio to a wide variety of data sources, including spreadsheets, cloud services like Google Analytics, and databases, to pull all your data into one place.
Real-Time Data Updates: Stay on top of key metrics with dashboards that update in real-time, ensuring you’re always working with the latest data.
Embedding Capabilities: Klipfolio allows you to embed analytics into your applications or websites, offering customers a seamless experience with branded visuals.
Pros and Cons
✅ Pros:
Simple and intuitive dashboard creation for non-technical users.
Affordable pricing makes it ideal for small businesses.
Supports real-time updates to keep your data fresh and accurate.
Offers flexible integrations with popular tools and data sources.
❌ Cons:
Limited advanced features compared to enterprise-level analytics tools.
Customization options might feel basic for more complex use cases.
Klipfolio Pricing
Klipfolio offers straightforward pricing with both monthly and discounted annual plans, making it flexible for growing teams.
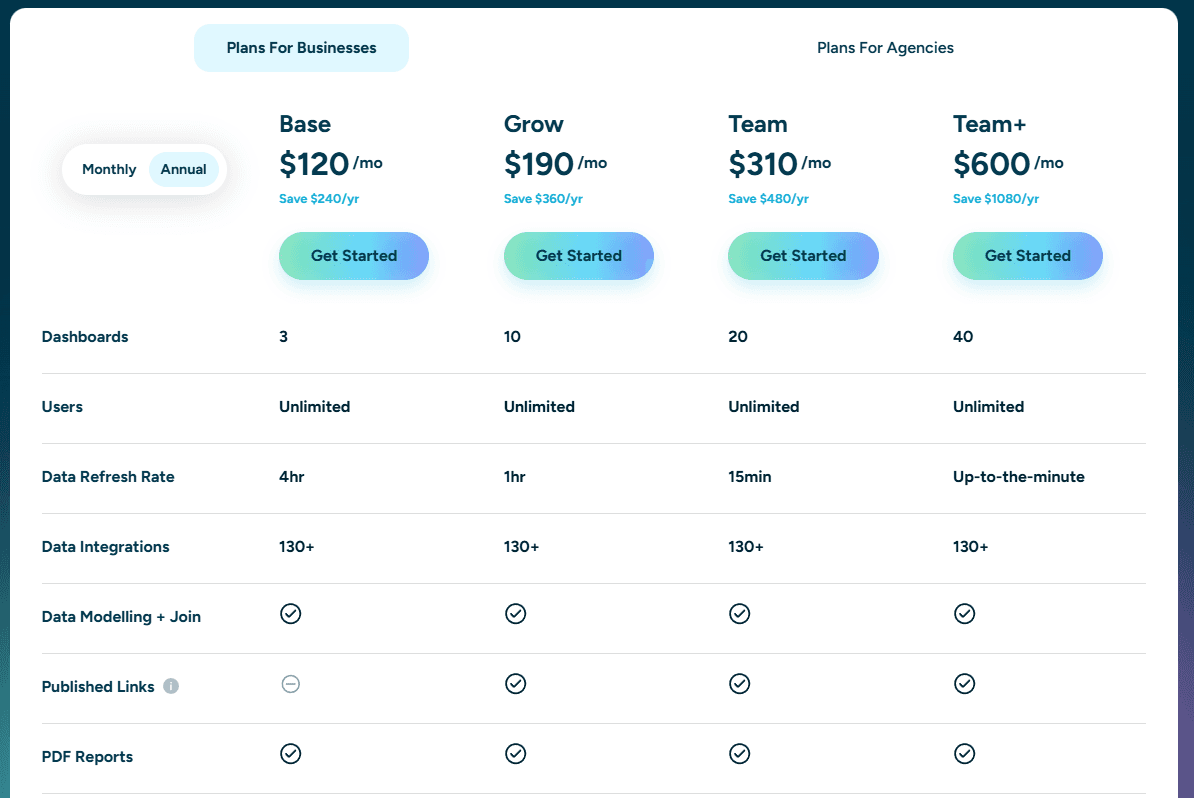
Base – $140/month: Suitable for small teams starting with embedded dashboards.
Grow – $220/month: Designed for teams that need more dashboards and faster data refresh.
Team – $350/month: Ideal for larger teams with higher dashboard volume and more frequent updates.
Team+ – $690/month: Built for advanced use cases requiring near real-time data refresh.
Klipfolio also offers annual plans with savings of roughly 14% compared to monthly pricing.
Overall, Klipfolio is a solid option for small to mid-sized teams looking for predictable pricing, fast setup, and flexible embedded analytics without enterprise-level complexity.
Qlik Sense Embedded Analytics
Qlik Sense is an embedded analytics tool that allows everyone to explore simple, self-service data. Instead of relying on technical experts, you and your team can dig into data, visualize trends, and uncover insights.
With built-in AI capabilities, Qlik Sense quickly highlights patterns that might otherwise go unnoticed, helping you make smarter decisions faster.
Key Features
AI-Powered Insights: Qlik Sense uses AI to point out trends, patterns, and important details so you don’t miss valuable information.
Self-Service Visualization: Anyone on your team can create engaging dashboards and reports without needing to code or undergo special training.
Associative Data Model: This unique approach lets you explore your data from all angles, revealing hidden connections that more traditional tools might overlook.
Interactive Dashboards: With simple drag-and-drop features, customizing visuals is easy, making it perfect for teams who need fast, flexible insights without complex setups.
Pros and Cons
✅ Pros:
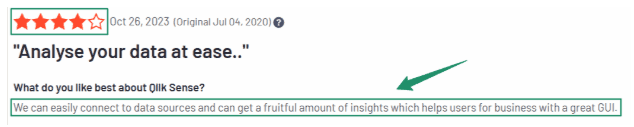
User-friendly tools that empower everyone to explore data.
Powerful AI features that deliver quick, meaningful insights.
Flexible dashboards that you can easily adjust to fit your needs.
❌ Cons:
Costs can add up for smaller businesses, especially with premium add-ons.
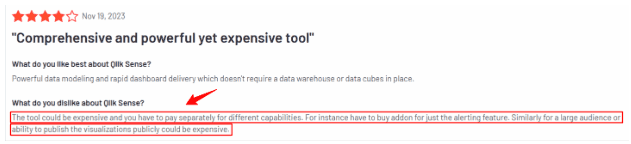
Limited offline access may be inconvenient for some users.
You’ll need a bit of training to get the most out of its features.
Qlik Sense Pricing
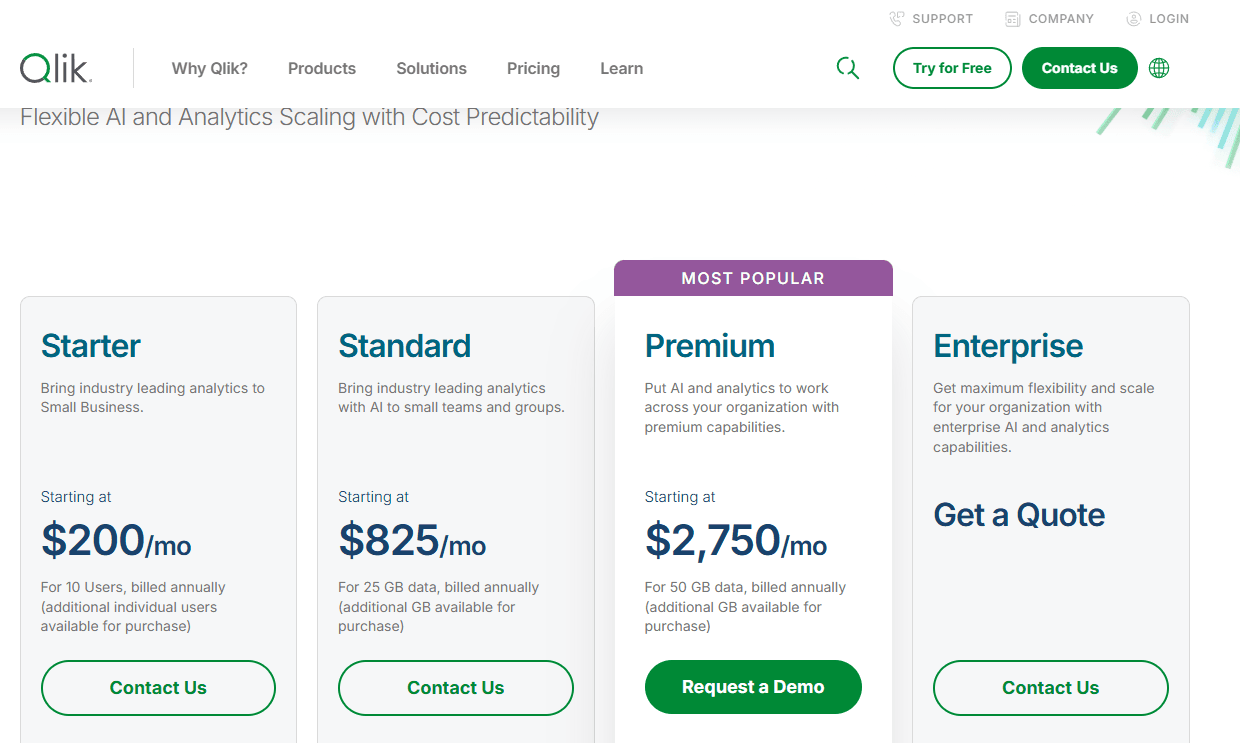
Starter Plan (from $200/month): Designed for small teams getting started with analytics. Includes 10 users and a fixed data allowance, billed annually, with limited scalability.
Standard Plan (from $825/month): This plan is ideal if you need strong analytics and easy self-service options.
Premium Plan (from $2,500/month): Perfect for teams wanting extra features and add-ons.
Enterprise Plan (custom pricing): Suited for larger businesses that require more scalability and integration options.
Note: All plans are billed annually.
Qlik Sense is a solid choice if you want to empower your team to understand data and make decisions best suited for growth.
Google Data Studio
Google Data Studio (or Looker Studio) is a free embedded analytics tool that makes creating dashboards and visualizing data simple and accessible.
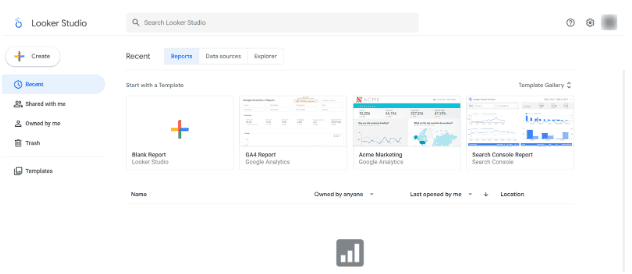
Built by Google, this tool is perfect for small businesses or teams looking for an affordable yet powerful way to make data-driven decisions without investing heavily in analytics software.
Key Features
Free to Use: Google Data Studio is entirely free, making it ideal for businesses on a budget.
Customizable Dashboards: Design your dashboards with drag-and-drop tools and connect multiple data sources for a clear and comprehensive view.
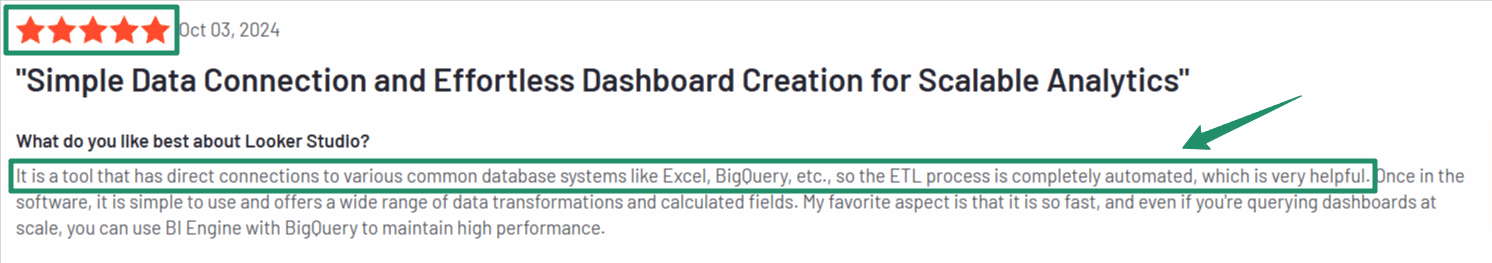
Seamless Integrations: Connect directly to Google products like Google Analytics, Google Ads, and BigQuery, as well as other third-party tools through connectors.
Interactive Reports: Users can interact with reports in real-time, delving into details and exploring metrics for deeper insights.
Pros and Cons
✅ Pros:
It is free to use with no hidden costs.
Easily integrates with Google services and other platforms.
It has a simple and intuitive interface that is great for beginners.
Allows you to share interactive reports with ease.
❌ Cons:
Limited advanced features compared to paid tools.
Some integrations may require third-party connectors, which could incur costs.
It is not ideal for handling extensive datasets or complex analytics needs.
Google Data Studio Pricing
Google Data Studio is 100% free. However, depending on the connector provider, you might incur additional costs if you need to use third-party connectors to access certain data sources.
Why Choose Google Data Studio?
Google Data Studio is a fantastic choice if you’re looking for a cost-effective way to start using embedded analytics tools. It’s ideal for small teams or businesses that want to create impactful dashboards and reports without spending a fortune.
Whether you need to track website performance, campaign metrics, or team KPIs, Google Data Studio provides the flexibility and simplicity to get all your data work done.
TIBCO Spotfire
Spotfire by TIBCO is a powerful embedded analytics tool built for businesses that need deep insights from complex datasets.
With its advanced visualization capabilities and predictive analytics, Spotfire is ideal for organizations looking to stay ahead with data-driven strategies.
Key Features
Advanced Visualizations: Spotfire offers a wide range of visuals, from heatmaps to 3D charts, helping you uncover insights hidden in large datasets.
Predictive Analytics: Leverage built-in AI and machine learning to forecast trends and make proactive decisions based on your data.
Flexible Data Integration: For a holistic view, connect seamlessly with diverse data sources, including databases, cloud platforms, and real-time data streams.
Customizable Dashboards: Tailor dashboards to your unique business needs, allowing users to interact with and drill down into data.
Pros and Cons
✅ Pros:
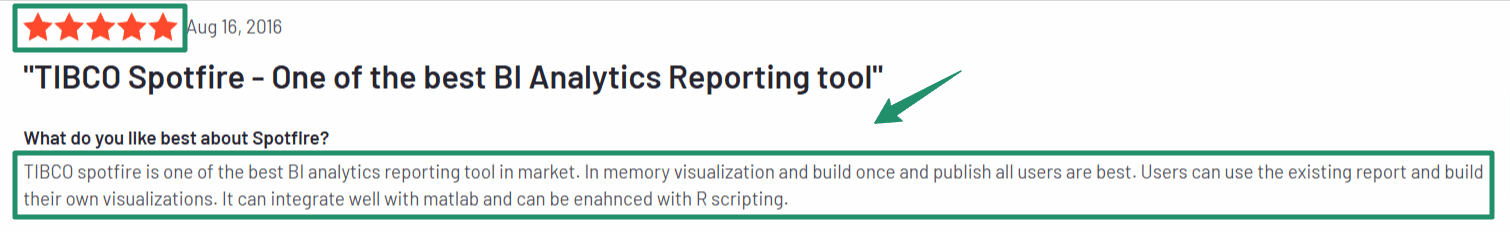
Alt tag: User review highlighting advanced analytics and visualization strengths in TIBCO Spotfire
Offers highly detailed visualizations that simplify complex data.
Predictive analytics provides valuable foresight for decision-making.
Handles large datasets efficiently, making it ideal for big enterprises.
Supports diverse data sources, ensuring a complete data analysis experience.
❌ Cons:
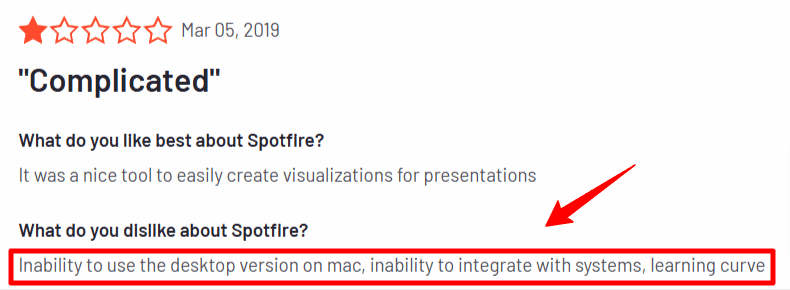
It can feel overwhelming for beginners due to its advanced features.
A higher price point might be challenging for smaller businesses.
Spotfire Pricing
Spotfire offers flexible pricing options for different business requirements. Businesses are encouraged to contact TIBCO directly to get an accurate quote.
Why Choose Spotfire?
Spotfire is a top choice for businesses with complex data requiring advanced analytics. Its combination of predictive insights, detailed visualizations, and flexible integrations makes it a powerful tool for enterprises aiming to make data-driven decisions.
Also Read: Sisense vs Tableau: Which One To Choose?
How to Choose the Best Embedded Analytics Tool for Your Business
We’ve explored today’s leading embedded analytics tools and the features that matter most for modern businesses.
Now, here are the key factors to help you choose the right embedded analytics tool for your business:
Factor | Why It Matters | Questions to Ask |
Ease of Use | Simplifies workflows and saves time for your team | Is it user-friendly and intuitive? Can non-technical users work with it easily? |
Pricing | Ensures the tool fits within your budget | Are there hidden costs? Does the pricing scale as my usage grows? |
Scalability | Prepares your business for future growth | Can it handle larger datasets or more users as my business expands? |
Integration | Saves time by connecting to your existing tools | Does it integrate with my CRM, databases, or data warehouse? |
Customer Support | Helps you resolve issues quickly and stay productive | Is support available 24/7? Are documentation and resources reliable? |
Below is how each factor plays out in real-world evaluation:
Ease of Use
Choose a tool your team can actually use day to day. If dashboards require constant training or technical help, adoption will suffer.
An intuitive tool saves time and makes analytics accessible.
Pricing
Look beyond entry-level pricing. Pay attention to usage-based fees, add-ons, and how costs scale as users or data volume grow.
Scalability
Your analytics tool should grow with your business. Make sure it can handle increasing data, users, and complexity without performance issues.
Integration Capabilities
Strong integrations with your existing stack (CRMs, data warehouses, cloud platforms) reduce setup time and prevent workflow friction.
Customer Support
Reliable support matters more than it seems. Responsive help, good documentation, and onboarding resources can save weeks of frustration.
When choosing the best embedded analytics tool, consider how it will grow with your business and make life easier for you and your team. A tool that’s easy to use, fits your budget, scales with your needs, integrates well, and has excellent support will always be a winner.
Conclusion: Which Embedded Analytics Tool Is Right for You?
So, after exploring all these amazing embedded analytics tools, you still might be thinking, "Which one is the best for me and my business"?
Here’s Our Final Recommendations:
Here’s a quick guide to help you match the tools with your goals:
Tool | Best For |
Upsolve.ai | Businesses looking for an easy-to-use, cost-effective, and scalable solution for real-time insights. Ideal for startups and growing companies. |
Power BI Embedded | Teams already using Microsoft products that need powerful visuals and seamless integration. |
Tableau Embedded Analytics | Organizations needing advanced customizations and rich visualizations for deep data analysis. |
Looker | Collaborative teams focused on exploring data in depth and sharing insights across departments. |
Sisense | Enterprises managing large datasets and requiring scalable analytics for complex needs. |
Klipfolio | Small to medium businesses seeking affordable and straightforward analytics tools. |
Qlik Sense Embedded Analytics | Teams looking for AI-powered analytics to uncover insights quickly and build flexible dashboards. |
Google Data Studio (Looker Studio) | Beginners or small teams looking for a free, easy-to-use analytics tool with strong Google integrations. |
TIBCO Spotfire | Enterprises handling complex datasets and requiring advanced analytics with predictive capabilities. |
How to Decide?
For startups or small teams: Tools like Klipfolio or Google Data Studio are excellent budget-friendly choices.
For mid-sized businesses, Upsolve.ai, Looker, or Qlik Sense strike a balance between cost and features.
For large enterprises: Sisense, Tableau, or Spotfire provide scalability and advanced analytics for more complex requirements.
For businesses using specific ecosystems: Choose Power BI Embedded for Microsoft integration or Google Data Studio for Google product compatibility.
Also Read: Embedded Analytics vs Business Intelligence: 5 Key Differences
By understanding what each tool offers, you can confidently choose the one that fits your goals. Whether you’re a startup, a growing business, or a large enterprise, an embedded analytics tool can solve all your data-related problems.

Try Upsolve for Embedded Dashboards & AI Insights
Embed dashboards and AI insights directly into your product, with no heavy engineering required.
Fast setup
Built for SaaS products
30‑day free trial


