
In-depth Tableau review based on real user feedback, covering pros, cons, pricing concerns, performance issues, and overall user experience.

Ka Ling Wu
Co-Founder & CEO, Upsolve AI
10 min

If you’re researching Tableau, you’re likely trying to answer a few practical questions:
Is Tableau still a good fit for teams today?
What does it actually feel like to use beyond demos and sales pages?
Where does it work well, and where does it fall short in real-world use?
This review looks at Tableau through real user feedback, not marketing claims. It is based on reviews from platforms like G2 and Capterra, along with insights from analysts, project managers, startups, and enterprise teams who use Tableau in different ways.
You’ll see what users like, where they struggle, how pricing plays out in practice, and which types of teams Tableau fits best, so you can decide whether it aligns with your needs or feels too complex or costly for everyday use.
TL;DR — Tableau Review Summary |
|---|
|
What Is Tableau?
Tableau is a popular business intelligence (BI) and data visualization dashboard tool used by companies around the world.
It helps you turn raw data into clear, interactive charts and dashboards, so you can make smarter decisions faster.

In simple words, Tableau lets you understand your data without needing to write code.
Whether you’re a data analyst in London, a marketing manager in New York, or a startup founder in Bangalore, Tableau gives you a visual way to explore what’s working and what’s not.
The tool is mostly known for:
Drag-and-drop dashboards
Beautiful visual charts
Data connectors (Excel, SQL, Google Sheets, cloud apps, etc.)
Sharing dashboards across teams or with clients
Tableau is used by small teams and large enterprises alike. It’s especially popular in industries like finance, retail, healthcare, and tech, where data is critical to daily decisions.
Also, here are a few different Tableau products:
Tableau Desktop: Used to create dashboards on your computer
Tableau Cloud (formerly Tableau Online): Share dashboards online with others
Tableau Server: Host dashboards on your own company server
Tableau Public: A free version where your dashboards are visible to the public
Whether you're tracking sales, customer behavior, or performance metrics, Tableau gives you a way to visualize your numbers and find insights faster.
But today with so many BI tools available, is Tableau still the best choice?
That’s exactly what we’ll explore in this article, based on what the users have said.
What Tableau Promises vs. What Users Say
If you visit Tableau’s website or read their product pages, you'll see one clear message: Tableau helps people see and understand data.
It positions itself as a modern business intelligence platform built for speed, flexibility, and beautiful data storytelling, whether you're working solo or in a large enterprise team.
Here’s what Tableau officially offers:
✅ Advanced data visualization: Clean, interactive charts and graphs that help teams make better decisions.
✅ Drag-and-drop dashboards: You can create dashboards visually, without needing to write any code.
✅ Data storytelling tools: Designed to guide users through insights with filters, highlights, and visual cues.
✅ Connects to hundreds of data sources: From Excel and Google Sheets to SQL, Salesforce, Snowflake, and cloud warehouses.
✅ Collaboration and sharing: Dashboards can be shared via Tableau Cloud, Tableau Server, or embedded into apps.
✅ Enterprise-grade security and governance: Access controls, row-level security, and deployment flexibility.
✅ AI-powered insights: Features like Explain Data and Ask Data let you query and explore using natural language.
These promises make Tableau sound like a complete, all-in-one platform, and for many businesses, it is.
But when I went through dozens of real reviews on G2, Reddit, and Capterra, I saw some mixed reactions.
Some say Tableau still leads the pack when it comes to powerful dashboards. Others say it feels too heavy or expensive for everyday use, especially for smaller teams or startups.
Let’s now take a closer look at what users actually like about Tableau, based on real-world feedback.
What Users Like About Tableau
After reading through real Tableau reviews on G2, Reddit, and Capterra, I noticed a common thread: while not perfect, Tableau still delivers where it counts for many users.
Here’s what people consistently say they like most:
✅ Drag-and-Drop Dashboard Builder
Many users say Tableau makes it easy to build dashboards without writing code. Its interface feels visual, flexible, and intuitive, especially once you get the hang of it.
“I love Tableau’s drag-and-drop interface. It makes building dashboards feel smooth and fast, even for someone without a technical background.”
✅ Fast Data Connection and Exploration
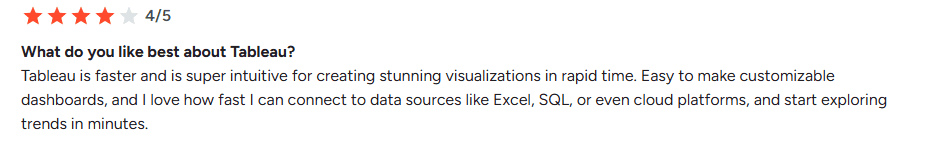
Tableau connects quickly to almost any data source, from spreadsheets and databases to cloud apps. That means you can go from raw data to analysis in minutes.
“I can connect to Excel, SQL, or cloud platforms and start exploring trends right away. It’s super intuitive and saves me a ton of time.”
✅ Beautiful Visuals and Storytelling
The platform is well-known for creating clean, interactive charts that make data easier to understand, not just for analysts, but also for clients and stakeholders.
“Tableau helps us turn complex data into stunning visual stories. It’s great for team presentations and sharing performance insights.”

✅ Handles Large Datasets with Ease
Several users mentioned they use Tableau to work with large data volumes, and it performs well, even with millions of rows.
“We manage massive marketing datasets, and Tableau handles them without slowing down. It scales well for our needs.”
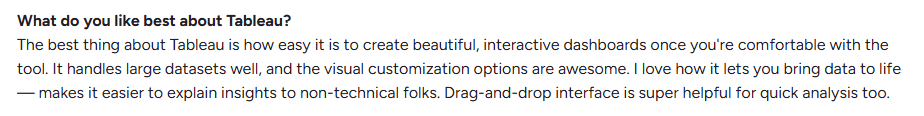
✅ Customizable and Powerful When Needed
Once you’re comfortable with the basics, you can dive deeper with calculated fields, filters, and level of detail expressions.
“I like that it’s simple at first, but powerful if you want to go deeper. You can really customize dashboards to fit what you need.”
✅ Built-In Mobile Responsiveness
Dashboards adjust to fit different screens automatically, which is helpful if your team accesses reports on phones or tablets.
“I can build a dashboard once and know it’ll work on desktop and mobile. That’s a huge plus for our sales team in the field.”
✅ Strong Community and Learning Resources
Since Tableau has been around for years, it has one of the biggest BI communities online. You can find tutorials, guides, or quick fixes almost instantly.
“It’s easy to find answers online. The community is great, and there’s a tutorial for just about everything.”
✅ Helps Teams Work Independently
Instead of relying on analysts for every report, Tableau helps business teams answer their own questions through self-service dashboards.
“Stakeholders can explore the data themselves. That saves our analytics team hours each week and speeds up decisions.”
What Users Don’t Like About Tableau
Even though Tableau is powerful, not everything about it works smoothly for everyone. While reading through user reviews from real teams and professionals, I noticed some common complaints that kept coming up.
Here’s what users say Tableau still struggles with:
❌ Steep Learning Curve
If you’re new to BI tools, Tableau can feel like a lot. Many users say it takes time, and sometimes even formal training, to fully understand how to use features like calculated fields, LOD expressions, and advanced filters.
“It’s not easy when you’re just starting. I had to watch a lot of tutorials just to build my first dashboard.”
❌ Price Can Be a Barrier
One of the most common complaints is pricing. For small teams or startups, Tableau can feel expensive, especially once you add multiple users, server hosting, or need advanced features.
“Great tool, but once you scale, the cost adds up quickly. That’s hard to justify for smaller teams.”

❌ Slower Performance with Heavy Customization
While Tableau handles most data well, users report lag or slowdowns when dashboards get too complex. Too many filters, visual layers, or blended sources can affect performance.
“It works fast at first, but once you add a few filters and custom visuals, things start slowing down.”

❌ Not Beginner-Friendly for Simple Use Cases
If you just want to track a few key metrics or build a simple dashboard, Tableau might feel like overkill. Some users say the tool is more suited for experienced analysts or larger teams.
“Coming from Excel, Tableau felt like a big jump. It’s powerful, but too much for smaller needs.”

❌ Extra Dependence on Third-Party Tools
Some users mention needing other tools for ETL, versioning, or deeper collaboration, which adds to the setup and ongoing costs.
“You still need other tools to clean your data or store large volumes in the cloud. It’s not fully end-to-end unless you add extras.”
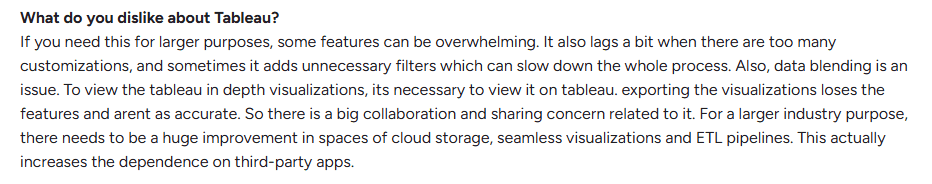
Tableau Pros and Cons quick summary table:
✅ What Users Like | ❌ What They Struggle With |
Drag-and-drop builder (no coding needed) | Steep learning curve for new users |
Fast connection to Excel, SQL, and cloud data | Expensive for small teams and startups |
Beautiful, interactive visuals | Slows down with heavy filters or complex dashboards |
Scales well with large datasets | Too complex for simple dashboard needs |
Mobile-friendly dashboards | Requires third-party tools for ETL or versioning |
Active community and tutorials | Collaboration and version control still clunky |
Enables self-service for non-technical users | Not beginner-friendly out of the box |
Tableau Reviews by Role and Use Case
Not every team uses Tableau the same way.
After reviewing user feedback across different roles, it’s clear that the experience depends a lot on what you’re trying to do, and how technical your team is.
Here’s how different users feel about Tableau:
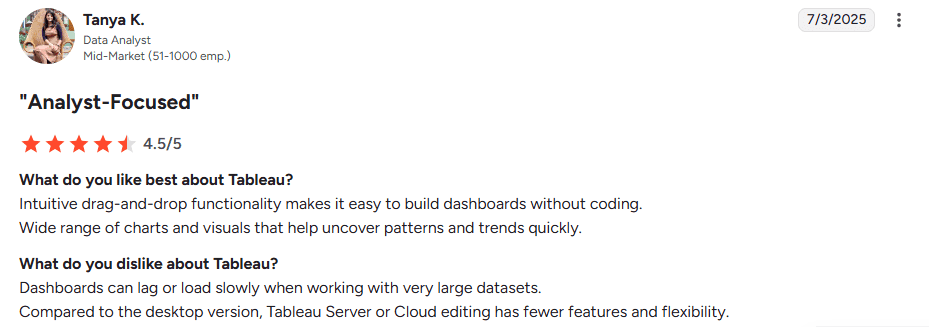
👩💻 Data Analysts & BI Teams: Visual Power, But Slower with Large Data
“Intuitive drag-and-drop functionality makes it easy to build dashboards without coding. Wide range of charts and visuals that help uncover patterns and trends quickly.
Dashboards can lag or load slowly when working with very large datasets. Compared to the desktop version, Tableau Server or Cloud editing has fewer features and flexibility.”
— Tanya K., Data Analyst, Mid-Market (51–1000 emp.), 7/3/2025, G2.com
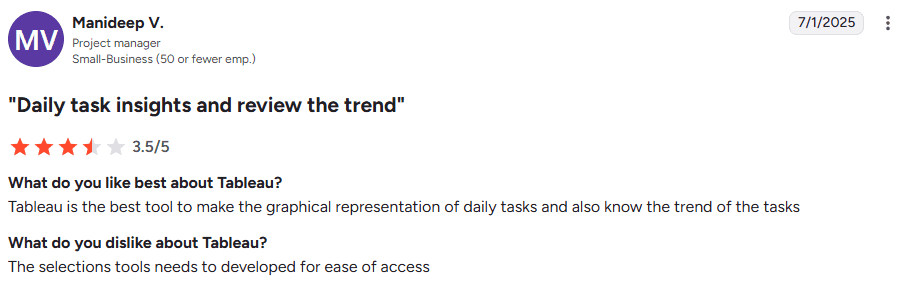
🗂️ Project Managers: Great for Task Trends, but UI Needs Work
“Tableau is the best tool to make the graphical representation of daily tasks and also know the trend of the tasks. The selection tools need to be developed for ease of access.”
— Manideep V., Project Manager, Small Business (50 or fewer emp.), 7/1/2025, G2.com
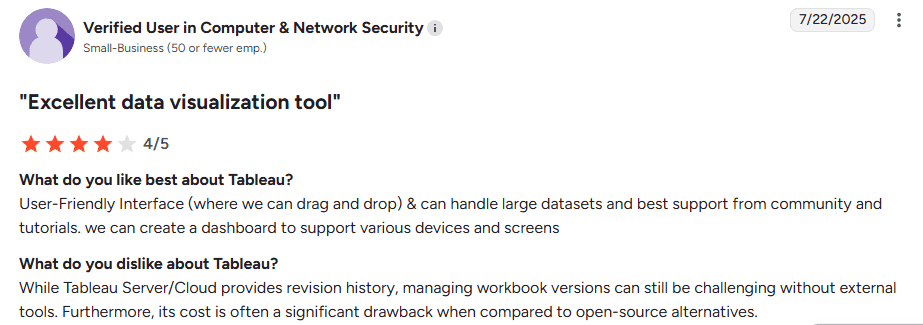
🚀 Startups & SMBs: Easy to Use, But Expensive and Hard to Manage Versions
“User-Friendly Interface (where we can drag and drop) & can handle large datasets and best support from community and tutorials…Furthermore, its cost is often a significant drawback when compared to open-source alternatives.”
— Verified User in Computer & Network Security, Small Business (50 or fewer emp.), 7/22/2025, G2.com
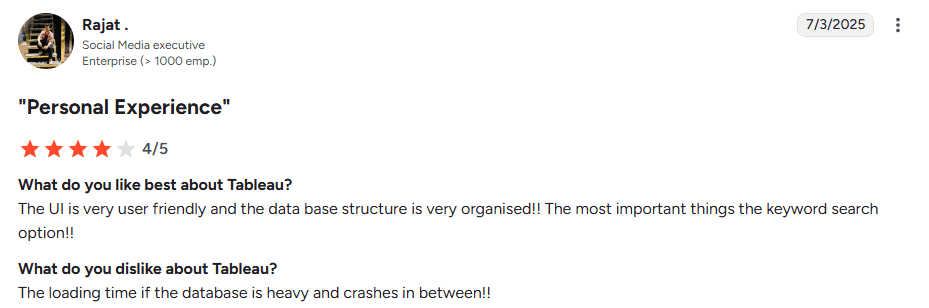
🏢 Enterprise Teams: Organized and Scalable, But Slows Down Under Load
“The UI is very user friendly and the database structure is very organised!! The most important thing is the keyword search option!! The loading time if the database is heavy and crashes in between!!”
— Rajat, Social Media Executive, Enterprise (>1000 emp.), 7/3/2025, G2.com
In short, Tableau fits best when your team has the time, budget, and people to support it.
But if you're moving fast or need something lightweight, there might be better options.
⭐ Tableau User Ratings on Review Platforms
Platform | Rating | Key Highlights |
G2 | 4.4 / 5 | Great visuals and data handling, but users mention a steep learning curve and slowdowns with large data. |
Capterra | 4.6 / 5 | Highly rated for features and usability, though pricing and performance are common concerns. |
💰 Tableau Pricing (Clear Breakdown)
Tableau’s pricing depends on your setup, whether you use Desktop, Cloud, Server, or Enterprise features.
Here’s the full breakdown:
🖥️ Tableau Desktop (via Creator License)
Tableau Desktop is only available through the Creator license, which includes Tableau Prep.
License Type | Price (per user/month) | Best For |
Creator | $75 | Full dashboard creation with Tableau Desktop and Prep |
✅ Ideal for analysts, BI developers, and data builders.
☁️ Tableau Cloud (Fully Hosted)
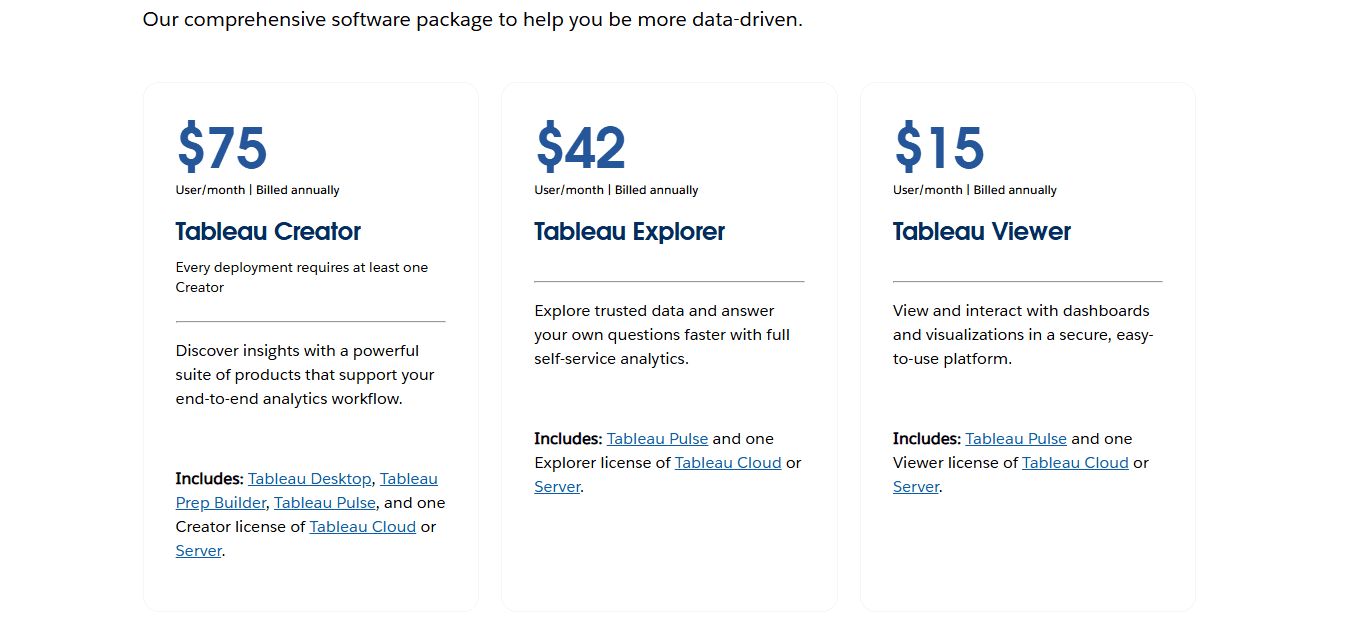
Tableau manages the hosting, updates, and infrastructure.
License Type | Price (per user/month) | Access Level |
Creator | $75 | Full dashboard creation |
Explorer | $42 | Can explore and modify content |
Viewer | $15 | View-only access |
✅ Great for teams that want fast setup without server maintenance.
🏢 Tableau Server (Self-Hosted)
You manage and host Tableau internally, with more control, but more IT responsibility.
License Type | Price (per user/month) | Access Level |
Creator | $75 | Full access |
Explorer | $42 | Edit and interact |
Viewer | $15 | View-only |
⚠️ Additional costs include server setup, maintenance, and IT resources.
💼 Tableau Enterprise Pricing (Updated)
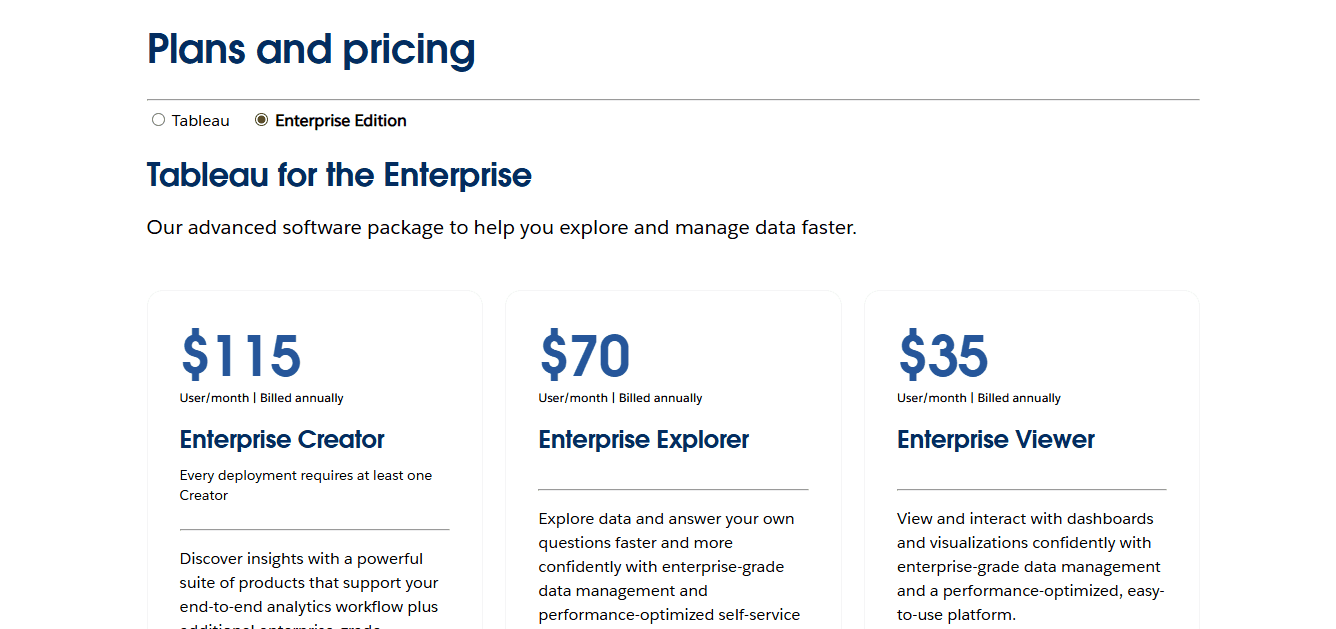
For large deployments or embedded analytics, enterprise pricing applies.
This includes extra governance, support, and advanced features.
Enterprise Tier | Price (per user/month) | Notes |
Creator | $115 | Includes Tableau Desktop, Prep, and advanced governance |
Explorer | $70 | Custom terms support editing |
Viewer | $35 | Often bundled for scaled access |
Embedded Analytics | Varies | Core-based or usage-based licensing |
Support & Training | Add-on | Priority support and onboarding |
⚠️ Embedded analytics plans may start around $70K/year, depending on volume and usage.
If Tableau feels overwhelming or costly…
After those reviews, I realized something that kept showing up: Tableau works, but it’s not always easy or affordable for every team.
Here’s what real users said:
“It’s powerful, but we needed help to get it running.”
“Great visuals, but too expensive for a small team.”
“Takes time to learn, not ideal when you’re moving fast.”
And honestly, I’ve seen the same pattern:
Teams want simpler tools.
Why More Teams Are Looking Beyond Tableau
Especially if you’re a product-led company or a SaaS team, you probably don’t want:
A long setup process
Per-seat licensing costs that scale with headcount
A full-time BI team just to build and maintain reports
That’s why more teams are exploring no-code analytics tools that work out of the box and are easier to maintain.
One example of this newer approach is Upsolve AI.
It’s built for product teams that need to show data inside their products or customer-facing apps, not just for internal reporting.
Why Teams Consider Upsolve AI as an Alternative to Tableau
After comparing different BI tools, some teams find that traditional platforms like Tableau don’t always fit modern product-led workflows.
Upsolve AI is a no-code, embedded analytics platform designed to help teams turn raw data into real-time, user-facing dashboards, without the setup and maintenance overhead of traditional BI tools.
It’s often considered by teams that prioritize speed, simplicity, and embedded analytics.
Where Upsolve AI Fits Best
✅ Built for Product-Led Teams
Upsolve is designed for embedding dashboards directly into products or customer-facing apps, without unnecessary complexity.
✅ No-Code Setup
Teams can connect data and launch dashboards quickly, without relying on a dedicated BI or engineering team.
✅ Usage-Based Credit Pricing Model
Instead of per-seat licensing, pricing is structured to better align with product usage and scale.
✅ Designed for End Users
Dashboards are built to be fast, clean, and easy to explore, even for non-technical users.
Upsolve AI vs Tableau
Feature | Tableau | Upsolve AI |
Setup Time | ❌ Long and complex setup | ✅ No-code, live in minutes |
Ease of Use | ❌ Steep learning curve | ✅ Simple for non-technical teams |
Embedding | ❌ Requires enterprise setup | ✅ Built-in, made for user-facing dashboards |
Pricing Model | ❌ Per-user pricing, adds up fast | ✅ Usage-based credit pricing, no per-seat fees |
Performance | ❌ Slows down with large datasets | ✅ Optimized for real-time dashboards |
Best Fit | ❌ Internal BI teams | ✅ Product-led teams, SaaS, customer portals |
Final Verdict: What Teams Look for in a BI Tool
After reviewing real user feedback, one thing becomes clear: teams want BI tools that are simple, fast, and easy to maintain.
Here’s the pattern users consistently point out:
✅ What They Like About Tableau | ❌ What They Struggle With |
Powerful visualizations | Steep learning curve |
Flexible dashboard creation | High per-user costs |
Strong data connectivity | Slow setup and lag with large data |
Complex embedding and version control |
So, what’s the right choice?
🏢 For data-heavy enterprises with dedicated BI teams
Tableau remains a strong option when advanced customization, governance, and internal analytics are the priority.
⚡ For teams that need speed and embedded analytics
Some teams prefer platforms like Upsolve AI that focus on no-code setup, user-facing dashboards, and simpler pricing, without the overhead of traditional BI tools.
FAQs
Is Tableau still worth using?
Yes, Tableau can still be a good choice for large organizations with complex reporting needs, mature data infrastructure, and dedicated BI teams.
For smaller teams or product-led companies, however, many users find it heavy, expensive, and slower to adopt than newer alternatives.
What are the biggest complaints users have about Tableau?
Users say it has a steep learning curve, slow performance with big data, and expensive per-user pricing. Many also find embedding dashboards into apps difficult without extra help.
Is Tableau good for embedded analytics?
Tableau can support embedded analytics, but it’s not the easiest option.
Embedding typically requires enterprise licensing, additional setup, and technical configuration. For teams that want simpler, faster embedded dashboards, many users look at tools designed specifically for that use case.
How much does Tableau really cost?
The Creator license starts at $75 per user/month, but enterprise plans can go up to $115 per user/month.
If you add Explorers, Viewers, Server hosting, and support, the total cost adds up quickly.
Can non-technical users work with Tableau easily?
Not at first. Tableau is powerful but has a learning curve. Many users say it takes time and training to get comfortable, especially if you're not from a data background.
What’s the best alternative to Tableau?
Teams looking for simpler setup, no-code dashboards, or embedded analytics often explore alternatives to Tableau.
For example, Upsolve AI is one option designed for product-led teams that need user-facing dashboards without the overhead of traditional BI tools.

Try Upsolve for Embedded Dashboards & AI Insights
Embed dashboards and AI insights directly into your product, with no heavy engineering required.
Fast setup
Built for SaaS products
30‑day free trial


