
Explore the best Omni alternatives with AI capabilities, customization, and easy embedding, ideal for SaaS and customer-facing analytics.

Ka Ling Wu
Co-Founder & CEO, Upsolve AI
10 min

Omni is a fast analytics tool that helps teams explore data, create metrics, and build dashboards in one place.
It lets you use SQL, point-and-click, or spreadsheet formulas, and gives instant results with its smart caching.
Teams use Omni because it is quick to set up, easy to use, and keeps data consistent through a shared model.
But not every team has the same needs. Some want stronger AI features, more control over embedded dashboards, or pricing that fits a growing product.
That's why many firms look for alternatives that offer more automation, better customization, or a different way to build customer-facing analytics.
In this guide, we tested the 7 best Omni alternatives for AI-powered analytics to help you find the option that fits your product and data needs best.
TL;DR – 7 Best Omni Analytics Alternatives Overall
Looker (Google): Best for enterprise data modeling and strict governance.
Sigma Computing: Great for teams that prefer a spreadsheet-style interface.
Luzmo: Best for quick, no-code embedded dashboards.
Embeddable: Best for developers who want full control over embedded analytics.
Microsoft Power BI: Ideal for affordable analytics with strong AI features.
Qlik Sense: Ideal for exploring connected data across many sources.
Upsolve AI: Best for AI-powered, agent-driven embedded analytics.
What to Look for in Omni Analytics Alternatives or a Better Business Intelligence Product
To help you pick the right Omni alternative, here are the key areas that matter most when comparing different analytics tools:
The speed and efficiency of query execution, including how well the engine handles large datasets and returns results in real time.
The quality of AI capabilities, such as natural-language querying, automated insights, column-level summaries, and AI-assisted report creation. As the analytics space evolves toward agent-driven workflows, it is worth evaluating how platforms handle context and accuracy for AI features; analytics agent builder platforms are an emerging category to watch.
The ease of building dashboards and reports, including support for drag-and-drop editors, semantic layers, and low-code workflows.
The strength of embedding options, including secure customer-facing dashboards, API control, and support for web components or iframes.
The level of branding and UI customization available, such as full white-labeling, CSS overrides, theme control, and layout flexibility.
Permission and governance controls, including row-level security, column-level security, user roles, and consistent metric and lineage management.
Overall performance and scalability, ensuring the platform can support growing data volumes, concurrency, and multi-tenant workloads.
This criteria makes it easier to compare Omni alternatives and choose the option that fits your team best.
How We Evaluated the Best Omni Alternatives
To pick the right alternatives to Omni, we didn't just look at feature lists, we looked at how each tool works in real situations.
We tested how easy they are to use, how well they perform, and how they fit into everyday workflows.
Here's what we focused on while reviewing each tool:
Speed and reliability of querying and loading data, including how well the engine handles large datasets, concurrency, and real-time exploration.
Strength of built-in AI, such as natural-language querying, automated insights, LLM-powered summaries, and AI-assisted report creation.
How easy it is to build dashboards without full coding, including drag-and-drop builders, semantic layers, workflow automation, and low-code transformations.
Flexibility of embedding options for customer-facing reports, such as APIs, web components, SDKs, iframe performance, token-based security, and multi-tenant isolation.
Speed of setup and time required to go live, including integration steps, data connectors, theming, deployment workflows, and developer tools.
This process helped us understand what each tool is really like to use, and which ones stand out as strong, practical replacements for Omni.
7 Best Omni Alternatives for AI Powered Analytics: Quick Comparison
Tool | AI Features | Embedding | Customization | Multi-Tenant | Pricing |
Looker | Gemini conversational analytics | Strong APIs & custom apps | Limited theming | Requires setup | Quote-based |
Sigma | Ask Sigma + AI Query | Strong embedding + write-back | Good customization | Warehouse-level controls | Starts at $300/mo |
Luzmo | Luzmo IQ for chat & insights | Strong embedding (SDK/iFrame/Web components) | Full white-labeling + CSS | Built-in | Starts at $495/mo |
Embeddable | No-code + full-code workflow | Native Web Components (no iframes) | Unlimited control in code | Built-in | Fixed subscription (contact sales) |
Power BI | Copilot + AI insights | Power BI Embedded (Azure PaaS) | Some theming | Supported | Free / $14/user / $24/user / Fabric variable |
Qlik Sense | AutoML, NLP search, predictions | Full API embedding | Moderate | Enterprise-grade | Quote-based |
Upsolve AI | Strong AI for charts & summaries | Easy embedding (React/iFrame) | Full white-label & styling | Built-in | Free tier; from $2,000/mo (Team) for embedding |
1. Looker: A Governed BI Alternative to Omni
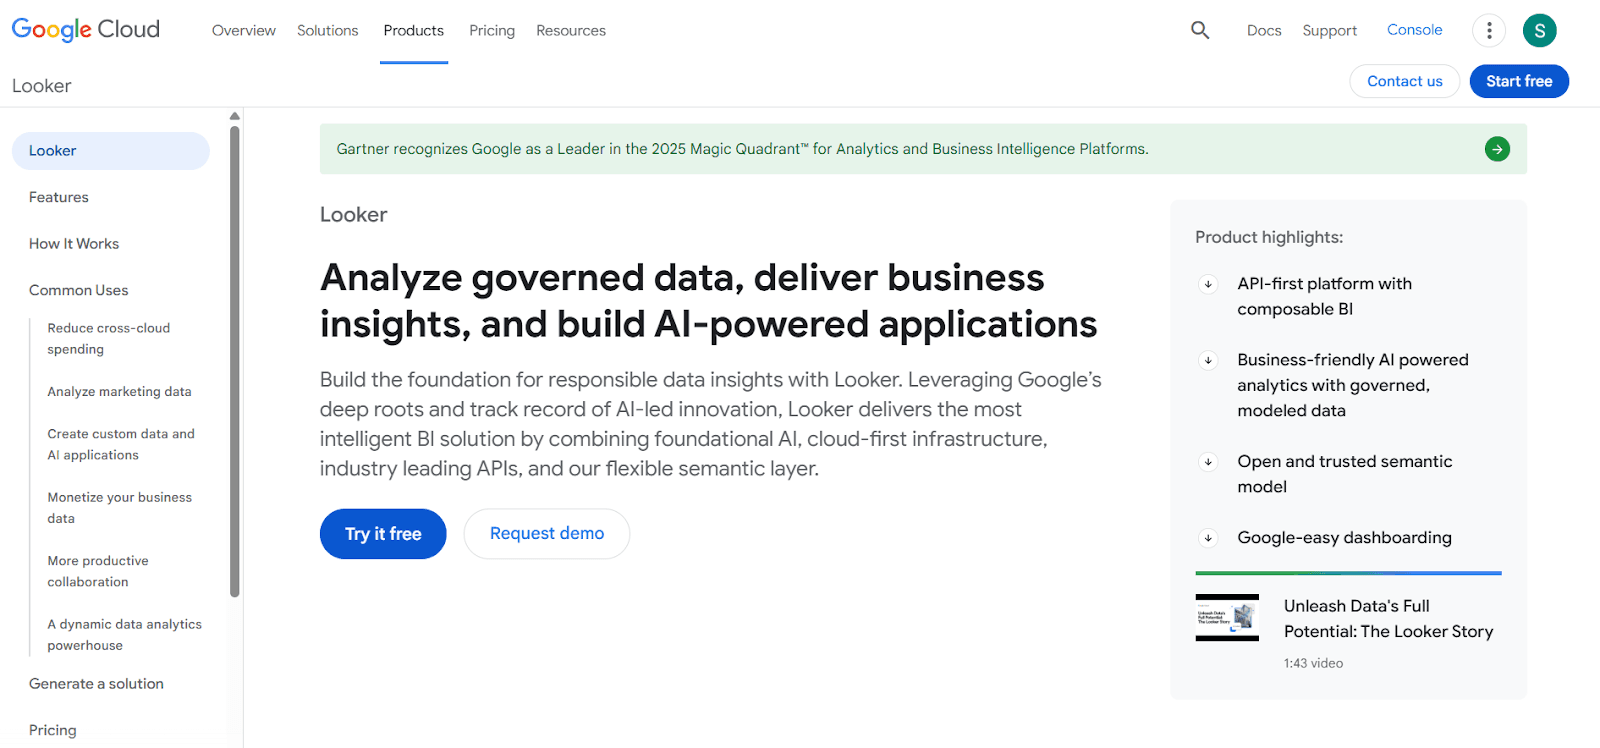
Looker, now part of Google Cloud, is a powerful platform built for enterprise-level business intelligence.
It helps teams explore, manage, and use trusted data across the company with strong governance, scalable architecture, and developer-friendly tools.
Key Features of Looker
Looker uses LookML, a modeling language that lets data teams define rules and metrics in one place, so everyone sees consistent data.
Its semantic layer creates a trusted, governed data source that feeds dashboards, reports, and AI features across the company.
Teams can embed dashboards or full apps, using robust APIs for deep customization and integration into products.
The platform offers Conversational Analytics powered by Google Gemini, so users can ask questions in plain language and get answers with visuals.
Looker connects natively with BigQuery and works across multi-cloud environments, making it flexible for large-scale businesses.
Looker vs Omni: Quick Comparison
Feature | Looker | Omni |
Core Use | Internal BI and governed reporting | Internal BI with workbook interface |
Embedding | Strong APIs and customizable apps | Supported, but less customizable |
AI Capabilities | Gemini-powered conversational analytics | Basic summaries and AI assistant |
Custom Styling | Limited theming and dashboard design | Limited theming |
User Access | Role-based access; mostly for analysts | Mostly analyst-driven |
Pricing | Quote-based, enterprise-focused | Enterprise-only pricing |
Looker Pricing
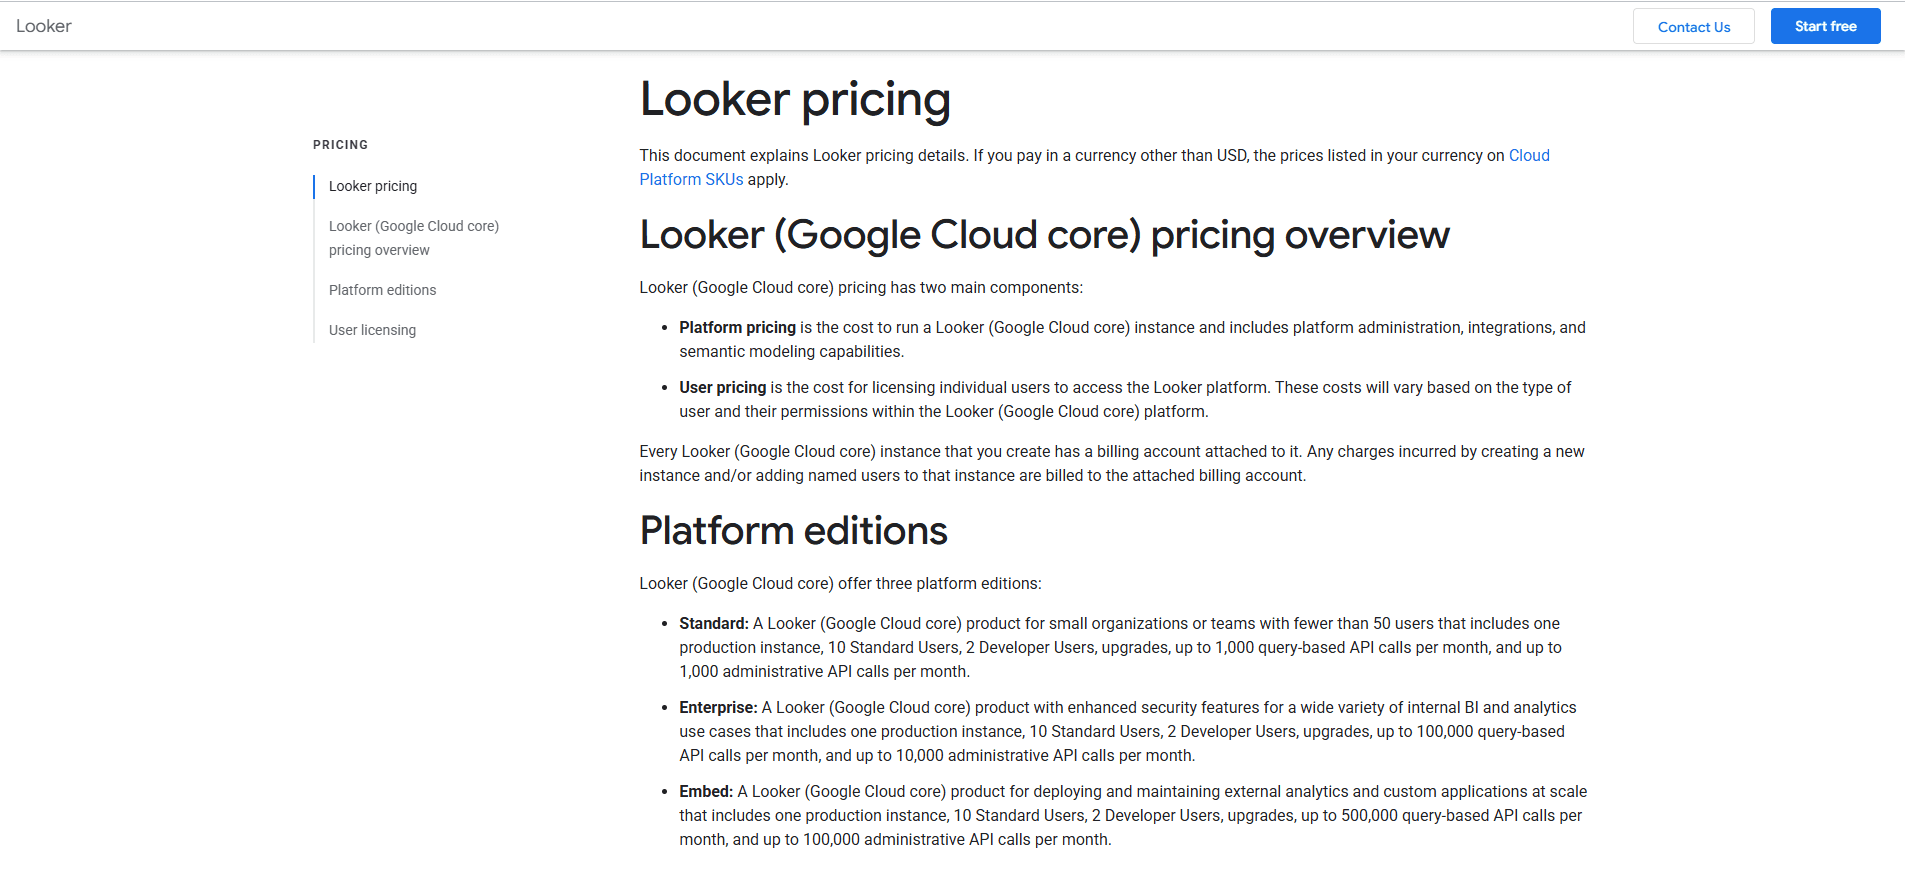
Pricing depends on the plan (Standard, Enterprise, or Embedded) and the number of users.
Each plan includes 10 standard users and 2 developer users by default.
You need to contact sales to get exact pricing based on your use case.
User licenses (Viewer, Standard, Developer) come with different levels of access and monthly quotas for AI features.
2. Sigma Computing: A Spreadsheet-Style, Warehouse-Native Alternative to Omni
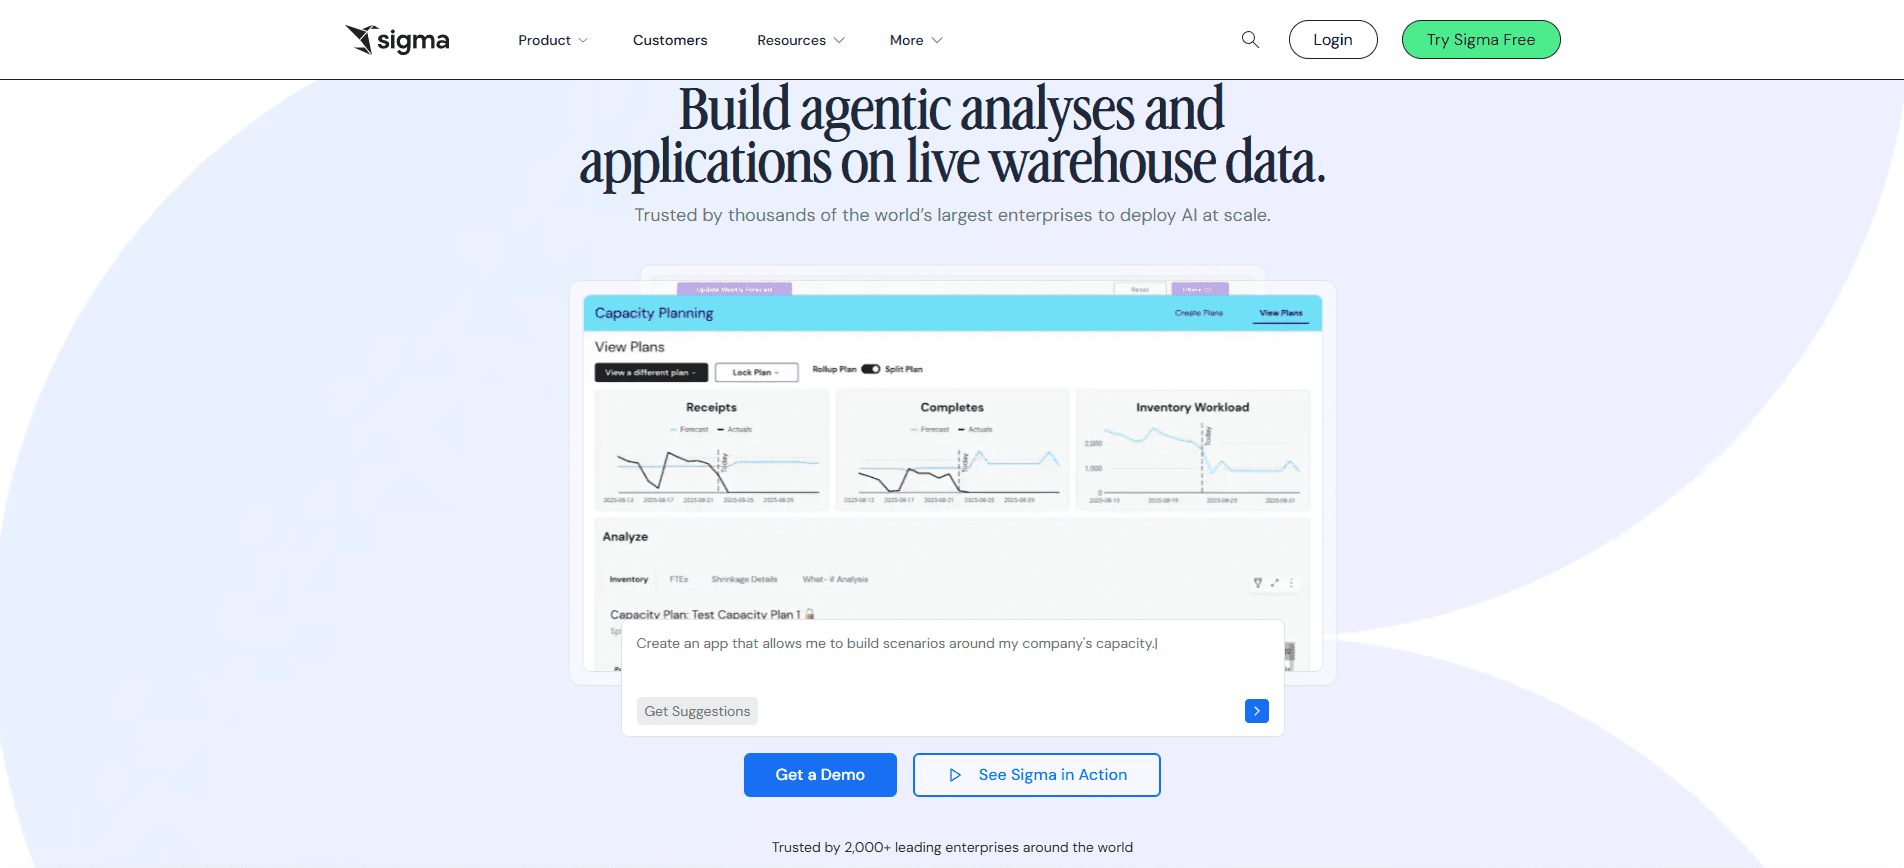
Sigma Computing is an analytics platform that lets teams explore and work with data directly in the cloud data warehouse using a familiar spreadsheet interface.
It's built for companies that want self-service analytics without extracts, delays, or complex setup.
Sigma gives users live access to warehouse data, strong governance, and AI features that help anyone analyze data without writing code.
Key Features of Sigma
Sigma lets users work in a live, warehouse-connected spreadsheet, so data is always fresh and never copied or exported.
Teams can explore data with drag-and-drop tools, custom dashboards, and interactive reports that run directly on Snowflake, BigQuery, Databricks, Redshift and more.
Its AI features, Ask Sigma and AI Query, allow users to ask questions in natural language, apply LLMs to their own warehouse data, and build AI-powered apps inside Sigma.
The platform includes strong governance inherited from the data warehouse, with row-level security, column-level security, permissions, audit logs, and full compliance certifications.
Sigma offers write-back and multi-step workflows, allowing teams to create real operational data apps on top of their warehouse.
Sigma Pricing
Starts at $300/month
Free trial available
64 features included
10 integrations listed
Sigma vs Omni: Quick Comparison
Feature | Sigma | Omni |
Core Use | Self-service BI with spreadsheets, dashboards, AI apps | Governed BI with semantic data model + workbooks |
Interface | Spreadsheet UI + SQL + Python + AI in one workbook | UI + SQL + Excel formulas + AI, switchable |
Data Access | Live queries on warehouse, no extracts | Live + cached hybrid with intelligent caching |
AI Features | Ask Sigma, AI Query, formula assistant, AI-powered apps | AI assistant with explanations and summaries |
Embedding | Strong embedded analytics with Ask Sigma and write-back | Good embedding, less app-focused |
Data Modeling | Warehouse-driven; optional Sigma datasets | Central semantic layer + Topics |
Pricing | Starts at $300/month | Enterprise-only pricing |
3. Qlik Sense: A Powerful, AI-Driven BI Alternative to Omni
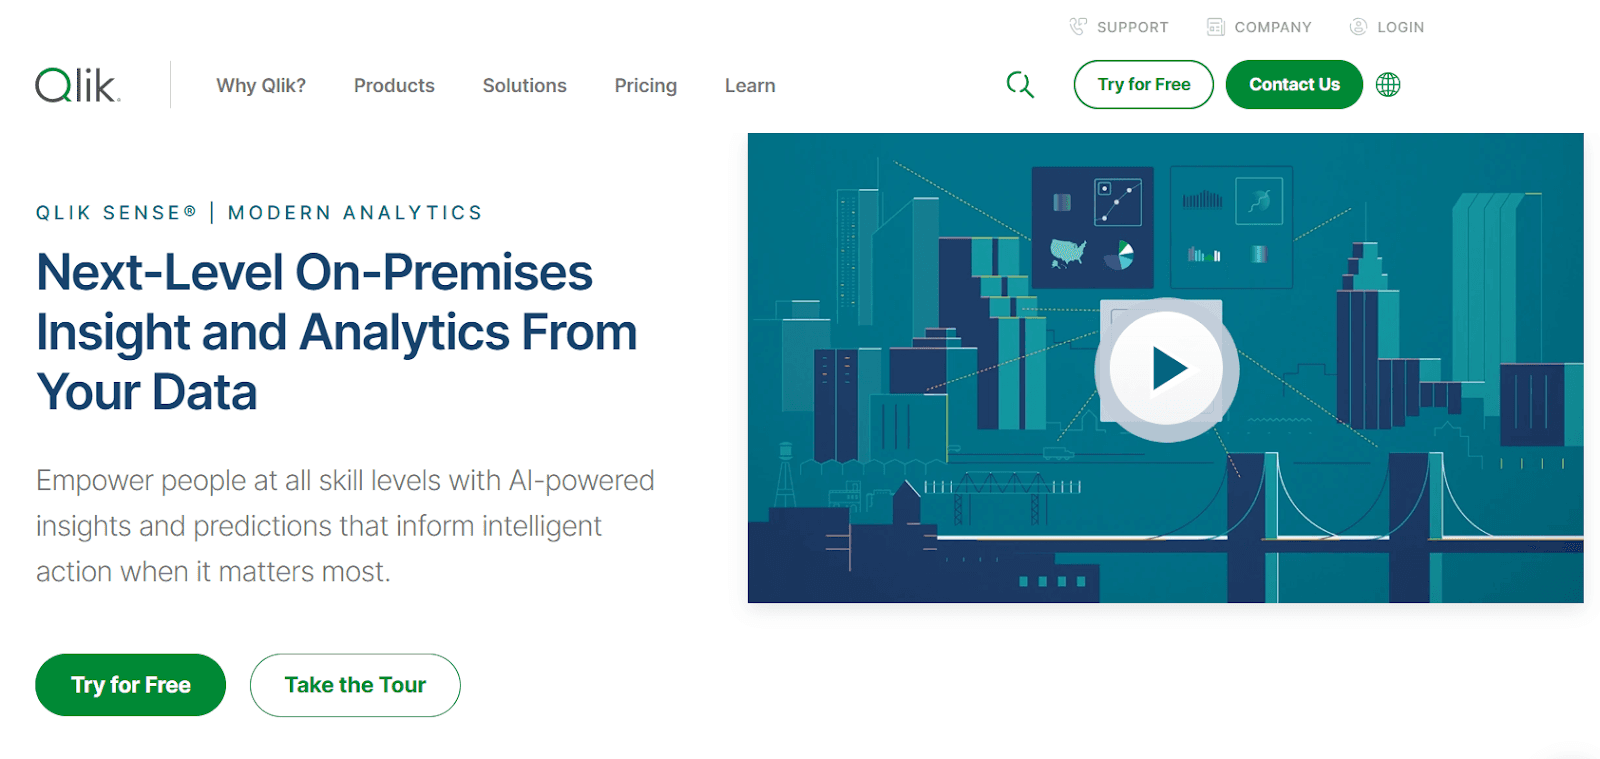
Qlik Sense is an enterprise analytics platform built for teams that need fast, interactive dashboards, strong governance, and AI-powered insights.
Its unique associative engine lets users explore data from any angle without being limited by predefined queries.
This helps users discover hidden patterns that traditional BI tools often miss.
Key Features of Qlik Sense
Qlik's associative engine lets users explore data freely in any direction, giving instant results and always staying in context.
Augmented analytics features like automated insights, natural-language search, AI-assisted creation, and predictive analytics make it easy for anyone to work with data.
Qlik Sense supports fully interactive dashboards where every chart and object updates instantly as users explore.
Qlik AutoML lets non-technical users build predictive models, run what-if scenarios, and explore advanced analytics.
It includes strong data prep, cataloging, automation workflows, and governance to support large enterprise workloads.
Qlik Sense vs Omni: Quick Comparison
Feature | Qlik Sense | Omni |
Core Use | Enterprise analytics with associative engine + AI | BI with workbooks + semantic model |
Interface | Highly interactive dashboards, natural-language search, AI suggestions | Workbook-style interface with SQL, Excel-like formulas, and AI |
AI Features | AutoML, automated insights, NLP search, predictions | AI assistant for queries and explanations |
Data Access | Real-time, associative exploration across many sources | Live + cached model with semantic layer |
Embedded Analytics | Full API support for custom apps and deep embedding | Supported but less customizable |
Governance | Strong enterprise governance, cataloging, security | Strong semantic modeling governance |
Pricing | Quote-based | Enterprise-only pricing |
Qlik Sense Pricing
Pricing is not publicly listed for Qlik Sense client-managed (on-premise).
Customers must contact sales for a custom quote.
Pricing depends on the deployment type, user roles, and enterprise needs.
Qlik Cloud Analytics (SaaS) has separate pricing on the cloud pricing page.
4. Luzmo: A Flexible, UI-First Embedded Analytics Alternative to Omni
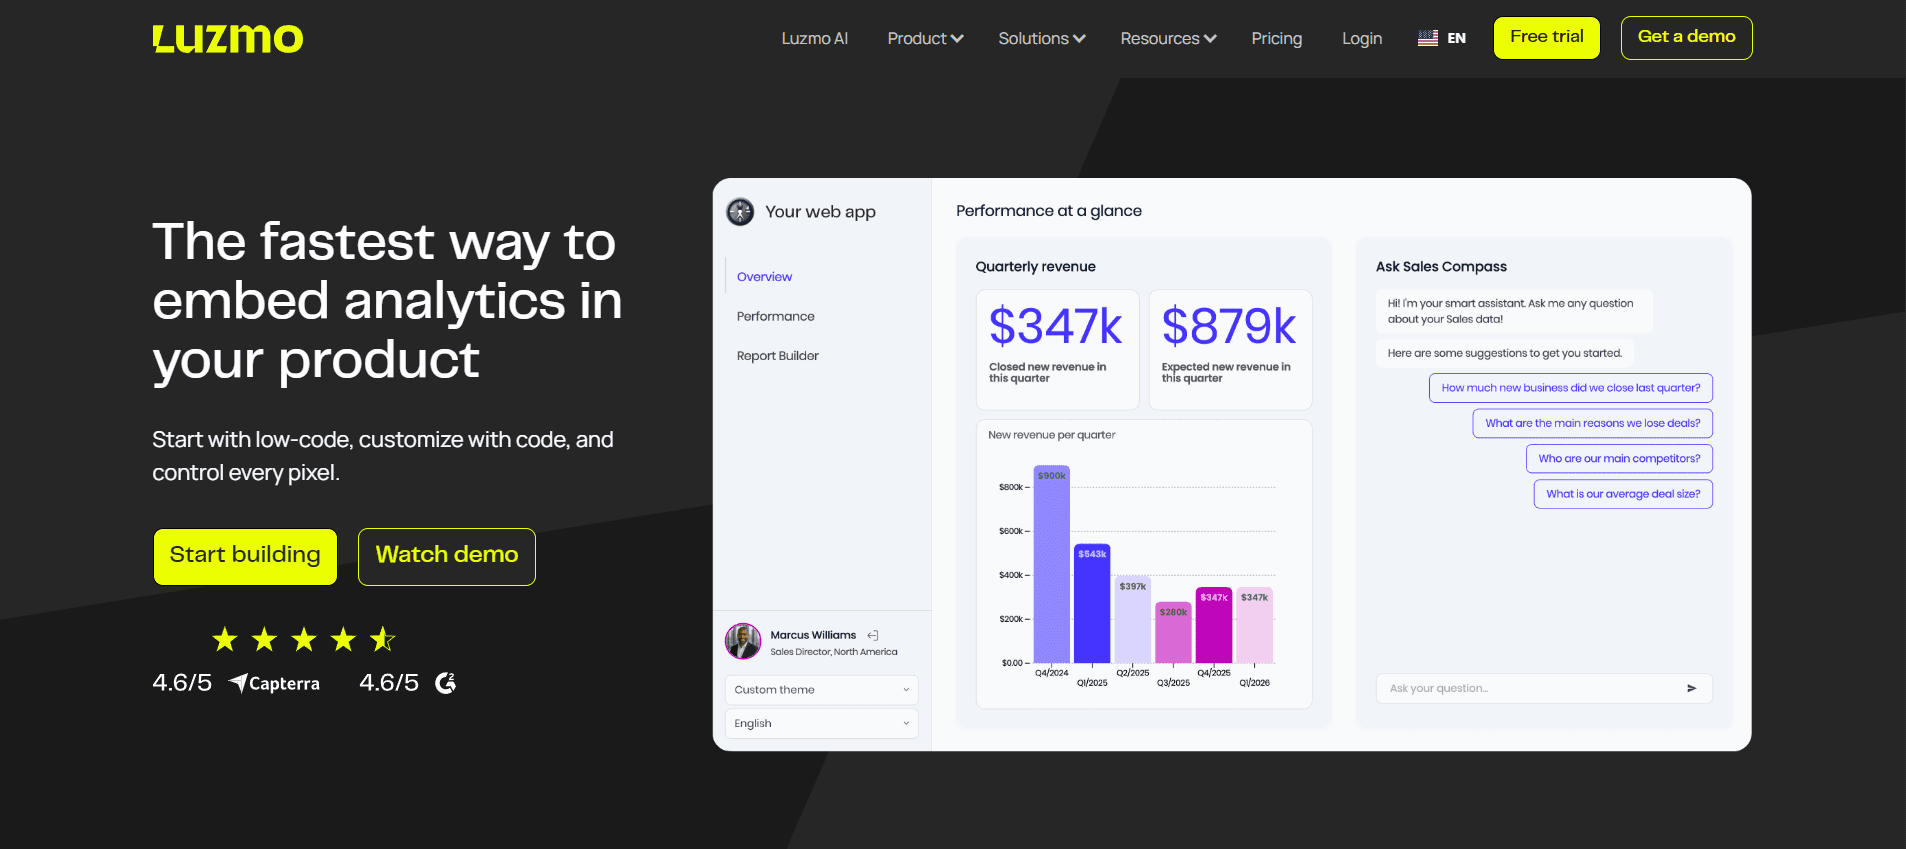
Luzmo is an embedded analytics platform built for SaaS companies that want to add beautiful, interactive dashboards inside their product.
It focuses on fast design, strong customization, and deep embedding options, all while keeping engineering work light.
Unlike Omni, which is centered around a workbook and semantic model for internal BI, Luzmo is built specifically for customer-facing analytics with strong UI tools, an SDK, and AI features.
Key Features of Luzmo
You can build dashboards quickly with Luzmo Studio, a drag-and-drop editor that needs very little engineering work.
Dashboards can be fully white-labeled with your own colors, CSS, themes, languages, currencies, and timezones.
Luzmo Flex SDK gives developers full control to create custom analytics by mixing Luzmo charts with your own UI components.
Luzmo IQ lets users ask questions in plain language and get instant answers, charts, summaries, and insights.
Users can edit and customize dashboards directly inside your product.
Supports multi-tenant analytics, role-based permissions, and row-level security for customer-facing use cases.
Luzmo vs Omni: Quick Comparison
Feature | Luzmo | Omni |
Core Use | Embedded analytics for SaaS products | Internal BI + embedded dashboards |
AI Features | Luzmo IQ for chat, summaries, embedded AI components | AI assistant with summaries, chart explanations |
Customization | Full white-labeling, CSS, SDK, multi-language/timezone/currency | Customizable but less design-focused |
Embedding | Strong, product-native embedding via SDK, iframe, web components | Supported with iframes + SSO but simpler |
Multi-Tenant | Built-in multi-tenant analytics | Supported but requires more configuration |
Pricing | Starts at $495/month | Enterprise-only, custom pricing |
Luzmo Pricing
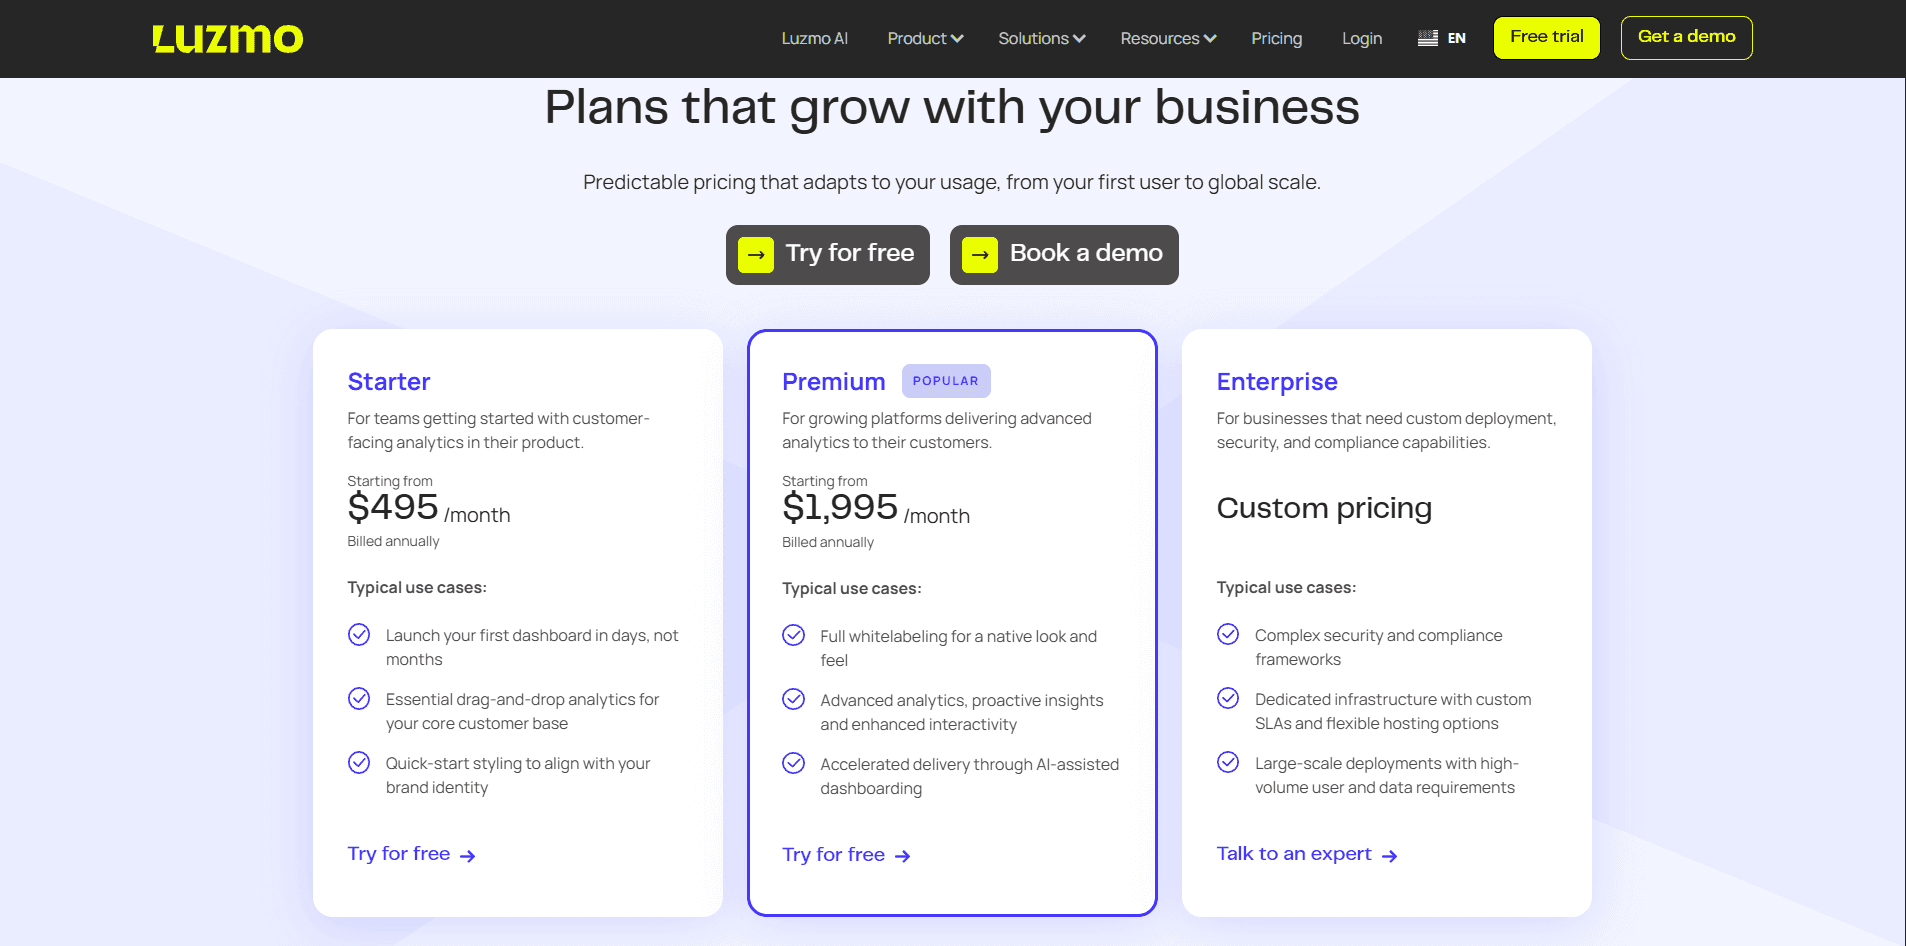
Starter: $495/month (billed annually), launch dashboards in days with drag-and-drop analytics, quick-start styling, and core embedding for your customer base.
Premium: $1,995/month (billed annually), full white-labeling, advanced analytics, proactive insights, enhanced interactivity, and AI-assisted dashboarding.
Enterprise: Custom pricing, for businesses that need custom deployment, dedicated infrastructure, complex security and compliance frameworks, and high-volume user support.
Pricing scales with Monthly Active Users (MAUs).
5. Embeddable: Ultra-Fast Embedded Analytics Alternative to Omni
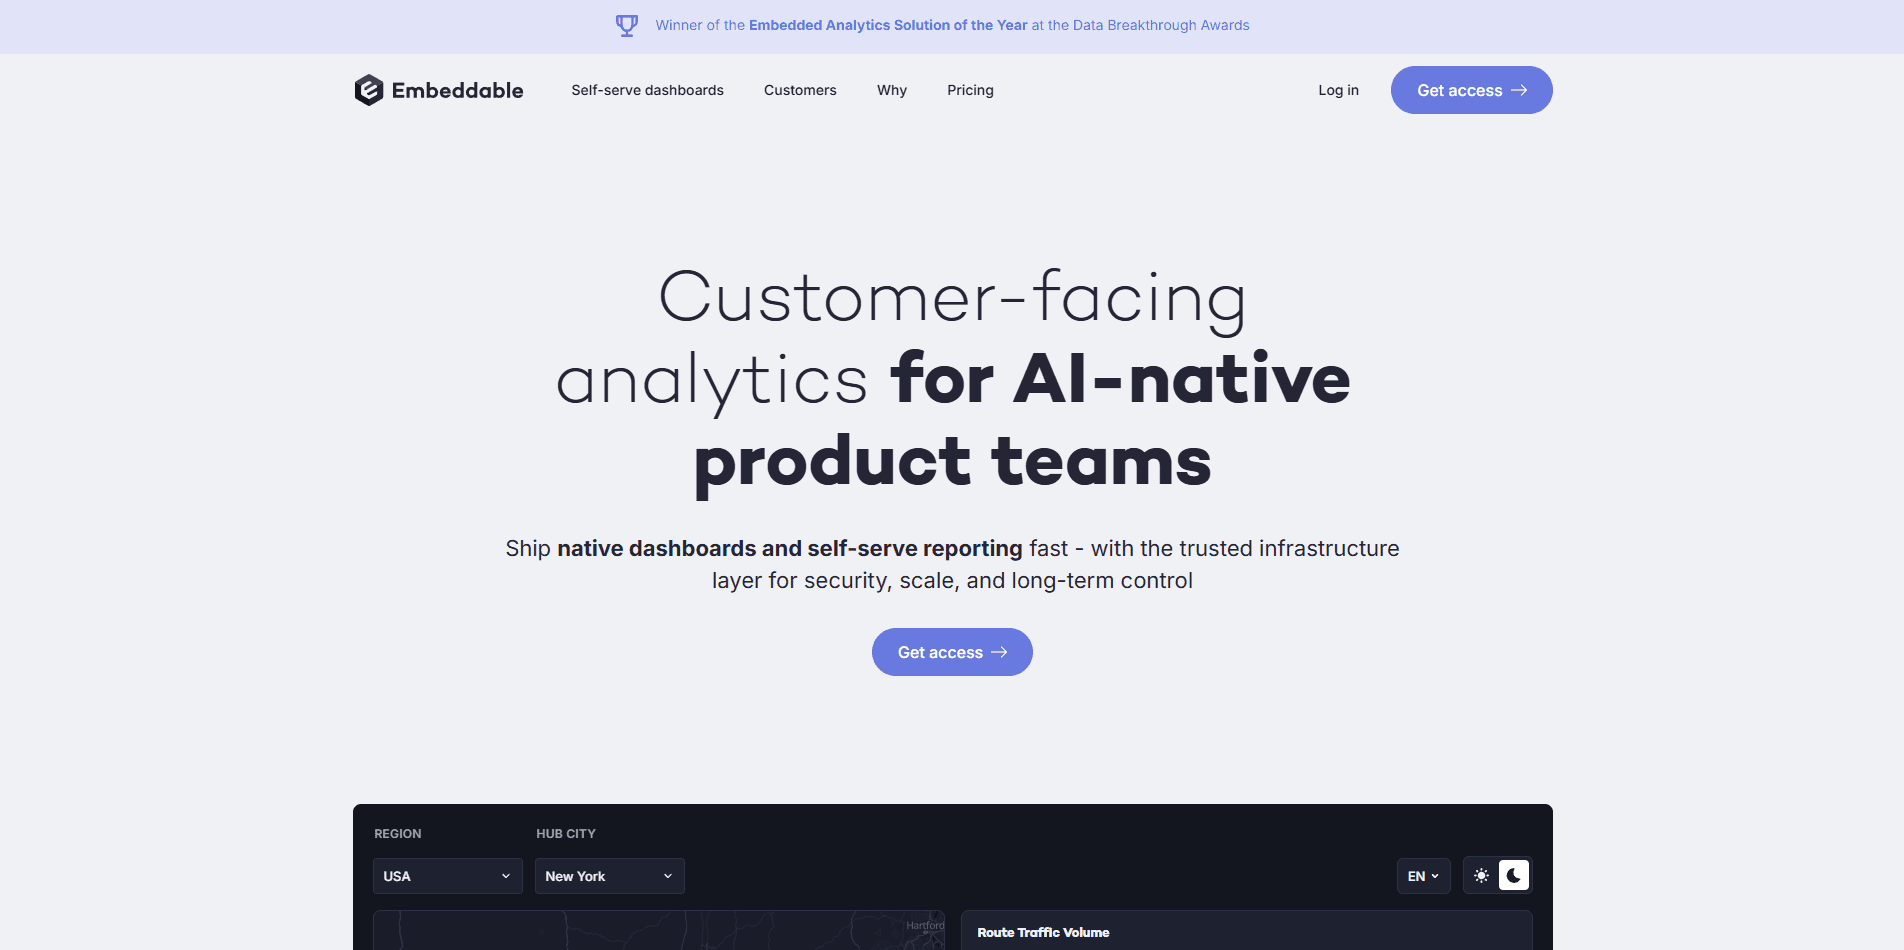
Embeddable is a developer-focused embedded analytics platform made for SaaS products that need fast, native-feeling customer-facing dashboards.
It gives engineers full control of the UI, while still letting non-technical teams build dashboards through a simple drag-and-drop editor.
Unlike Omni, which is built mainly for internal BI with workbooks, semantic models, and governed metrics, Embeddable is designed for customer-facing analytics that look and feel like part of your product.
Key Features of Embeddable
You can build fully custom chart components in React, or start with Embeddable's open-source chart library and extend it however you want.
Dashboards embed as HTML Web Components, not iframes, so they look completely native and follow your own styles, fonts, and UI patterns.
You can give customers full self-serve control through Custom Canvas, so they can build, save, and customize their own dashboards inside your product.
Embeddable offers two layers of caching, giving dashboards sub-second speed even on large datasets.
You can import any chart type, including D3, Chart.js, HighCharts, ApexCharts, or build your own.
Embeddable vs Omni: Quick Comparison
Feature | Embeddable | Omni |
Core Use | Customer-facing embedded analytics | Internal BI + embedded dashboards |
UI Approach | Fully native web components, no iframes | Iframe-style embedding + UI options |
Customization | Full control in code; import any chart library; unlimited theming | Customization available but more structured and governed |
Self-Serve | Custom Canvas lets end-users build dashboards | Users explore inside workbooks; less focused on external end-user self-serve |
Multi-Tenant | Built for multi-tenant apps with strict data isolation | Supported but more setup needed |
Pricing | Fixed monthly subscription, unlimited usage | Enterprise-only, custom pricing |
Embeddable Pricing
Embeddable uses a fixed monthly subscription for its cloud platform.
Usage is unlimited, so you can roll out analytics to all customers without extra cost.
Annual plans are available.
Custom plans are offered for special needs like custom SLAs, advanced security, deeper support, and enterprise requirements.
To get exact pricing, companies must contact sales for a quote.
6. Microsoft Power BI: A Scalable, Enterprise BI Alternative to Omni
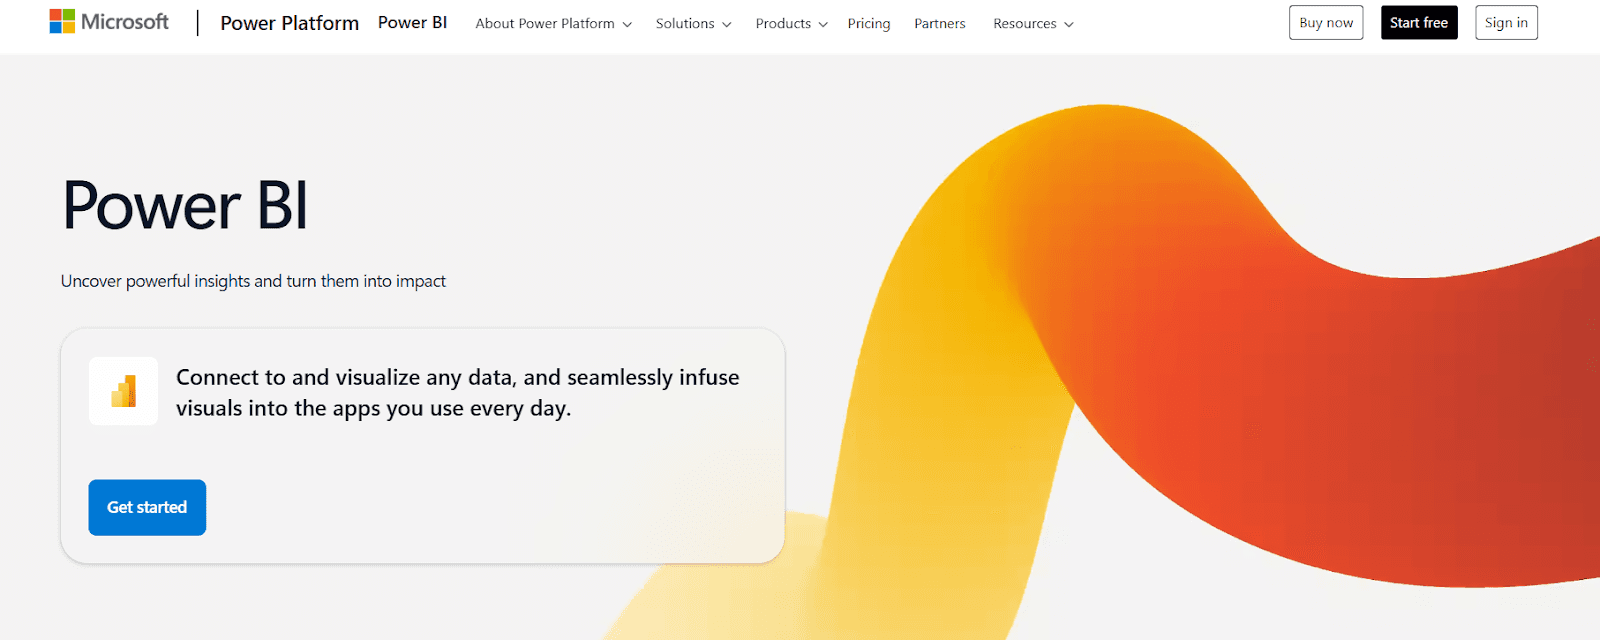
Microsoft Power BI is a widely used business intelligence platform that helps teams connect to any data, create interactive reports, use AI for insights, and share dashboards across the organization.
It's especially strong for companies already using Microsoft tools like Excel, Teams, Azure, and Dynamics 365.
Key Features of Microsoft Power BI
Power BI lets anyone turn data into charts and reports using an easy drag-and-drop interface and AI-powered suggestions.
You can connect to almost any data source and bring everything together as a single, governed source of truth.
Power BI works smoothly with Microsoft 365 tools like Teams, Excel, PowerPoint, Outlook, and SharePoint.
You can embed interactive reports inside your own product using Power BI Embedded, a pay-as-you-go Azure service.
Power BI includes Copilot in Microsoft Fabric, allowing users to create reports or summaries using natural language.
Microsoft Power BI vs Omni: Quick Comparison
Feature | Power BI | Omni |
Core Use | Self-service + enterprise BI | Governed BI with workbook model |
Report Creation | Drag-and-drop reports + AI suggestions | Workbook UI with SQL + Excel-style formulas |
AI Features | Copilot, AI-generated reports, natural-language insights | AI assistant for summaries and explanations |
Embedding | Power BI Embedded (PaaS), highly scalable | Embedded dashboards with SSO; simpler than PBI |
Deployment | Cloud, on-prem (Report Server), hybrid | Cloud-first |
Pricing | Starts free / $14/user / $24/user / Fabric variable | Enterprise-only pricing, sales-based |
Microsoft Power BI Pricing
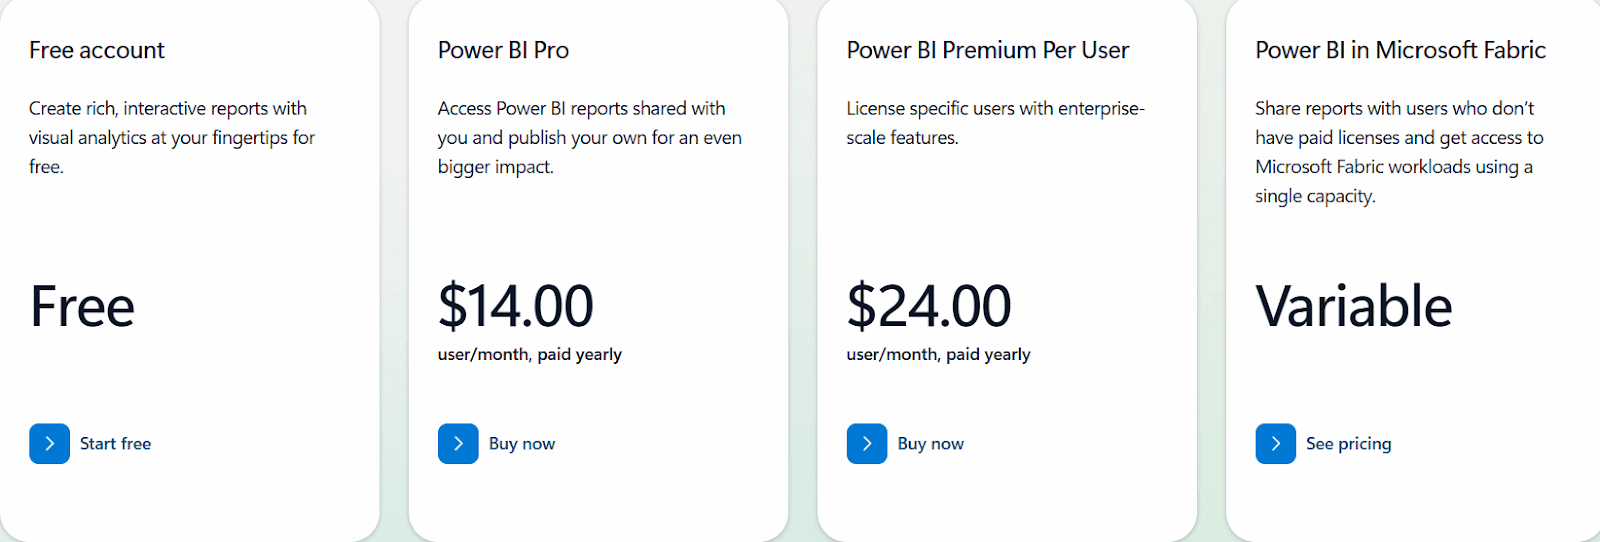
Free Account: Create interactive reports at no cost and use Power BI Desktop.
Power BI Pro: $14/user/month (billed yearly), lets users share reports, publish content, and collaborate.
Power BI Premium Per User: $24/user/month (billed yearly), adds enterprise-scale features for advanced workloads.
Power BI in Microsoft Fabric: Variable pricing, capacity-based model for sharing reports with users who don't have paid licenses, plus access to Fabric workloads.
Power BI Embedded: Pay-as-you-go (Azure PaaS), pricing varies based on usage and capacity; used for embedding reports into apps.
7. Upsolve AI: AI-Native Omni Alternative

Upsolve is an AI-powered embedded analytics platform built for SaaS companies that want to give their customers powerful dashboards inside their own products.
It connects to your data in minutes, lets you build dashboards with a simple interface, and allows users to ask questions in plain English to generate charts, summaries, and insights instantly.
Upsolve also offers full branding control, strong data security, and smooth embedding.
Key Features of Upsolve AI
Upsolve lets users ask questions in plain English and get instant charts or summaries powered by AI.
You can build dashboards quickly using drag-and-drop tools, no need for complex setup.
All dashboards can be styled to match your product's branding with full control over colors, layout, and logos.
Dashboards can be securely embedded into your product using React or iframe, and customers can interact with their own data.
It supports multiple tenants, so you can give each customer their own analytics view in one system.
Upsolve AI vs Omni: Quick Comparison
Feature | Upsolve | Omni |
Core Use | Embedded analytics for SaaS apps | Internal BI and team dashboards |
Embedding | Easy with full branding control | Supported |
AI Capabilities | Strong AI for queries and summaries | Basic AI summaries |
Custom Styling | Full white-label and CSS theming | Limited theming |
User Access | End users can explore data on their own | Analyst-led access |
Multi-Tenant Support | Built-in, ready for SaaS | Not native, needs setup |
Pricing | Free tier + paid from $500/mo (Team $2,000/mo for embedding) | Enterprise-only pricing |
Upsolve AI Pricing
Upsolve AI offers a free plan plus three paid tiers; embedding and multi-tenant analytics start on the Team plan ($2,000/mo).
Free ($0): 2,000 one-time credits (~200 questions); all Pro features, to test-drive
Pro ($500/mo): 2,000 credits/month; 50+ data connections, unlimited agents, full observability
Team ($2,000/mo): 10,000 credits/month; adds embedding, RBAC/row-level security, multi-tenant, and semantic-layer generation
Enterprise (custom): on-prem/VPC, SAML SSO, HIPAA, SOC 2, and BYOM
Annual billing is 20% off.
Which Omni Alternative Should You Choose?
Each Omni alternative offers something different, depending on what your team needs most. Here's a simple guide:
If you prefer spreadsheet-style analysis, go with Sigma.
For enterprise-grade dashboards and advanced AI, choose Qlik Sense.
If full design control matters most, Luzmo is a great fit.
For developer-led, fully custom analytics, pick Embeddable.
If you want deep Microsoft integration with strong governance, Power BI is ideal.
For enterprise data modeling and strict governance, Looker is a strong choice.
If you want agent-driven embedded analytics with conversational querying, Upsolve is worth evaluating.
Frequently Asked Questions
1. What is Omni used for?
Omni is a BI tool that combines a workbook interface, SQL, and a shared semantic model to help teams explore data, build dashboards, and share consistent metrics.
2. Why look for an Omni alternative?
Teams look for alternatives when they need faster embedding, more UI customization, lower pricing, or tools focused on customer-facing analytics instead of internal BI.
3. Which Omni alternative is best for SaaS products?
Luzmo, Embeddable, and Upsolve are strong options for embedded, customer-facing dashboards and offer full white-labeling, multi-tenant support, and strong performance.
4. Which Omni alternative is best for teams that want a spreadsheet feel?
Sigma. It gives users a live spreadsheet interface directly on warehouse data.
5. Which alternative offers the strongest enterprise BI features?
Power BI and Qlik Sense both offer strong governance, enterprise-scale reporting, AI tools, and large ecosystem support.

Try Upsolve for Embedded Dashboards & AI Insights
Embed dashboards and AI insights directly into your product, with no heavy engineering required.
Fast setup
Built for SaaS products
30‑day free trial


