
Compare the best Narrative BI alternatives for scalable AI analytics, embedded dashboards, and deeper customization across modern data teams.

Ka Ling Wu
Co-Founder & CEO, Upsolve AI
10 min

Disclosure: This article is published by Upsolve AI. Where our product is mentioned alongside competitors, we aim to provide balanced coverage based on publicly available information. We encourage readers to evaluate all options independently.
If you’re looking for Narrative BI alternatives in 2025, you likely want AI analytics that scale and let you customize more.
Narrative BI is good for plain-language summaries.
But it can feel limited for growing teams. Integrations aren’t very deep, advanced charts are basic, and embedded analytics are not fully supported.
That makes it hard for SaaS founders, business leaders, and data teams to use it as a long-term solution.
In this guide, I’ll share the best alternatives to consider this year.
We’ll look at their pricing, features, and real-world use cases to see which tools fit different business needs.
By the end, you’ll know which tool matches your workflow and helps you scale with confidence.
TL;DR – Best Narrative BI Alternatives Overall
Here’s a quick snapshot of top alternatives (deep dive later):
Best for deep customization and reporting: Tableau
Best for AI-assisted data queries and insights: Power BI
Best for multi-cloud integrations and enterprise governance: Sisense
Best for collaborative data notebooks and analytics workflows: Qlik Sense
Best for SaaS teams and embedded analytics: Upsolve AI
What to Look for in Narrative BI Alternatives
When evaluating tools beyond Narrative BI, it’s not about “better or worse”, it’s about fit for purpose. Here are the essential factors to consider:
Custom Reports: Ability to create tailored dashboards and reports beyond automated stories.
AI Insights: Natural language querying and clear explanations of data trends.
Data Integrations: Connects seamlessly with a variety of data sources, including cloud and on-premise systems.
Security & Governance: Offers audit trails, compliance support, and enterprise-grade data protection.
Scalability: Handles large datasets and grows smoothly with your team and user base.
How We Evaluated the Best Narrative BI Alternatives
To shortlist the best Narrative BI alternatives, we focused on the factors that matter most to modern data teams and SaaS builders:
Ease of Setup – How quickly teams can deploy and start analyzing without a heavy technical lift.
Pricing Transparency – Clear, scalable pricing that avoids hidden per-seat or per-query costs.
Embedded Analytics Capabilities – Support for white-label dashboards, multi-tenant deployments, and customer-facing insights.
Integration Flexibility – Ability to connect with popular databases, cloud warehouses, and third-party tools.
Governance & Security – Role-based access, audit trails, and compliance-friendly features.
Scalability – Whether the platform supports growth from startup to enterprise workloads.
User Feedback – Real-world pros and cons gathered from reviews on G2, Capterra, and Trustpilot.
This framework ensures each alternative isn’t just a tool, but a practical fit for specific use cases, from startups needing quick no-code analytics to enterprises requiring deep customization and governance.
Top 5 Narrative BI Alternatives & Competitors
Tool | Key Features | Pricing Models | Best For | How it compares to Narrative BI |
|---|---|---|---|---|
Tableau | Drag-and-drop dashboards, advanced visualization, wide integration library | Creator: Contact Sales – Full authoring, eLearning included Explorer: Contact Sales – Limited analytics, eLearning included Viewer: Contact Sales – Read-only access | Enterprises and teams prioritizing rich dashboards | Strong visualizatio capabilities, but less focused on real-time observability and AI-driven governance |
Power BI | AI insights, natural language queries, Microsoft ecosystem integration | Free Account: Free Power BI Pro: $14 per user/month (billed annually) Power BI Premium Per User (PPU): $24 per user/month (billed annually) Power BI Embedded: Variable, based on usage | SMBs and enterprises already using the Microsoft stack | Cost-effective with AI insights; less flexible for SaaS-embedded analytics and multi-tenant governance |
Qlik Sense | Associative data engine, embedded analytics, smart visualizations | Qlik Analytics: Starter $200/mo (10 users, 25 GB), Standard $825/mo, Premium $2,750/mo, Enterprise custom. | Teams needing fast exploration and ad-hoc analysis | Excels at exploration and ad-hoc analysis; less focused on pipeline observability and anomaly detection |
Sisense | AI-driven insights, multi-cloud support, seamless pipelines | Custom pricing (enterprise-focused) | Large enterprises with complex data environments | Powerful AI insights and cloud support; more enterprise-oriented, less lightweight than Narrative BI for smaller teams |
Upsolve AI | Agentic Dashboard, Agent Studio context layer, anomaly alerts, white-label embedding | Free tier + paid plans from $500/mo (Pro), Team $2,000/mo for embedding/multi-tenant, Enterprise custom; usage-based credits | SaaS startups and scaling businesses needing governed, embedded analytics | Agent-driven, embedded analytics for SaaS products; embedding and multi-tenant on the Team plan and above |
1. Tableau – The Narrative BI Alternative
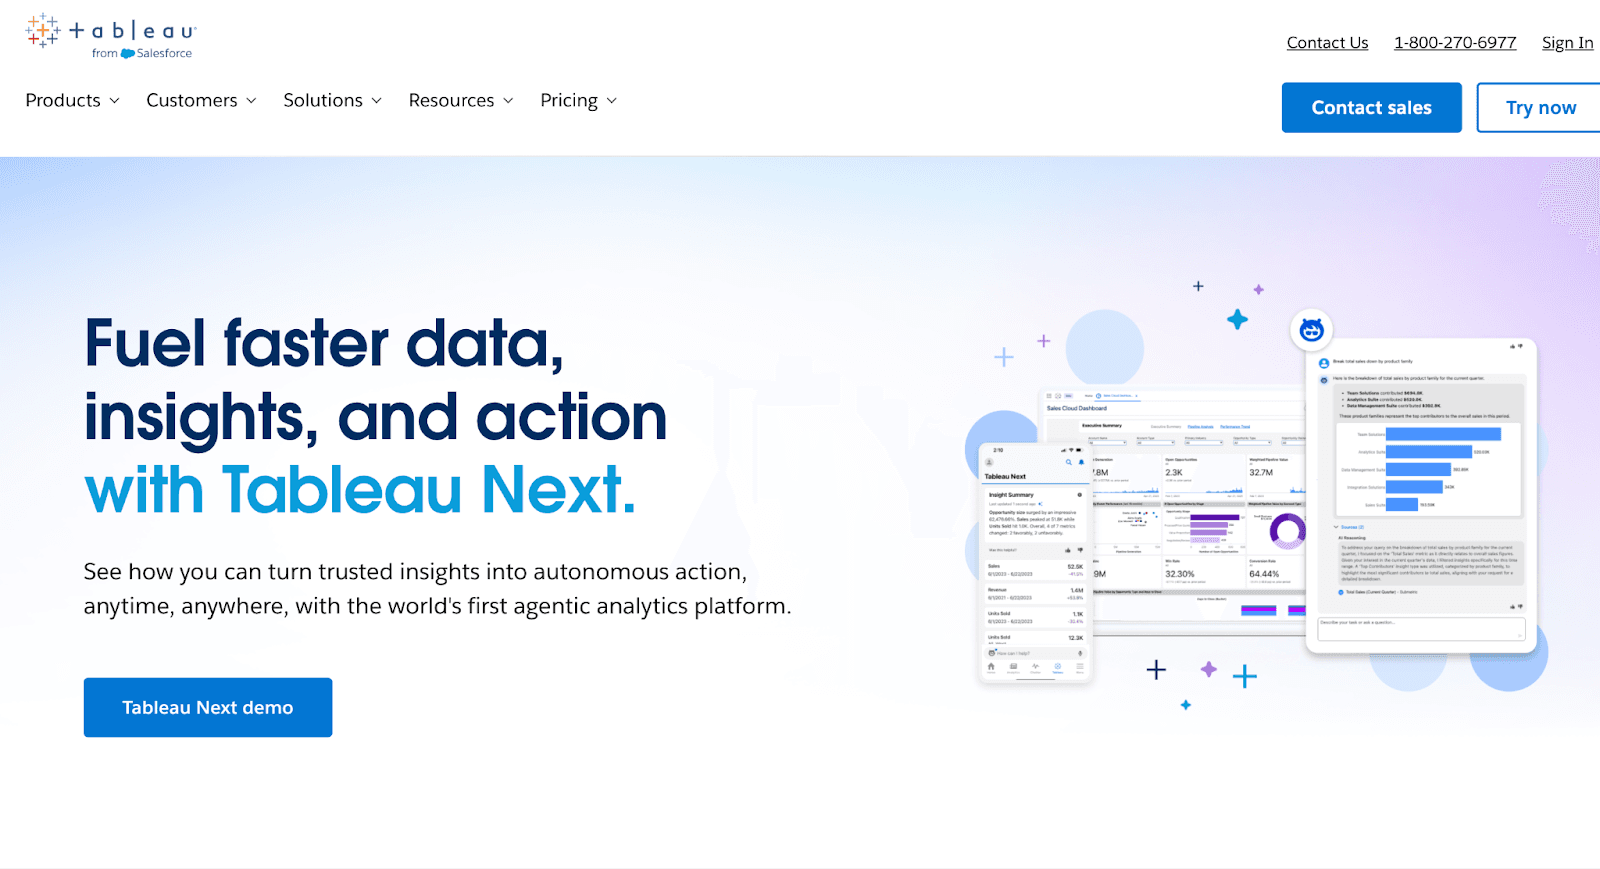
Tableau is built for rich, interactive data visualization. It allows businesses to create highly customized dashboards, connect multiple data sources, and empower stakeholders to explore data independently.
Narrative BI, by contrast, focuses on automated storytelling, turning dashboards into simple narratives that are fast to consume but offer less depth in visualization and interactivity.
Key features that make Tableau stand out:
Drag-and-drop dashboard creation allows users to visually build reports quickly
Advanced data visualization supports complex charts, maps, and interactive visuals.
Wide integration library connects seamlessly with Salesforce, Snowflake, Google Sheets, and more.
Self-service analytics enables stakeholders to explore dashboards independently.
Scalable for enterprise reporting with secure sharing for large teams.
Custom calculations & advanced analytics allow for complex logic and deeper insights.
Pricing:
You have to contact Sales for all pricing quotes.
1. Enterprise Creator –
Includes Tableau Desktop, Tableau Prep Builder, 1 Creator license (Cloud/Server), Advanced Management, Data Management, Tableau Pulse (Cloud only), and 1-year eLearning. At least one Creator is required per deployment.
2. Enterprise Explorer –
Includes 1 Explorer license (Cloud/Server), Advanced Management, Data Management, Tableau Pulse (Cloud only), and 1-year eLearning.
3. Enterprise Viewer –
Includes 1 Viewer license (Cloud/Server), Advanced Management, Data Management, and Tableau Pulse (Cloud only).
Pros:
Offers enterprise-grade governance and security for large-scale analytics deployments.
Provides AI-powered insights that help organizations like KeyBank and JLR improve efficiency and business outcomes.
Connects easily with multiple data sources like Google Sheets, Salesforce, Snowflake
Cons:
Custom calculations and advanced visualizations can be time-consuming to configure correctly.

Dashboards slow down with large datasets or too many filters

Setting up agentic analytics features like Concierge or Semantic Learning can be time-consuming.
Separate licensing for Tableau Prep, Tableau Server, or Tableau Online adds cost and complexity.
How Tableau Compares to Narrative BI?
Tableau provides better visual analytics, extensive data connections, and tools for teams to explore and analyze data independently, while Narrative BI focuses on generating concise, text-based insights quickly without building complex visuals.
Criteria | Tableau | Narrative BI |
Core Approach | Visualization-first BI with highly customizable dashboards and advanced analytics | Automated storytelling platform that converts raw data into narratives and alerts |
Best For | Enterprises and data teams needing deep visualization, scalability, and governance | Marketing and growth teams needing quick, plain-language insights without complex setup |
Key Strengths | Drag-and-drop reporting, powerful integrations (databases, cloud apps), advanced analytics, enterprise sharing | Auto-generated narratives, anomaly alerts, natural language insights, beginner-friendly |
Embedding | Embedding is possible but requires technical setup and licensing | No embedding, works as a standalone narrative/insight feed |
Scalability | Enterprise-ready with strong security, governance, and collaboration features | Lightweight; better suited for small teams and SMEs |
2. Microsoft Power BI – The Microsoft-Powered Narrative BI Alternative
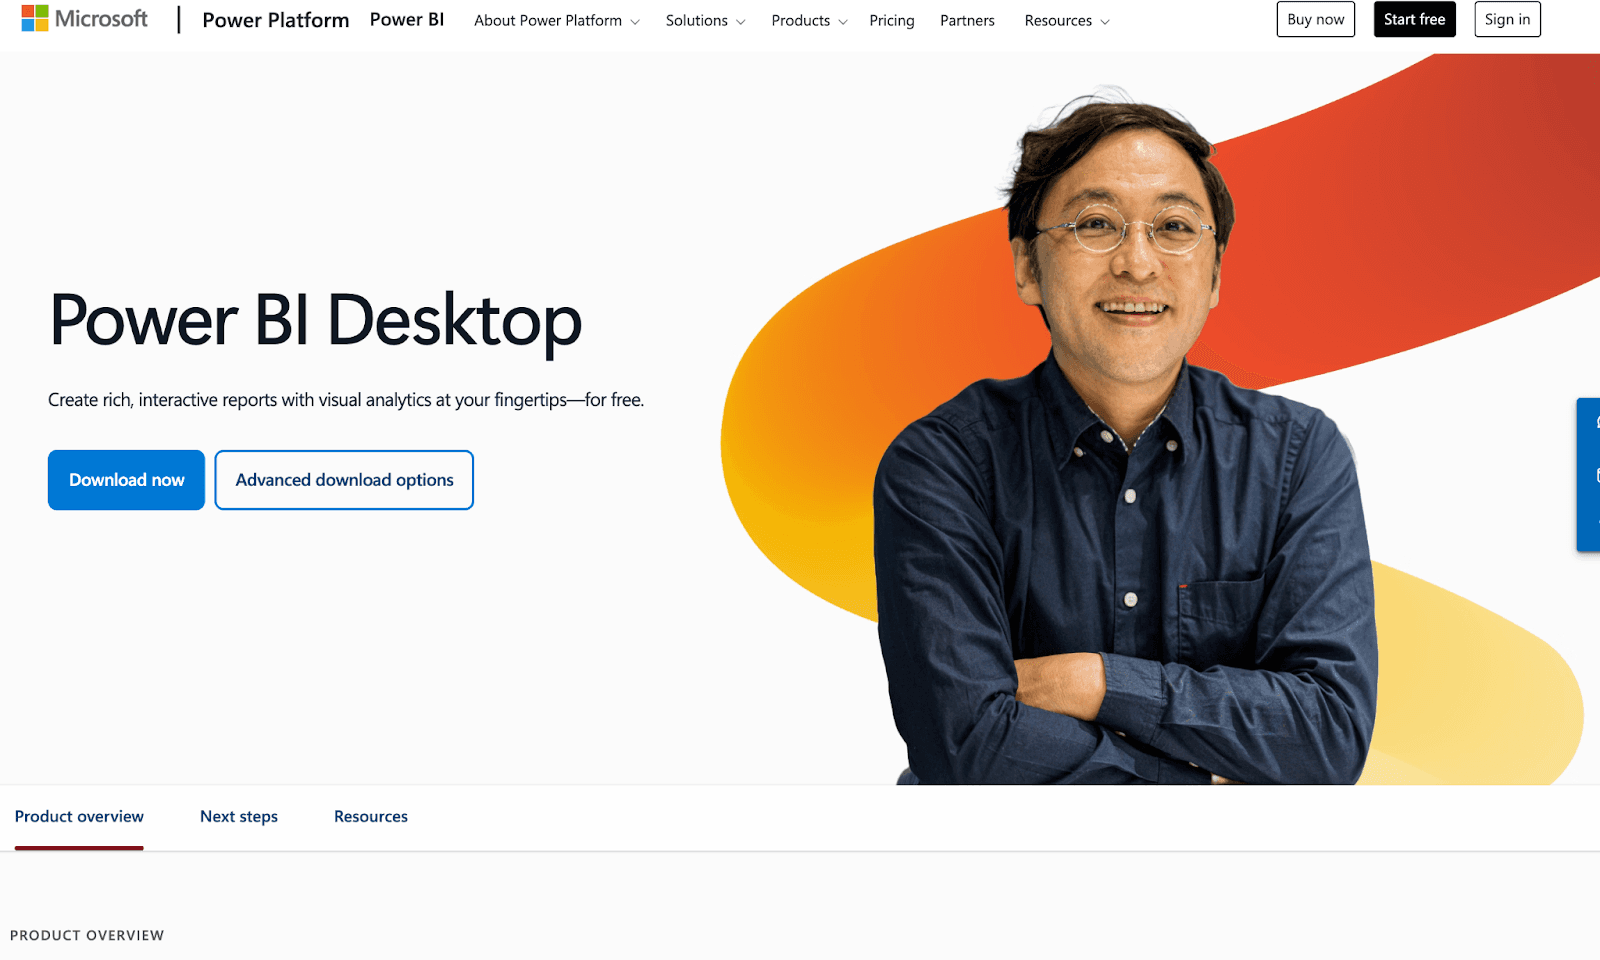
Microsoft Power BI enables comprehensive business analytics and interactive reporting.
Teams can integrate multiple data sources, create real-time dashboards, and perform advanced analysis.
Narrative BI focuses on automated storytelling, providing concise narrative summaries that are faster to consume but less detailed in analytics.
Key features that make Power BI stand out:
Real-time dashboards & reporting → Track business processes and KPIs live, whereas Narrative BI provides static narrative summaries.
Advanced analytics & visualization → Build detailed charts, project mapping, and operational insights, unlike Narrative BI’s simplified narratives.
Seamless integration with Microsoft ecosystem → Works with Excel, Teams, Azure, and other Microsoft products
Data modeling & transformation → Allows complex calculations and data shaping, which Narrative BI does not emphasize.
Accessible across platforms → Power BI works on multiple OS and devices, Narrative BI is primarily web-based.
Quick setup & flexibility → Dashboards are easy to create and modify, while Narrative BI is prebuilt and less customizable.
Pricing:
1. Free Account
$0: Create and view personal reports; upgrade to share and collaborate.
2. Power BI Pro
$14/user/month (billed annually): Publish and share reports, collaborate, and integrate with Microsoft 365.
3. Power BI Premium Per User (PPU)
$24/user/month (billed annually): All Pro features, larger data models, more frequent refreshes, enterprise analytics.
4. Power BI Embedded
Variable: Build customer-facing reports, brand them, automate deployment; requires Pro or PPU license.
Pros:
Integrates seamlessly with multiple Microsoft and external data sources
Flexible, quick to set up, and easy to navigate for simple or advanced reports
Enables real-time monitoring and actionable insights
Cons:
Some advanced features and custom visuals have a steep learning curve

Extra training may be needed to master complex functions

How Power BI Compares to Narrative BI?
When comparing Power BI vs Narrative BI, the main difference lies in depth and flexibility.
Power BI excels in advanced analytics, interactive dashboards, and real-time reporting, making it ideal for teams already invested in the Microsoft ecosystem.
Narrative BI, on the other hand, is better suited for fast, automated storytelling and lightweight insights, without the need for complex setup or modeling.
Criteria | Power BI | Narrative BI |
Core Approach | Visualization-driven, real-time analytics with advanced modeling | Automated storytelling from dashboards |
Best For | Teams needing detailed insights, enterprise analytics, and integration with Microsoft tools | Teams needing quick, narrative-driven insights |
Key Strengths | Real-time dashboards, advanced analytics, Microsoft integration, flexible reporting | Auto-generated narratives, easy summaries |
Scalability | Enterprise-ready, suitable for large teams and multiple projects | Lightweight, better for small to medium teams |
Pricing | Free, Pro $14/user/mo, Premium $24/user/mo, Embedded variable | $30–40 per data source/month (unlimited users) |
3. Qlik Sense - The Connected Data Narrative BI Alternative
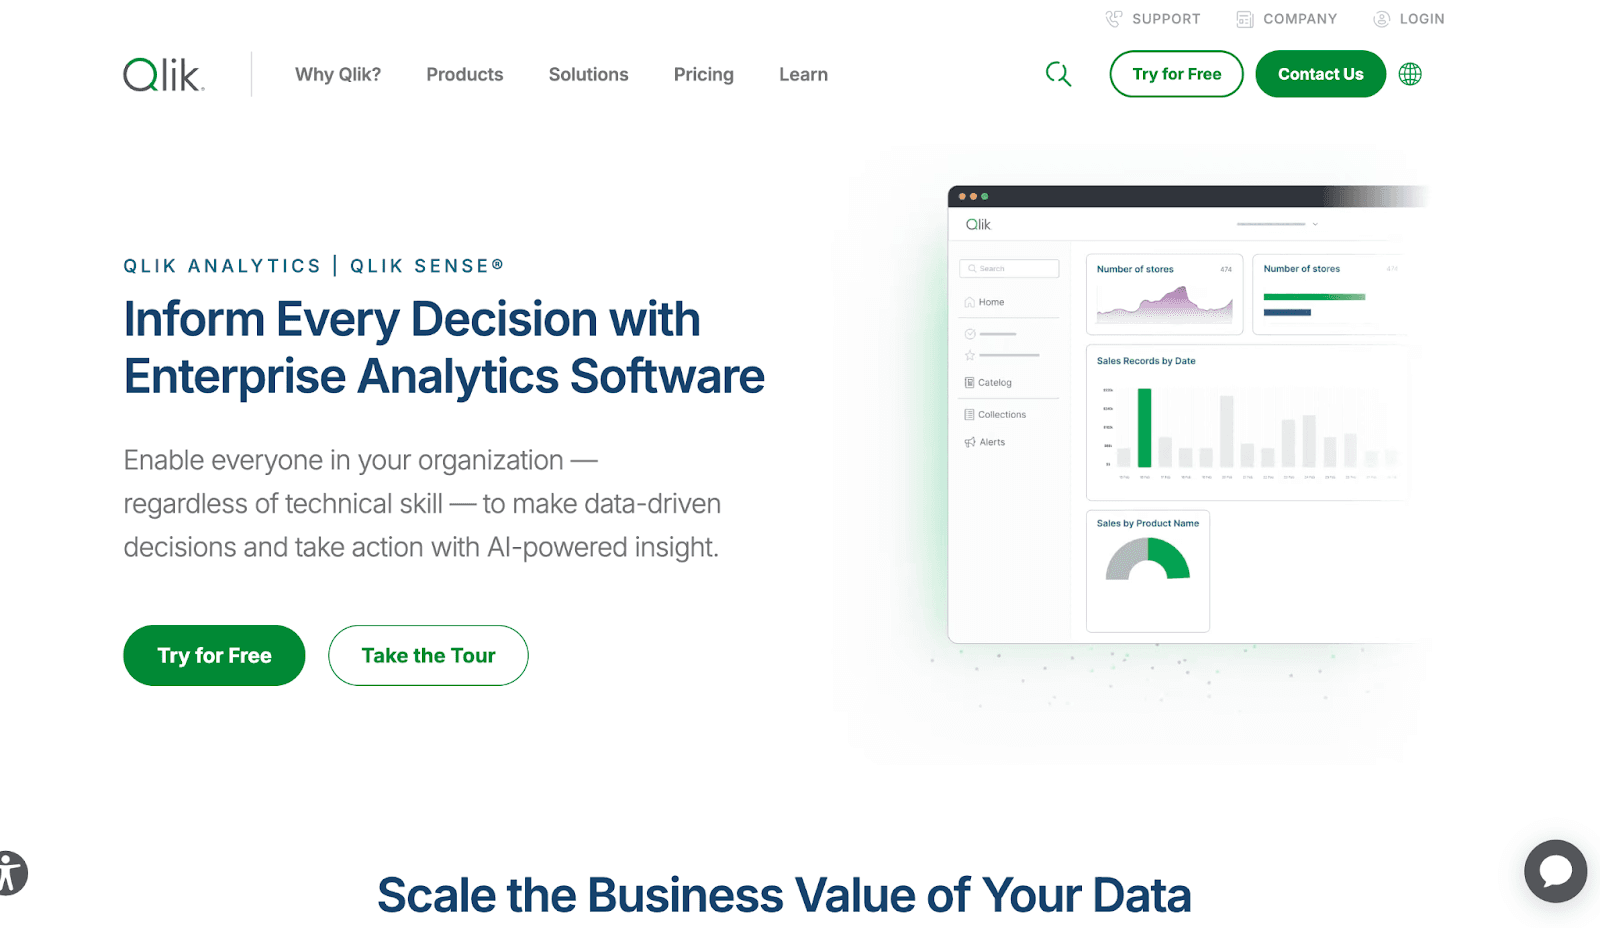
Qlik Sense is built for self-service, associative data analytics. It allows teams to explore multiple data sources, create dynamic dashboards, and perform in-memory analytics on large datasets.
Narrative BI, on the other hand, focuses on automated storytelling, providing simplified narrative insights that are easier to consume but less flexible for complex data exploration.
Key features that make Qlik Sense stand out:
Associative data engine → Browse data without being limited to pre-defined queries; Narrative BI is linear and prebuilt.
Dynamic dashboards → Build interactive, user-friendly dashboards, unlike Narrative BI’s static storytelling format.
Wide variety of data transformation functions → Handle complex calculations and set analysis, Narrative BI focuses on narrative summaries.
Multi-source connectivity → Connect multiple data sources seamlessly; Narrative BI has more limited integration options.
In-memory storage & scalability → Handles large datasets efficiently, whereas Narrative BI is better for lightweight data.
Community & support ecosystem → Strong Qlik community for troubleshooting and learning, Narrative BI has smaller support resources.
Pricing:
1. Standard Plan
Cost: $825/month (billed annually)
Features: 25 GB data capacity, AI-powered analytics, Connect 100+ data sources, Interactive dashboards, Automated reporting, 24x7 support
2. Premium Plan
Cost: $2,750/month (billed annually)
Features: 50 GB data capacity, Predictive analytics, GenAI features, Anonymous/public access, SAP integration, Guided onboarding
3. Enterprise Plan
Cost: Custom
Features: 250 GB+ data capacity, Enterprise-scale analytics, Multi-region tenants, Advanced AI & ML features, Personalized onboarding
Pros:
Handles large datasets with a powerful associative engine.
Dynamic and interactive dashboards for deep insights.
Multi-source connectivity and deep visualization options.
Strong support from the Qlik Community.
Cons:
Steep learning curve for beginners due to extensive functions and scripting

Some limitations in comparing static vs. dynamic targets in filters

Auto ML capabilities could be expanded with more algorithms

How Qlik Sense Compares to Narrative BI:
Qlik Sense excels at interactive analytics, large dataset handling, and dynamic dashboards for enterprise teams.
Criteria | Qlik Sense | Narrative BI |
Core Approach | Associative, self-service data exploration | Automated storytelling from dashboards |
Best For | Teams needing dynamic dashboards, multi-source analytics, and large dataset handling | Teams needing quick, narrative-driven insights |
Key Strengths | Associative engine, in-memory analytics, dynamic dashboards, multi-source connectivity | Auto-generated narratives, easy summaries |
Scalability | Enterprise-ready, handles large datasets efficiently | Lightweight, better for small teams |
Pricing | Professional $30/user/mo, Enterprise custom | $30–40 per data source/month (unlimited users) |
4. Sisense – The Embedded Analytics Narrative BI Alternative
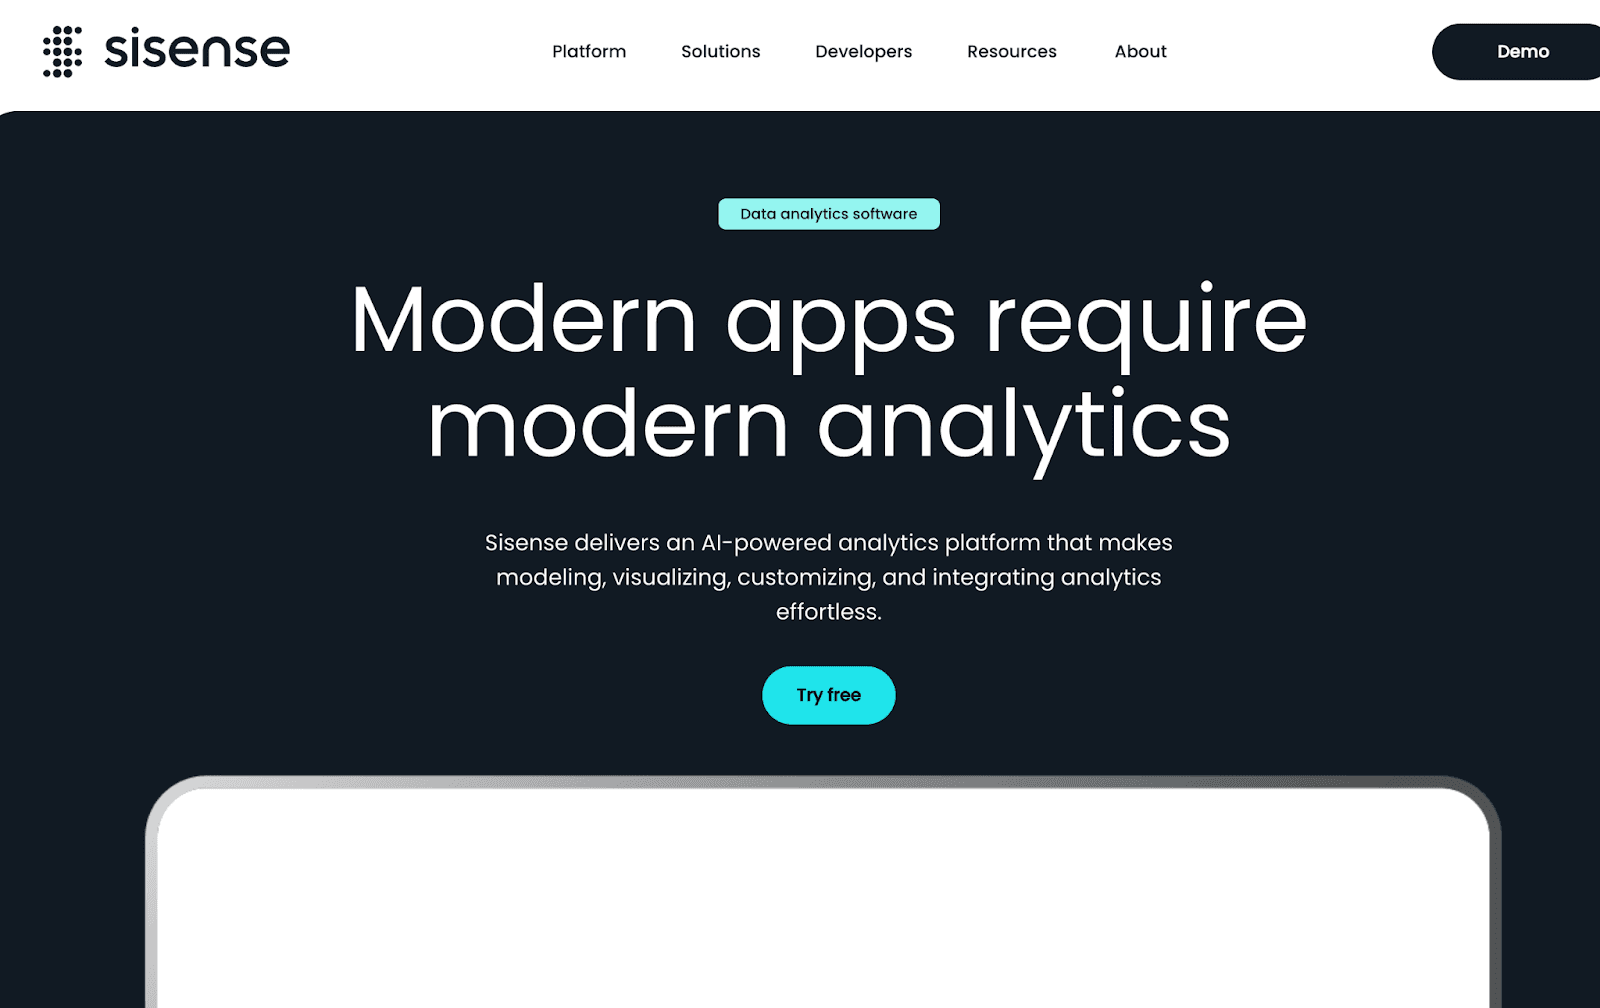
Sisense is built for embedded analytics and complex data environments, allowing users to integrate multiple data sources, create interactive dashboards, and generate AI-driven insights even without deep technical expertise.
Key features that make Sisense better:
Embedded analytics → Integrate dashboards and insights directly into applications, whereas Narrative BI focuses on standalone reporting.
Multi-source integration → Connects seamlessly to diverse data sources; Narrative BI has fewer integration options.
AI-driven insights & narratives → Generates automated summaries and analyses for tables and charts; Narrative BI offers lighter storytelling.
Customizable, interactive dashboards → Users can design dashboards without heavy IT involvement; Narrative BI is less flexible.
Scalability for complex datasets → Handles large, multi-cloud data efficiently, unlike Narrative BI, which is better for small-scale use.
Advanced analytics capabilities → Supports data modeling, filtering, and ad-hoc reporting; Narrative BI focuses on prebuilt narratives.
Pricing:
It has custom pricing depending on data needs and infrastructure (contact sales).
Pros:
Converts large, multi-source datasets into clear, actionable insights via intuitive dashboards.
Combines data from Salesforce, Google Sheets, Snowflake, and other platforms with minimal IT support.
Offers fully interactive dashboards that can be embedded into applications for real-time analytics.
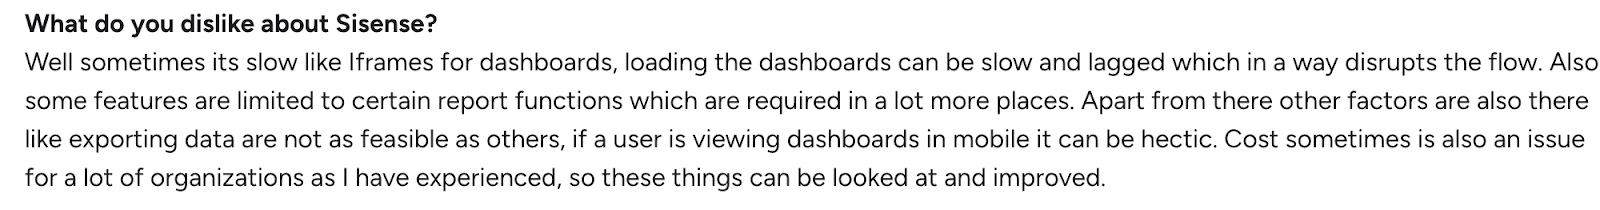
Cons:
Dashboards can be slow to load, especially large ones

Some advanced reporting functions are limited to certain areas
How Sisense Compares to Narrative BI:
Sisense excels in AI-assisted dashboards, multi-source integration, and interactive reporting for complex environments, making it ideal for enterprise teams.
Criteria | Sisense | Narrative BI |
Core Approach | Embedded, AI-driven analytics with interactive dashboards | Automated storytelling from dashboards |
Best For | Large enterprises with complex datasets and embedded analytics needs | Teams needing quick, narrative-driven insights |
Key Strengths | AI-generated insights, multi-source integration, interactive dashboards, and scalable for large datasets | Auto-generated narratives, easy summaries |
Scalability | Enterprise-ready, supports complex, multi-cloud environments | Lightweight, better for small teams |
Pricing | Custom pricing (contact sales) | $30–40 per data source/month (unlimited users) |
Who Should & Shouldn’t Use Narrative BI?
Who Should Use Narrative BI | Who Shouldn’t Use Narrative BI |
Small to mid-sized teams looking for automated data storytelling | Large enterprises needing deep customization and advanced reporting |
Marketing and growth teams focused on quick insights from campaign data | Teams requiring extensive multi-source integrations or complex workflows |
Users who prefer plain-English explanations and AI-generated narratives | Organizations with strict governance, compliance, or security requirements |
Teams that want a fast setup without heavy technical overhead | Companies handling very large datasets or multi-tenant architectures |
Teams looking for a simple, guided analytics experience | Analysts needing advanced modeling, collaboration, or experiment tracking |
5. Upsolve – The Narrative BI Alternative
Upsolve AI is a two-sided agentic analytics platform. Business users explore data through an Agentic Dashboard, asking questions in natural language and describing the charts they want the agent to build, while data teams use Agent Studio to encode the metric definitions and business rules that keep answers accurate.
Where Narrative BI focuses on automated storytelling for internal teams, Upsolve suits SaaS companies that also want to embed customer-facing dashboards, with multi-tenant support and row-level security.
It leans toward agentic, embedded analytics rather than narrative report generation, so the better fit depends on whether you want in-context dashboards or written summaries.
Key Features that make Upsolve Better:
Real-time Monitoring → Upsolve continuously tracks metrics and anomalies, while Narrative BI only generates summaries from existing dashboards.
Anomaly Detection → Proactively flags unusual patterns, unlike Narrative BI, which doesn’t specialize in proactive detection.
Audit Tracking → Ensures compliance and governance, while Narrative BI focuses more on storytelling than regulated oversight.
Intuitive, Fully Customizable Dashboards → Teams can design analytics to match strict UX/UI needs, whereas Narrative BI offers fixed storytelling formats.
Multi-Tenant Support → Built for SaaS scalability, letting businesses serve multiple clients from one environment, while Narrative BI is more suited to internal team insights.
Seamless Embedding → Analytics can be directly integrated into SaaS products, which Narrative BI doesn’t emphasize, as it’s geared toward standalone narratives.
Wide Integration Support → It connects to all major databases and 40+ data sources, compared to Narrative BI’s more limited marketing and ads focus.
Pricing:
Upsolve AI offers a free plan plus three paid tiers; embedding and multi-tenant analytics start on the Team plan ($2,000/mo).
Free ($0): 2,000 one-time credits (~200 questions); all Pro features, to test-drive
Pro ($500/mo): 2,000 credits/month; 50+ data connections, unlimited agents, full observability
Team ($2,000/mo): 10,000 credits/month; adds embedding, RBAC/row-level security, multi-tenant, and semantic-layer generation
Enterprise (custom): on-prem/VPC, SAML SSO, HIPAA, SOC 2, and BYOM
Annual billing is 20% off.
Pros:
Upsolve provides interactive, embedded dashboards directly in your SaaS product.
Designed for customer-facing analytics at SaaS scale, unlike Narrative BI, which focuses on marketing teams.
Users ask plain-language questions like “Show me revenue in Q2” and get instant insights.
AI-assisted visualization building creates charts simply by asking a question.
Dashboards deploy in days (fastest: 48 hours), while most BI tools take weeks.
Enterprise data stays secure with pushdown compute and on-premise or VPC deployment.
Supports 40+ data connectors via an API-first approach, reducing ETL overhead.
Cons:
Limited focus on internal BI needs; primarily designed for customer-facing analytics.
Lacks out-of-the-box templates compared to tools like Qrvey, requiring setup for first dashboards.
Upsolve is for real-time analytics, while Narrative BI excels at tracking and analyzing historical data trends.
How Upsolve Compares to Narrative BI?
Upsolve AI and Narrative BI take different approaches.
Narrative BI focuses on automated, plain-language storytelling for internal growth and marketing teams.
Upsolve AI is a two-sided agentic analytics platform: its Agentic Dashboard lets business users ask questions in natural language, and Agent Studio gives data teams the context layer behind those answers.
It fits SaaS companies that want to embed customer-facing dashboards, with multi-tenant support and row-level security.
Feature | Narrative BI | Upsolve |
Core focus | AI-generated narratives & anomaly alerts for growth/marketing teams | Embedded BI for SaaS products with customer-facing dashboards |
Embedding | Standalone tool, not designed for product embedding | Built for embedding inside apps (React/iFrame components) |
Customization | Fixed storytelling formats | Fully customizable, brand-themed dashboards |
Target audience | Internal marketing & growth teams | SaaS companies serving analytics to end customers |
Data sources | Strong in marketing & ad platforms (GA, Ads, FB Ads) | Broad database & warehouse support with API-first approach |
Multi-tenant | Workspaces for internal use | Native multi-tenant support for SaaS scalability |
Conclusion
Narrative BI is best for growth and marketing teams that need fast, automated insights and anomaly alerts without heavy setup.
It simplifies analytics for non-technical users but is limited when it comes to embedded dashboards, multi-tenant support, or large-scale customization.
Upsolve AI offers a broader alternative, combining real-time monitoring, role-based dashboards, and embedded analytics that scale with SaaS products.
While tools like Tableau, Power BI, Qlik Sense, and Sisense remain strong choices for enterprise reporting and visualization.
Upsolve AI stands out for companies that need flexible, customer-facing analytics built directly into their product.
Teams may struggle to scale insights or fully customize dashboards without exploring alternatives.
Discover how Upsolve AI can transform your analytics workflows. Chat with us and explore a live demo today!
FAQs
Q1. What is Narrative BI used for?
Narrative BI is used for automating data storytelling, turning raw analytics into narrative summaries that non-technical stakeholders can easily understand.
Q2. Why consider alternatives to Narrative BI?
Because many organizations need more than narratives, they need scalability, embedded dashboards, observability, or deep visual customization.
Q3. Is Upsolve AI a competitor to Narrative BI?
Yes, but with different focus areas. Narrative BI = storytelling. Upsolve AI = observability + embedded analytics.
Q4. Which Narrative BI alternative is most affordable?
Power BI is the most budget-friendly, starting at $10/user/month.
Q5. Which alternative is best for SaaS founders?
Upsolve AI, because it supports multi-tenant dashboards, observability, and governed workflows.
Q6. Which alternative is best for enterprises?
Sisense, its multi-cloud architecture and governance features handle large-scale environments.
Q7. Can Narrative BI be replaced entirely by Tableau or Power BI?
Yes, if your team values visualization and analytics depth over narrative automation.

Try Upsolve for Embedded Dashboards & AI Insights
Embed dashboards and AI insights directly into your product, with no heavy engineering required.
Fast setup
Built for SaaS products
30‑day free trial


