
Practical comparison of Power BI Embedded pricing models, breaking down monthly and annual plans, capacity tiers, and real SaaS cost trade-offs.

Ka Ling Wu
Co-Founder & CEO, Upsolve AI
10 min

If you're planning to embed dashboards or analytics inside your SaaS product, Power BI Embedded is one of the options you might be evaluating.
However, the Power BI pricing model can be confusing, with hourly compute rates, reserved capacity, CUs, tiers, and the distinction between consumption and commitment. It’s easy to get lost.
This guide makes it simple.
In the first few minutes, you’ll learn:
How Power BI Embedded pricing works in 2025
The difference between monthly (pay-as-you-go) and annual (reserved) plans
Real-world price examples for SaaS companies at different stages
How to calculate your expected monthly & yearly cost
When you should choose monthly and when annual makes more sense
The goal is simple: to help you understand pricing in clear terms, avoid surprises, and select the right plan for your product's current stage.
By the end, you'll know:
The true cost of Power BI Embedded
Which plan fits your stage
Alternatives if the BI infrastructure feels too complex or expensive
Let’s break it down step-by-step.
Power BI Embedded Pricing at a Glance (2025)
Made it from perplexity
Before diving into details, here’s the quick snapshot most buyers look for.
Power BI Embedded has two types of pricing:
Monthly Pay-As-You-Go (hourly billing)
Annual Reserved Capacity (commit & save)
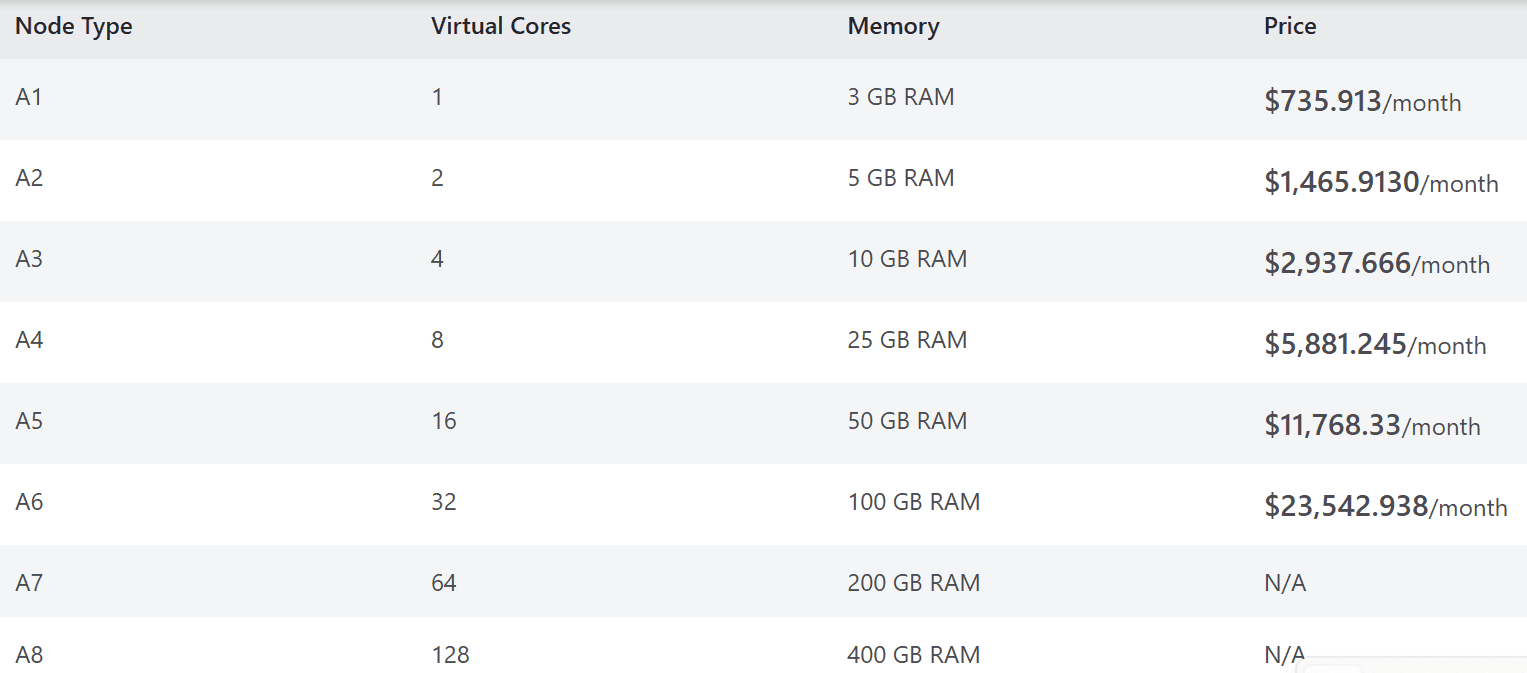
✅ Power BI Embedded A-Series Pricing
SKU Tier | Compute Units | Monthly Estimate (720 hrs) | Annual Estimate | Notes |
A1 | 1 CU | ~$740/month | ~$8,500/year | Basic workloads, MVP stage |
A2 | 2 CU | ~$1,480/month | ~$17,000/year | Good for early SaaS with 100-500 active users |
A3 | 4 CU | ~$2,960/month | ~$34,000/year | Growth stage, 500-2,000 users |
A4 | 8 CU | ~$5,920/month | ~$68,000/year | Scalability for multi-tenant SaaS |
A5 | 16 CU | ~$11,840/month | ~$136,000/year | Data-heavy enterprise dashboards |
A6 | 32 CU | ~$23,680/month | ~$272,000/year | Very high concurrency workloads |
Remember: Actual costs vary slightly by region & usage hours, but this provides you with solid budgeting numbers.
If you’re testing, go monthly.
If you’re scaling, annual can reduce cost, but only if you're confident in steady usage.
This is not like normal SaaS pricing; you’re renting compute power, not user licenses.
That’s why understanding capacity and real load matters before committing.
Monthly vs Annual: Key Differences
Power BI Embedded doesn’t work like normal SaaS tools, where you pay per user.
Here, you’re paying for compute capacity, the “engine” behind your dashboards.
So choosing monthly vs annual mostly comes down to this question:
Do you fully know your workload and dashboard usage pattern yet?
Let’s break it down clearly.
✅ Monthly Plan (Pay-As-You-Go)
Best when you need flexibility.
Good for:
MVP / early product dashboards
Limited users while testing adoption
Variable usage (traffic spikes or business-hours usage)
Startups are still validating who will use dashboards and how often
Benefits
No commitment
Scale up/down anytime.
Pause billing when not needed.
Perfect for experimentation & pilots
Example
Scenario | What Happens |
Small SaaS launching analytics | Keep A1/A2 for first 3–6 months |
Usage spikes on weekdays only | Scale up during working hours, down at night |
Still figuring out usage | Stay flexible and avoid overpaying |
✅ Annual Reserved Plan
Best when you need cost stability and long-term commitment.
Good for:
Live product with steady dashboard traffic
1,000 active users consistently
You already know your usage patterns.
Long-term enterprise deployment
Benefits
Lower hourly rate (discounted cost)
Predictable monthly billing
No surprise spikes if traffic is consistent
Trade-offs
You commit to a specific capacity.
Less flexibility to scale down
Here’s Quick Decision Guide
Situation | Recommended Plan |
New SaaS or experimental dashboards | Monthly |
Usage changes by day/time | Monthly |
Scaling a product with steady adoption | Annual |
Enterprise analytics platform | Annual |
Rule of Thumb
| If your dashboards don’t have predictable usage yet → start monthly |
| If customers use dashboards every day & need uptime → go annual |
Simple way to think about it
Monthly = Freedom while learning
Annual = Savings once confident
What most teams do
Start with A2 monthly.
Monitor load, concurrency, and refresh schedule.e
Move to annual A3/A4 after adoption stabilizes
This avoids overpaying early and locks in efficiency later.
How Power BI Embedded Pricing Works?
Power BI Embedded doesn’t charge per user.
It charges based on the computing power you allocate for your dashboards.
Think of it like renting a server engine; the stronger the engine, the more dashboards and users it can support simultaneously.
Key Concepts You Need to Know
✅ Capacity (A SKUs)
Power BI Embedded uses A-series capacity units such as A1, A2, A3, etc.
Bigger tier = more performance
More performance = more concurrent users + faster refreshes
Capacity | What it means |
A1 | Small engine – good for testing or <200 active users |
A2 | Stable engine – recommended starting point for real apps |
A3/A4+ | Bigger engine – for scaling dashboards & high concurrency |
✅ Compute Units (CUs)
Each tier includes a certain number of compute units.
Tier | Compute Units | Meaning |
A1 | 1 CU | Enough for MVPs / demos |
A2 | 2 CUs | Real-world SaaS workloads |
A3 | 4 CUs | Growing apps / heavier usage |
You don’t see CUs in your product; they're behind the scenes, powering your dashboards.
✅ Billing Model
Power BI charges by the hour of usage.
Monthly = pay for every hour capacity runs
Annual = reserve capacity to lower hourly cost
You can pause capacity when using the monthly model, which is helpful for MVPs and staging environments.
✅ What Increases Cost?
These factors impact how much compute you need:
Number of dashboard users
Number of simultaneous users (concurrency)
Refresh frequency (hourly vs daily vs near-real-time)
Query complexity (simple KPIs vs heavy BI logic)
Amount of data processed and stored
If dashboards spike during business hours and are quiet at night, monthly pricing and a pause schedule can result in significant savings early on.
How It Works
Component | Explanation |
Compute | The virtual engine powering dashboards |
Capacity tier | A1 vs A2 vs A3 = horsepower levels |
Billing | Pay hourly (monthly) or reserve cheaper (annual) |
Scale | Increase capacity as usage grows |
Pause | The monthly plan allows pausing to save money |
Why It Feels Complicated
Power BI Embedded pricing is not based on:
❌ number of users
❌ number of dashboards
❌ number of reports
Instead, it's based on how powerful the compute engine needs to be and how long it runs.
That’s why planning matters; too small, performance suffers. Too big, you overpay.
In the end,
You're paying for computing power, not licenses
Monthly = flexibility, pause anytime.
Annual = predictable cost after usage stabilizes
Start small (A2) → Monitor → Scale when needed
Cost Formulas & ROI Breakdown
Power BI Embedded pricing can feel abstract until you see it in numbers.
Here are some simple formulas and examples that you can plug into your own model.
✅ Basic Cost Formula
Power BI Embedded costs =
Hourly rate × Hours running × Capacity tier
For monthly workloads (running 24/7):
Hourly rate × 720 hours/month
For annual reserved:
Discounted hourly rate × 8,760 hours/year
Annual plans are 20–30% cheaper than monthly plans, depending on the region and tier.
✅ Practical Formulas for SaaS Teams
MVP / Pilot
Run only during work hours (e.g., 10 hrs/day × 22 days)
Hourly rate × 220 hours/month
Best for:
MVPs
Customer pilots
Internal staging analytics
You may pay approximately three times less than running full-time.
Growing SaaS (Steady Usage)
Full-time capacity + occasional scale-ups
(Base capacity × 720 hrs) + autoscale hours
Useful when:
You have real customers
Usage spikes at specific times (such as mornings and month-end reporting).
Enterprise / Always-On Requirements
Reserved instance + autoscale buffer
(Annual reserved tier) + (Seasonal spike hours)
Good when you need:
99.9% uptime
Consistent performance
✅ Example Budget Scenarios
Stage | Capacity | Monthly Estimate | Annual Estimate | Notes |
Prototype / Test | A1 | ~$740 | ~$8,500 | Ideal before customer launch |
Early SaaS (100–500 users) | A2 | ~$1,480 | ~$17,000 | Most common starting point |
Growth (500–2,000 users) | A3 | ~$2,960 | ~$34,000 | Needs stable usage |
Scale (2,000–10,000 users) | A4 | ~$5,920 | ~$68,000 | Enterprise-scale workloads |
✅ How to Estimate Your Tier
Indicator | Likely Tier |
<200 active users, POCs | A1 |
200–800 users, real product | A2 |
800–2,000 users | A3 |
2k–10k users | A4+ |
If your dashboards refresh frequently (hourly real-time metrics), consider going one tier higher.
✅ ROI Framework
Think of Power BI Embedded cost like this:
Value | Impact |
Faster time-to-market | Saves dev cycles vs building BI from scratch |
Enterprise-level analytics UI | Better product perception & retention |
Usage-based scaling | Cost grows with adoption |
Predictable cost at scale | Annual lock-in helps with budgeting |
✅ Quick Tip for Early-Stage Teams
Start with A2 monthly and turn capacity off during nights/weekends.
Many SaaS products cut BI costs by 40–60% in the early months this way.
When to Choose Monthly vs Annual
Choosing between monthly and annual Power BI Embedded plans comes down to predictability, usage maturity, and financial planning.
Here's how to decide without overthinking it.
✅ Choose Monthly if You Need Flexibility
Monthly billing makes sense when:
You are still learning your usage patterns
Your analytics demand fluctuates by season or department cycles.
You are rolling out dashboards in phases.
Your organization prefers OPEX-first budgeting.
You want the ability to pause capacity during downtime.
Workload varies by workday/shift (e.g., operations, reporting teams)
Ideal for:
Pilots and phased deployments
Internal BI rollout across multiple departments
Industries with variable reporting patterns (e.g., logistics, retail, healthcare)
Projects tied to temporary initiatives or variable demand
Monthly allows you to scale, pause, and adjust capacity based on real usage data before locking into commitments.
✅ Choose Annual if You Have Stable, Predictable Workloads
Annual commitments are better when:
Usage is consistent across weeks and months
You already know the compute tier requirements.d
BI dashboards support mission-critical operations.
You have volume discounts or budgeting benefits.
You need a predictable monthly COGS/FinOps structure.
Governance/IT needs fixed resources for planning.
Ideal for:
Mature analytics deployments
Enterprise reporting environments
Organizations with steady user engagement
Long-term embedded analytics or partner portals
Finance teams that prefer CAPEX-aligned commitment
Annual plans reduce cost uncertainty and usually come with lower effective hourly rates — ideal once workloads stabilize.
✅ Quick Decision Summary
Situation | Better Option |
Evaluating usage | Monthly |
Uncertain traffic patterns | Monthly |
Project-based analytics | Monthly |
Steady, predictable workloads | Annual |
Mission-critical reporting | Annual |
Budgeting for fixed spend | Annual |
A more strategic way to decide
Ask yourself or your BI/IT team:
Do we know our baseline load, or are we still discovering it?
If you're still learning → stay flexible.
If you’ve validated consistent usage → secure discounts.
Monthly = discovery, pilots, testing, cost control when usage varies
Annual = commitment, stability, cost efficiency for mature workloads
7 Hidden Costs & Pricing Gotchas to Be Aware Of
Power BI Embedded pricing goes beyond the capacity tier. Teams often budget only for compute, then discover extra costs and operational effort later. Here are the areas you should consider upfront:
1. Data Refresh Load & Scheduling
Refreshing large datasets too frequently can quietly increase your capacity needs.
Things that drive up compute requirements:
Heavy ETL inside Power BI (instead of upstream)
Frequent refresh cycles (hourly or near real-time)
Complex DAX models and joins.
Multiple refresh triggers (departments, time zones, partners)
Tip: Push as much transformation as possible to your data warehouse or ETL tool.
Treat Power BI primarily as a visualization engine.
2. Autoscale Charges
Autoscale is great for performance spikes, but its usage is based on.
When workloads hit the ceiling of your capacity tier, it temporarily scales up another unit and bills hourly for that burst.
Risk: Unexpected peak usage = unexpected cost.
Tip: Set autoscale guardrails and monitor usage heatmaps.
3. Storage & Data Egress Costs
Data stored in Azure and moved across regions or services can add to your monthly bill.
Common contributors:
Large datasets
Frequent data pulls from external systems.
Cross-region analytics workloads
Exporting data to external apps or users
4. Admin & Engineering Time
Power BI Embedded isn't a plug-and-play BI product.
You need:
Capacity planning and monitoring
OOptimisationof refresh cycles
Governance configuration
Embedding setup & maintenance
Tenant and workspace management
Row-level or object-level security design
Translation: There’s an internal operations cost beyond compute.
5. Licensing & Security Requirements
Depending on your architecture, some scenarios require additional licenses, such as:
Power BI Pro for developers or report creators
Premium capabilities for expanding internally
Azure AD/identity governance costs
Always map what your users and builders need separately.
6. BI Model Complexity
Heavy DAX models and large semantic layers can force you into higher capacity tiers faster than expected.
Early mistake: Using embedded computing to compensate for inefficient modeling.
Better approach: Optimize models before scaling compute.
7. Environment Sprawl
Teams often end up running multiple workspaces:
Dev environment
QA environment
Production
Temporary workloads
Partner/tenant environments
Each environment requires thoughtful budget control.
✅ Checklist to Avoid Surprise Costs
Area | What to Check |
Refresh frequency | Is it truly needed? |
Autoscale | Are limits enforced? |
Data modeling | Optimized DAX & queries? |
Storage | Consolidated or messy? |
User identity & licensing | Clear mapping? |
Environment sprawl | Defined lifecycle? |
Monitoring | Usage + cost alerts set? |
Bottom Line
Power BI Embedded can be cost-efficient and powerful, but only when:
Models are optimized
Refresh logic is clean.
Capacity is sized responsibly.
Autoscale is controlled
Monitoring is in place.
The compute price is only one part of the total cost; architecture decisions matter just as much.
Power BI Embedded Alternative: Upsolve.ai for Embedded Analytics
Power BI Embedded gives you control and scale, but it also brings engineering overhead, DevOps effort, and Azure billing complexity.
If you're looking for a faster, simpler way to embed customer-facing analytics, Upsolve.ai might be the better fit.
What Is Upsolve.ai?
Upsolve is a plug-and-play embedded analytics platform made for SaaS products and platforms that need to:
Embed dashboards inside their app
Support multi-tenant data access securely.
Let users explore and personalize dashboards.
Avoid setting up Azure, managing capacity, or maintaining BI code.
It’s a full analytics layer, schema-aware, permissioned, and styled to your app.
Why Teams Choose Upsolve AI
✅ No servers or cloud capacity to manage
✅ No need to size/scale compute or pause capacity
✅ End-users can build and customize dashboards
✅ Fits complex multi-tenant apps & permissions
✅ Launch in under 24 hours
✅ Works with Supabase/Postgres + modern stacks
✅ More product-like experience than BI dashboards
✅ AI features built for end-user analytics
How It’s Different From Power BI Embedded
Feature | Power BI Embedded | Upsolve.ai |
Hosting & capacity | You manage compute, refresh, and Azure billing | Fully managed, no setup |
Multi-tenancy | Custom logic via Row Level Security (RLS) | Native, tenant-aware by default |
Embedding | iFrame + token management | iFrame & React SDK, styled, permissioned |
Setup time | Days/weeks + Azure + configs | Live in <24 hours |
BI customizations | Requires Power BI Desktop/devs | Point & click builder for users |
User personalization | Limited without Pro license | Every user gets their own workspace |
AI-powered analytics | Not native | Built-in ✨ end-user-facing AI agent |
Support | Self-serve, community forums | Dedicated onboarding, 24/7 support |
⚠️ Who It’s Not For
Upsolve isn't for teams that only need basic internal dashboards.
It’s designed for product teams embedding analytics into customer experiences, not internal BI.
What’s the ROI?
70% fewer dashboard support tickets
18% revenue lift from analytics add-ons
35% lower cost than hiring a BI/engineering team
No Azure lock-in or maintenance risk
Should You Switch?
If you're:
Spending too much time managing Power BI infrastructure
Delaying customer analytics because of dev bottlenecks
Losing leads because your dashboards feel clunky or hardcoded
Or just want to skip DAX and Azure provisioning altogether…
Then Upsolve AI is likely a better long-term fit.
Final Recommendation & Decision Matrix
By this point, you understand how Power BI Embedded charges, when commitment makes sense, and what alternatives look like.
Now let's turn that into a clear decision framework.
The goal here isn't to pick a “right” tool; it's to match the pricing model to your maturity and predictability.
If analytics usage is still evolving
Treat the first phase like product discovery.
Choose flexibility, monitor patterns, and avoid long commitments until usage behavior stabilizes.
Optimize for learning cost, not the lowest cost.
If your reporting environment is stable
Prioritize predictability and long-term efficiency.
At this stage, locking into annual capacity (or evaluating fully-managed BI options) isn’t just about cost, it’s about reducing operational overhead.
Optimize for operational confidence, not experimentation.
Decision Matrix
Your Situation | Best Move |
Exploring reporting needs | Stay flexible, avoid lock-in |
Usage varies by period/department | A capacity that can scale or pause |
Consistent dashboards across users | Lock predictable capacity |
Data insights are customer-facing | Consider managed embedded BI |
Internal BI only | Evaluate scale vs maintenance burden |
Need faster delivery cycles | Prioritize simplicity over control |
⚠️ Key Pitfall to Avoid
Don’t choose based on headline price alone.
The true cost difference usually comes from:
The time your team spends managing infrastructure
How fast can you deliver analytics to stakeholders/customers?
The consequences of slow dashboards or capacity mis-sizing
Missed insights from delays or limited adoption
Support load for one-off reporting requests
Sometimes the cheapest SKU costs the most in practice.
📌 A Simple Prioritization Model
Ask two questions:
Is analytics a core product experience or a support function?
If core → reliability and speed matter more than pure price
If support → incremental scaling is safer early on
Do we have the internal resources to manage the stack long-term?
If yes → Power BI Embedded annual becomes attractive once stable.
If no → Managed embedded analytics (like Upsolve) protects velocity.
💡 Mindset Shift
You're not just choosing a pricing model, you're choosing:
How quickly users get value
How much time does your team spend supporting dashboards?
Whether analytics becomes a differentiator or a maintenance burden
Make the decision with those lenses, not just dollar rows in a pricing table.
Next Step
Now that you have context, benchmarks, and a decision framework:
You can pick a model based on clarity, not guesswork.
If you're unsure where you fall, answer these in a Google Doc or Notion:
Who are the primary consumers of analytics?
How predictable is usage today?
How often do reporting needs change?
What is the engineering time available for BI maintenance?
Where do you expect analytics to be 12 months from now?
Your pricing choice will become obvious.
FAQs
How does Power BI Embedded pricing work?
You pay for compute capacity (A1–A6 SKUs) by the hour, not per user. More capacity = more performance and higher cost.What’s the difference between monthly and annual Power BI Embedded pricing?
Monthly (pay-as-you-go) = flexible, can pause anytime.
Annual (reserved) = locked-in capacity with a lower effective hourly rate.How much does Power BI Embedded cost per month?
Roughly from ~$740/month (A1) to ~$23,680/month (A6) if running 24/7, depending on tier and region.When should I choose monthly vs annual Power BI Embedded?
Choose monthly if usage is new or unpredictable.
Choose annual once your workloads are stable and always-on.What is A-SKU pricing in Power BI Embedded?
A-SKUs (A1–A6) are capacity tiers with different compute units (CUs). Higher A-SKU = more power, better concurrency, higher price.Can I pause and resume Power BI Embedded to save cost?
Yes, with monthly pay-as-you-go, you can pause and resume capacity to avoid paying for idle hours. Annual reserved capacity cannot be paused in the same way.

Try Upsolve for Embedded Dashboards & AI Insights
Embed dashboards and AI insights directly into your product, with no heavy engineering required.
Fast setup
Built for SaaS products
30‑day free trial


