
Compare five of the best BI software platforms for supply chain management, covering real-time dashboards, forecasting, and logistics analytics.

Ka Ling Wu
Co-Founder & CEO, Upsolve AI
10 min

Disclosure: This article is published by Upsolve AI. Where our product is mentioned alongside competitors, we aim to provide balanced coverage based on publicly available information. We encourage readers to evaluate all options independently.
I keep seeing the same pattern in supply chain teams: their data lives in too many systems, and none of them talk to each other.
ERP says one thing, WMS says another, and delivery tools add more noise.
Everyone wants one place where the truth actually stays consistent.
That’s why BI software still matters.
Not because it looks fancy, but because supply chain decisions need clarity, not chaos.
In this guide, I break down the four BI tools supply chain teams rely on,
What each tool is good at and how to pick the one that best fits your operations.
TL;DR: Best Business Intelligence Software for Supply Chain
Here’s a quick summary of the best Business intelligence tools for the Supply chain industry:
Power BI: Best for enterprise with strong data teams & Microsoft stack.
Tableau: Best for visual analytics and deep data exploration.
Qlik: Best for associative analytics and “ask-anything” exploration.
Domo: Best for real-time operational dashboard and AI-driven automations.
How to Evaluate Business Intelligence Software for Supply Chain
Choosing BI software for supply chain management is very different from choosing BI for finance or marketing.
Supply chain teams move fast, depend on real-time signals, and work across many disconnected systems.
So the evaluation criteria must be practical, not theoretical.
1. Data Integrations Across the Full Chain
Your BI tool must connect cleanly to ERP, WMS, TMS, PoS, OMS, and delivery systems or the insights will always be incomplete.
2. Real-Time Dashboards
Supply chain teams need live data on delays, inventory, and routes — not next-day refreshes.
3. Predictive Analytics & Forecasting
A good BI tool should warn you about risks before they happen, not after.
4. Multi-Stakeholder Access Control
Different roles need different views, so permissions must protect sensitive data while keeping everyone aligned.
5. AI Automations
AI should detect issues, explain trends, and highlight what matters without manual digging.
6. Easy for Non-Technical Users
If only analysts can operate the BI tool, it will never be adopted by operations teams.
7. Pricing & Scalability
Choose a BI system that scales with your data and team size, without surprise fees.
When you look at those evaluation factors side by side, a pattern appears.
Most supply chain teams don’t just need “a BI tool.”
They need three things working together:
clean integrations into ERP, WMS, TMS, PoS, and delivery systems
stable, shareable dashboards for the metrics that never change
a flexible way to ask questions on the fly, without waiting on analysts
Traditional BI tools usually solve the second part well.
Newer AI tools focus on the third.
The teams getting the most value are those that combine both.
With that in mind, let’s look at 4 Business Intelligence software that supply chain and logistics teams can actually use.
4 Best Business Intelligence Software for Supply Chain Management (Compared)
Tool | Pricing | Best For | Forecasting Quality | Integrations | Embedded Analytics | Ease of Use |
Power BI | ~$14–$24/user | Teams on Microsoft stack (Azure, Excel, Dynamics) | ⭐⭐⭐ – Good, depends on modeling | Strong across Microsoft + 3rd-party | ⭐⭐⭐ – Requires setup for multi-tenant | Easy for MS users; DAX needed |
Tableau | ~$75–$115/creator | Deep dashboards, exec reporting, enterprise analytics | ⭐⭐⭐⭐ – Great visuals, manual forecasting | Broad cloud + on-prem | ⭐⭐ – Embedding is manual | Easy for analysts; training needed |
Qlik | Capacity-based | Complex supply chains needing associative exploration | ⭐⭐⭐⭐⭐ – Strong AutoML + AI suggestions | Excellent for multi-source + hybrid | ⭐⭐⭐ – Works, not turnkey | Medium; powerful but dense |
Domo | Usage-based | Real-time ops dashboards + automation across teams | ⭐⭐⭐⭐ – Strong alerts + AI workflows | 1,000+ sources, very broad | ⭐⭐⭐⭐ – Good for sharing & portals | Easy dashboards; setup required |
1. Power BI – Best for Enterprises With Strong Data Teams and Microsoft Stack
Power BI is the tool most large companies end up using by default.
Not because it’s the easiest, and not because it’s the smartest, but because it fits perfectly into the Microsoft stack they already rely on.
If your supply chain runs on Azure, Dynamics 365, or Microsoft 365, Power BI becomes an easy, predictable choice: stable dashboards, governed data models, and strong enterprise controls.
It’s powerful, mature, and widely adopted, but it shines only when you have analysts and data engineers to support it.
What Power BI Actually Does
Connects to almost every system your supply chain touches (ERP, WMS, TMS, PoS, etc.)
Lets analysts build complex models, DAX calculations, and detailed dashboards
Works naturally with Excel, Teams, SharePoint, and Dynamics 365
Offers Power BI Embedded if you want to show reports inside your product
Uses Microsoft Fabric for AI-assisted report creation and governance
It’s the classic enterprise BI stack: predictable, well-governed, and built for structured reporting.
Why Power BI Works Well for Supply Chain
Supply chain teams with strong technical support benefit from Power BI because it:
Creates a single source of truth for enterprise-wide reporting
Handles massive datasets across multiple warehouses, regions, and business units
Fits perfectly into existing Microsoft workflows
Supports self-service exploration when dashboards need light modifications
Provides governance and security for companies with compliance requirements
If your company already operates within Microsoft systems, Power BI feels native.
Where Power BI Falls Short
But Power BI has limitations you’ll quickly feel in day-to-day operations:
Real-time visibility is hard to achieve
You need engineering to stream data; the default refresh cycle is slow for supply chain decisions.Heavy dependency on analysts
Most dashboards require modeling, DAX, and IT-managed pipelines.Poor fit for user-facing or partner-facing analytics
Power BI Embedded is possible, but slow and expensive to implement.Not built for natural-language drill-down
Copilot helps, but the workflow isn’t conversational or intuitive for ops teams.
For fast-moving supply chain environments, this slows teams down.
Pricing & Fit
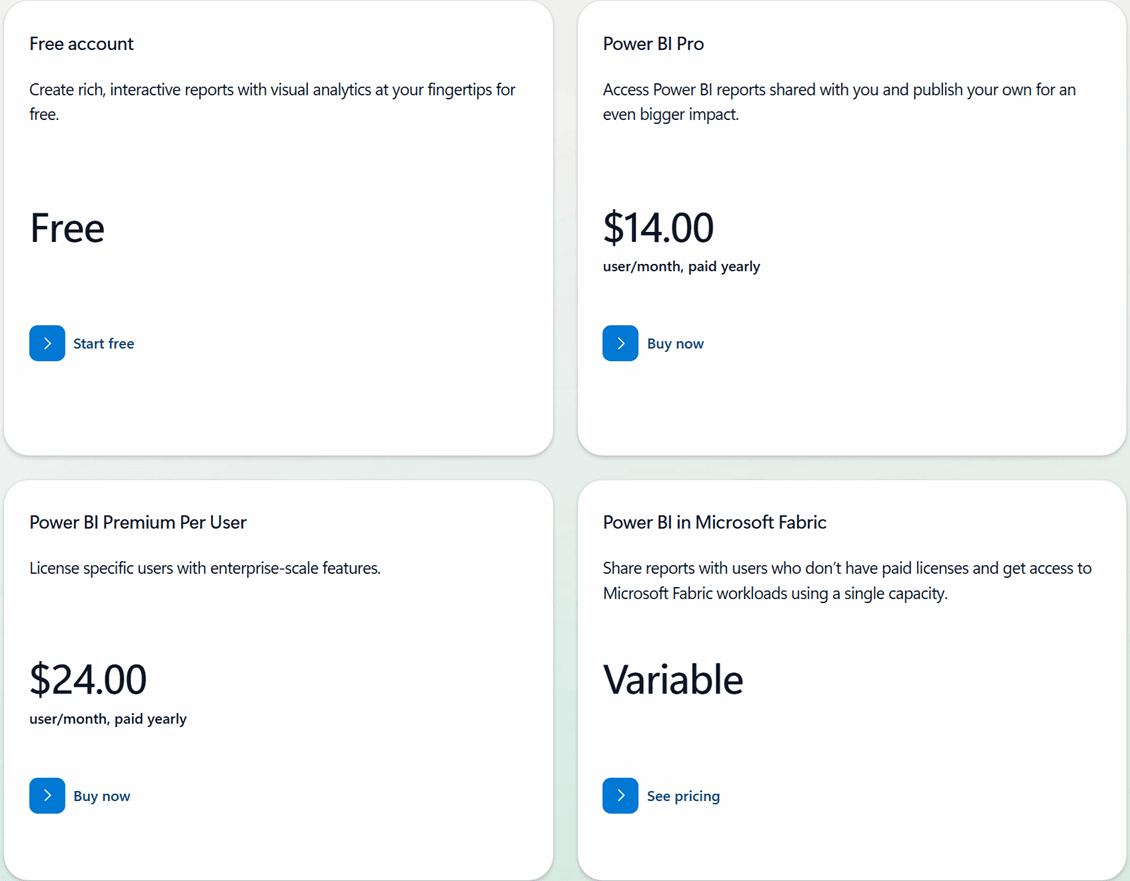
Power BI is priced lower than most enterprise BI tools:
Power BI Pro – $14/user per month
Power BI Premium Per User – $24/user per month
Power BI Embedded / Fabric – capacity-based pricing
Best For:
Enterprises on Azure, Dynamics 365, or Microsoft 365
Teams with strong BI, IT, or data-engineering resources
Companies needing controlled, governed reporting
Not Ideal For:
Real-time supply chain operations
Multi-stakeholder, customer-facing analytics
Teams without BI analysts
Natural-language analytics or AI-first exploration
2. Tableau – Best for Visual Analytics & Deep Data Exploration
Tableau is the tool people choose when they care about one thing above everything else: visualization quality.
It’s built for teams that want to explore data visually, ask questions on the fly, and create dashboards that look polished and interactive.
Compared to Power BI, Tableau feels more flexible.
Compared to modern AI-first tools, Tableau feels more manual but also more expressive.
It’s a strong fit for organizations with analysts or data teams who want freedom, design control, and deeper exploration of supply chain data.
What Tableau Actually Does
Connects to almost any data system you use: ERP, WMS, TMS, PoS, warehouse apps, delivery tools
Lets analysts build custom dashboards with advanced visualization options
Uses Tableau Next + Tableau Pulse for AI-supported insights
Supports on-prem, cloud, and hybrid deployments
Integrates natively with Salesforce (CRM, Einstein AI, Data Cloud)
Offers a strong data prep and transformation layer (Tableau Prep)
It’s built for rich, exploratory analytics, not quick operational monitoring.
Why Tableau Works Well for Supply Chain
Supply chain teams dealing with complex data patterns (routes, geospatial views, forecasting visuals, SKU-level charts) get real value because Tableau:
Delivers advanced visual storytelling
- maps, layers, custom hierarchies, distribution charts, and deep drill-downs.Supports deeper data exploration
Analysts can see patterns that basic BI tools usually hide.Works well for companies already on Salesforce
Data Cloud + Tableau is a strong combination for supply chain insights.Handles large datasets gracefully
Especially useful for multi-region operations with big order volumes.Provides strong collaboration features
Teams can share dashboards, annotate, and work together easily.
If your goal is to understand the data deeply, Tableau is excellent.
Where Tableau Falls Short
Tableau’s biggest strengths come with real trade-offs:
Not ideal for real-time operations
Live tracking (like fleet delays or inventory drops) requires heavy backend work.Steeper learning curve
Analysts need to understand joins, calculations, LOD expressions, and performance tuning.Not built for embedded customer-facing analytics
Possible, but expensive and requires an engineering-heavy setup.AI is helpful, but not operational
Tableau’s AI (Pulse, Agent, Next) is more insight-supporting than action-driving.Cost grows quickly
Creator: $75–$115 per user/month
Additional users: $15–$35
More expensive than Power BI by a wide margin.
Pricing & Fit
From the public pricing:
Tableau Standard (Cloud/Server) – $75 per Creator, $15–$25 for others
Tableau Enterprise – $115 per Creator, $35 for others
Tableau+ Bundle (with Tableau Next) – premium pricing
Best For:
Teams that prioritize visualization, exploration, and design quality
Analysts who want freedom to build complex dashboards
Companies on Salesforce
Scenarios where data depth matters more than real-time monitoring
Not Ideal For:
Real-time supply chain operations
Non-technical operations teams who need simple dashboards
Embedded analytics for customers or partners
AI-first workflows or natural-language drill-down
3. Qlik Sense – Best for Associative Analytics and “Ask-Anything” Exploration

Qlik is the tool you pick when you don’t just want dashboards, you want to poke holes in your own data from every angle.
Instead of the usual “fixed query” BI model, Qlik’s associative engine lets users click around in any direction and see how metrics change in context.
For supply chain teams, that means you can jump from
SKU → lane → carrier → region → vendor
without rebuilding a query each time.
It’s powerful, fast, and great for teams that want to discover hidden patterns — but it still assumes you have some data maturity.
What Qlik Actually Does
At a practical level, Qlik lets you:
Connect data from ERP, WMS, TMS, PoS, OMS, and more
Explore everything with an associative engine instead of rigid drill paths
Use AI/ML features (Qlik AutoML, Insight Advisor) for suggestions and predictions
Set up intelligent alerts and automations when something breaks in the data
Embed analytics into internal tools, portals, or products
Run it on-prem (Qlik Sense) or in the cloud (Qlik Cloud Analytics)
The end result: it’s easier to ask unplanned questions about your supply chain without redesigning your whole data model each time.
Why Qlik Works Well for Supply Chain
For supply chain and logistics, Qlik is especially useful when:
You have lots of interconnected data (orders, lanes, carriers, warehouses, vendors)
You want planners and analysts to slice in any direction without submitting IT tickets
You need alerting + automation (e.g., trigger workflows when OTIF falls, when a lane underperforms, when inventory crosses a threshold)
You want predictive views (AutoML for demand risk, lead time shifts, or route performance)
You operate in industries that still care about on-prem or hybrid setups
Qlik fits well as an “exploration engine” on top of a complex supply chain.
Where Qlik Falls Short
You still feel a few gaps:
Not built for pure embedded, user-facing analytics
You can embed, but it’s not opinionated around multi-tenant SaaS analytics.Associative logic can confuse non-analysts
Ops teams might need onboarding to understand selections and context.Pricing is capacity-based and not trivial
Qlik Cloud Analytics is priced around data capacity + tier, not just per seat.Setup still needs data modeling
You still need someone who understands joins, data prep, and governance.AI helps, but doesn’t replace process design
Insight Advisor and AutoML are strong, but they don’t magically fix bad data or broken workflows.
Pricing & Fit
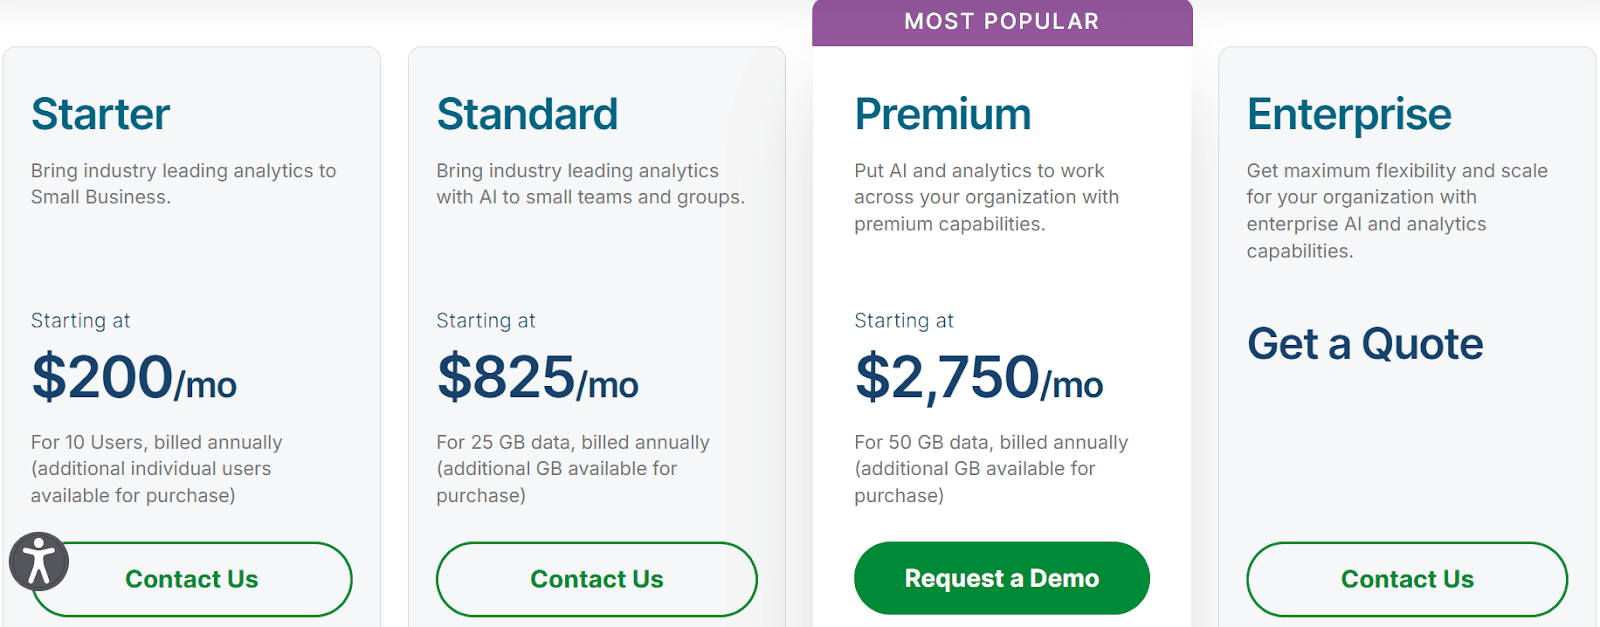
From the public cloud pricing:
Starter – from ~$200/month (10 users, 25 GB data)
Standard – from ~$825/month (25 GB, more features)
Premium / Enterprise – higher capacity, more AI, more automation, custom quotes
Best For:
Mid-market and enterprise supply chain teams with complex, multi-source data
Companies that want deep exploration, not just static KPIs
Organizations that care about on-prem / hybrid options
Not Ideal For:
Very small teams that just want simple dashboards
Products that need fully white-labeled, multi-tenant embedded analytics
Teams expecting “AI to do everything” without modeling and governance
4. Domo – Best for Real-Time Operational Dashboards & AI-Driven Automation
Domo is the platform you choose when you want more than BI dashboards, you want a real-time operational command center that connects every supply chain system and automates actions end-to-end.
Instead of treating BI as a reporting layer, Domo blends data integration, dashboards, automations, and AI agents into one stack.
For supply chain teams, that means you can monitor OTIF, route performance, inventory shifts, demand fluctuations, and bottlenecks while triggering workflows automatically.
It’s powerful, broad, and built for organizations that want visibility + action in one platform.
What Domo Actually Does
In practical terms, Domo lets you:
Connect 1,000+ systems (ERP, WMS, TMS, OMS, PoS, spreadsheets, APIs, warehouses, e-comm, CRM)
Build real-time operational dashboards used by planners, managers, and field teams
Use Domo.AI to generate insights, create AI agents, and answer questions
Build automations that trigger when metrics break (delays, stockouts, underperforming lanes)
Create low-code internal apps on top of data
Share dashboards with unlimited users through mobile, desktop, or embedded formats
The end result: supply-chain teams get instant visibility + automated responses, not just reporting.
Why Domo Works Well for Supply Chain
Domo is especially strong when:
You need unified visibility across logistics, vendors, orders, warehouses, fleet, and finance
Your ops teams need mobile, real-time dashboards
You want AI agents that can proactively monitor KPIs and trigger actions
You want workflows like:
“If carrier delay > 12 hours → alert team → create ticket → update customer dashboard”You want to democratize data for planners, analysts, and non-technical warehouse teams
You want both BI + automation in one system, not separate tools for each function
Domo shines when the goal is operational execution, not just analysis.
Where Domo Falls Short
You may feel a few limitations:
Not built for deep embedded customer-facing analytics
Requires data prep and modeling — not as plug-and-play as basic BI tools
Pricing is usage-based and can get expensive at scale
AI is powerful but still needs clean data & workflow design
Not ideal for teams that only need simple KPI dashboards
Pricing & Fit
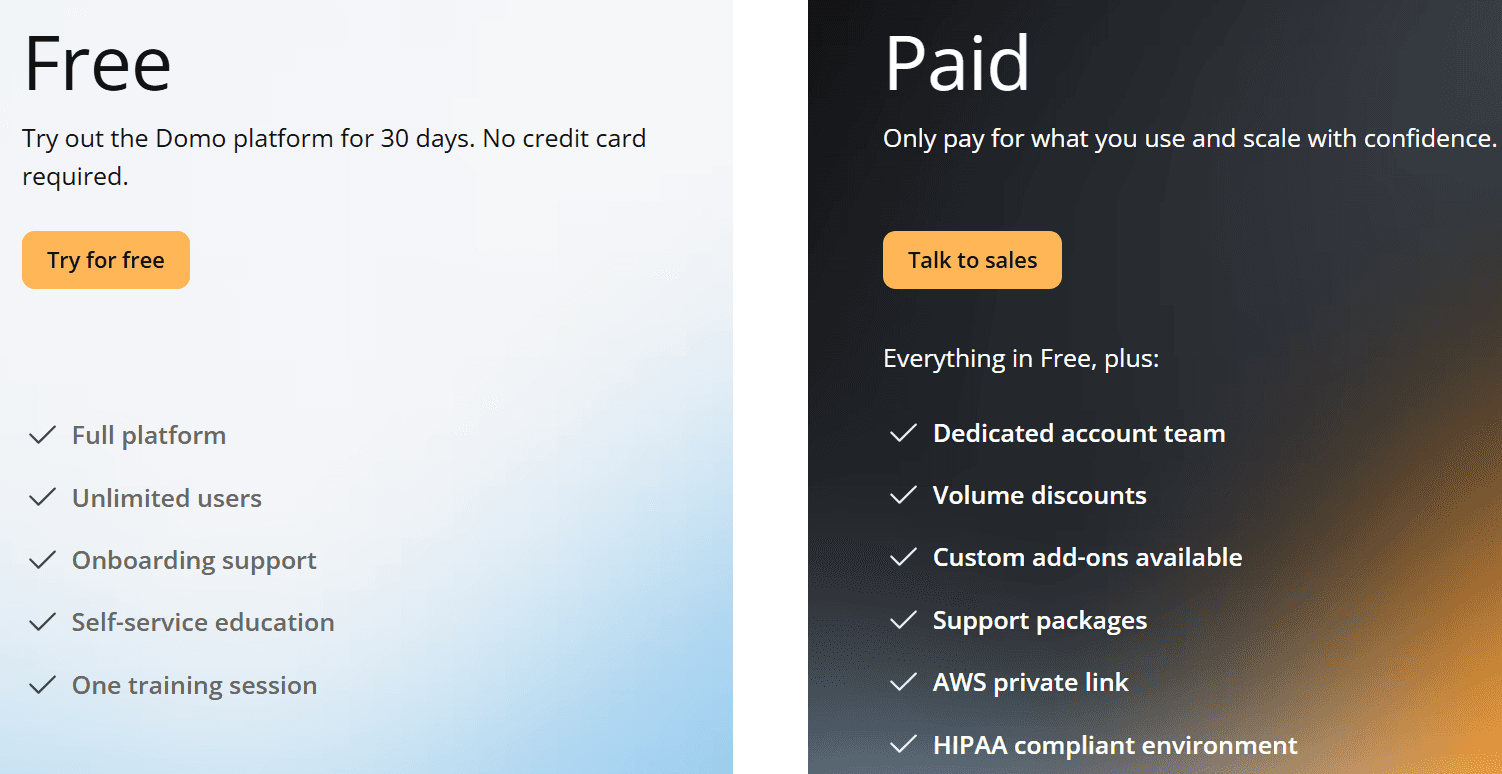
Domo follows a platform + usage model:
Free = 30-day full-feature trial
Paid = custom pricing based on usage, capacity, and add-ons
Typically higher total cost than standard BI tools because it includes:
Data integration
BI
Automation
AI agents
Unlimited users
Domo is designed as an enterprise-grade operational intelligence platform, not just a dashboard tool.
Best For
Mid-market and enterprise companies with multi-layered supply chain data
Teams that need operational dashboards + automations
Organizations want AI agents to monitor KPIs
Businesses needing real-time mobile insights across warehouses, stores, and logistics
Not Ideal For
Very small teams
Companies looking only for simple dashboards
SaaS tools needing multi-tenant embedded analytics
Teams expecting AI insights without data modeling
But if you’re expecting AI to magically fix broken data or deliver perfect insights without proper modeling, none of these tools will perform the way you want.
That’s where choosing the right BI platform for your supply chain becomes critical.
How to Choose the Right BI Tool for Your Supply Chain
Picking the right BI platform depends on your company size, data stack, team type, and use case. Here's the simplest way to decide:
1. By Company Size
Small teams (fast setup, simple dashboards): Power BI
Mid-market (multiple systems, forecasting needs): Qlik, Tableau
Enterprise (heavy data, governance, AI): Qlik, Domo
2. By Data Sources
ERP-only: Power BI, Tableau
ERP + WMS + TMS + PoS + OMS: Qlik, Domo
IoT / real-time ops data: Domo, Qlik
3. By Team Type
Ops/Logistics teams: Power BI, Domo
Data/Analytics teams: Qlik, Tableau
Cross-functional teams: Qlik, Domo
4. By Use Case
Inventory: Qlik
Logistics/OTIF: Domo
Forecasting: Qlik, Tableau
Fulfillment/SLA tracking: Power BI
Customer-facing / embedded analytics: see the embedded analytics section below
Quick Summary
There is no single best platform for every supply chain. If you live in the Microsoft stack, Power BI is the natural fit; if visualization depth matters most, Tableau stands out; for associative, ask-anything exploration, Qlik is strong; and for real-time operational dashboards with automation, Domo fits well. Match the tool to your data sources, your team's technical depth, and whether your priority is real-time operations or deep exploration.
Where Upsolve AI Fits: Embedded, Customer-Facing Supply Chain Analytics
The platforms above are built mainly for internal supply chain reporting and planning. There is a related but different job: giving your own customers, partners, or operations users analytics inside your product or portal rather than in a separate BI seat. That is the use case Upsolve AI is built for.
Upsolve AI is an agentic analytics platform for embedding analytics into a product. Rather than shipping one fixed dashboard, you embed a component (React or iFrame) and each user gets a role-aware view, for example a warehouse manager, a logistics lead, or an external customer, plus a natural-language layer for follow-up questions. Your team encodes the metrics and business rules so those answers stay accurate. For supply chain SaaS and logistics platforms, that means customers and partners can track OTIF, lane performance, or inventory without you building and maintaining a separate dashboard for every account. Supply chain platform PAXAFE uses Upsolve this way, embedding customer-facing analytics into its product.
It is not a demand-planning or forecasting suite like several of the tools above, and it is not meant to replace internal enterprise BI. It is the embedded, customer-facing analytics layer that sits on top of your supply chain data.
For a deeper look at AI-driven supply chain analytics and where embedded analytics fits alongside planning and forecasting tools, see our guide to AI-powered supply chain analytics.

Try Upsolve for Embedded Dashboards & AI Insights
Embed dashboards and AI insights directly into your product, with no heavy engineering required.
Fast setup
Built for SaaS products
30‑day free trial


