
Learn what AI observability means, which metrics matter, and how teams monitor models, data, and users to keep AI reliable in production.

Ka Ling Wu
Co-Founder & CEO, Upsolve AI
10 min

If you’ve deployed AI models, LLMs, recommendation engines, fraud detection, and chatbots, you know the real problems don’t show up in your test suite.
They show up in production.
Models drift. Inputs break. Hallucinations go live. And suddenly, your “accurate” system is flagging wrong users or spewing nonsense to customers.
That’s where you use AI Observability.
Unlike traditional monitoring, which just tells you what broke, AI observability helps you track why, a core capability of AI-powered business intelligence with visibility into data quality, model behavior, infra health, and even how real users are reacting to outputs.
In this guide, I’ll break down:
What AI Observability actually means (in plain English)
Key metrics that matter (PSI, SHAP, latency, cost-per-inference, etc.)
Examples from real-world systems (chatbots, HR models, fraud engines)
Why it's critical (compliance, hallucinations, cost control)
The difference between AI observability vs ML monitoring
Tools to implement it, including how we do it inside Upsolve.ai
If you're running any kind of production AI system, this will help you build observability into the stack, not just logs and metrics, but explainability, feedback loops, and compliance.
Let’s get into it.
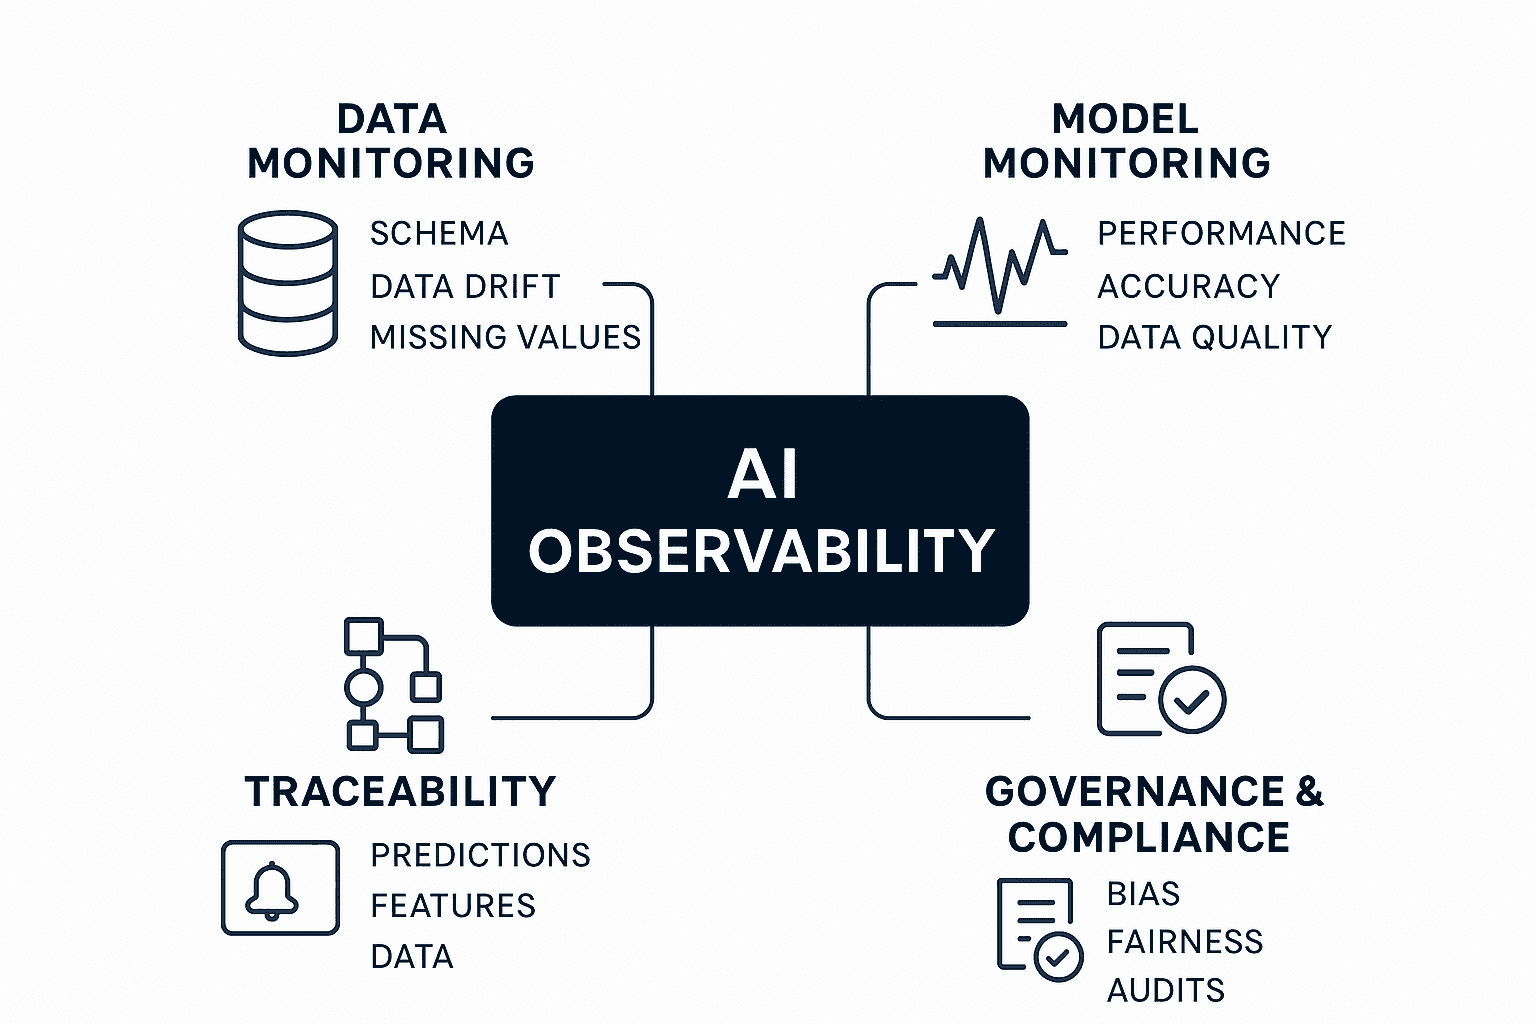
What Is AI Observability?
AI observability refers to the ability to continuously monitor, analyze, and troubleshoot AI systems in production, encompassing data, models, infrastructure, and user behavior.
You’re not just tracking uptime or error logs. You’re watching for:
Input data drift
Latency spikes
Inference cost blow-ups
User complaints about hallucinated outputs
And fairness or bias in decisions (especially in regulated industries)
It’s what lets you answer:
Why did this LLM generate garbage after last week’s update?
Is this fraud model drifting because the transaction pattern changed?
Why are users dropping off after step 3 of our onboarding bot?
Most teams confuse AI observability with ML monitoring. The key difference?
Aspect | ML Monitoring | AI Observability |
Focus | Logs, metrics, alerts | End-to-end system behavior |
Scope | Models only | Data + models + infra + UX |
Questions | What broke? | Why did it break? |
Use Case | Accuracy and drift | Debugging, compliance, feedback loops |
So basically, you can think of AI observability as the black box flight recorder for your AI systems, capturing everything from input changes and prediction errors to what users actually did in response.
And as AI systems get more complex, multi-modal models, agent chains, external API calls - it’s no longer optional.
If you can’t observe it, you can’t trust it.
Why Does AI Observability Matter?
Most production AI systems are no longer simple models in notebooks.
They’re multi-step pipelines:
LLM chains making decisions across APIs
Real-time models handling customer queries
AI Agent workflows pulling data from 3rd-party tools
Dashboards served to end users based on live inference
This means things can (and do) break silently without logging an error.
You don’t just need alerts. You need observability across:
Input data (Did the schema change?)
Model behavior (Why is latency spiking at night?)
Infrastructure (GPU throttling during inference?)
User feedback (Are users flagging hallucinations?)
Here's what happens when you don’t have observability:
A fine-tuned GPT-based support bot starts pushing wrong product info → no one notices for 3 weeks.
A fraud detection model starts blocking legit users after a seasonal spike → support tickets blow up.
An HR recommendation engine gets flagged for gender bias during a compliance audit → and you have no traceability.
And it’s not just about performance anymore:
Regulators (EU AI Act, FTC, SOC 2) now expect explainability and audit trails.
Enterprise buyers want proof you’re monitoring fairness, safety, and uptime.
Users are less forgiving when AI makes mistakes that feel unfair or risky.
This is exactly why we built Upsolve.ai
At Upsolve.ai, we’ve seen teams catch these issues early by embedding role-based observability into their dashboards.
Not just logs and metrics, but feedback loops and explainability are layered into the UI.
Core Components of AI Observability (with Metrics & Examples)
Component | Key Metrics | Example in Practice |
Data Quality & Drift | Completeness %, schema mismatches, drift score (PSI/KL divergence) | Detecting seasonal transaction drift in fraud detection models |
Model Performance & Behaviour | Accuracy, precision, recall, F1, latency (ms), throughput (req/sec), token usage & cost | Monitoring chatbot latency spikes with complex prompts |
System & Infrastructure Health | CPU/GPU utilization %, memory usage, uptime %, failed jobs, scaling events | The recommendation engine is slowing down due to GPU memory saturation |
Logs, Traces & Pipelines | Error rates, response times, trace depth, and failed inference calls | Spike in failed API calls within a model serving pipeline |
User Signals & Feedback | Engagement rates, anomaly reports, feedback ratios (👍/👎) | Users flagging hallucinations in a medical AI assistant |
Explainability, Fairness & Compliance | SHAP/LIME values, fairness parity score, compliance checks | HR model audited for gender bias in candidate shortlisting |
1. Data Quality & Drift
Your AI model’s accuracy depends on the quality and stability of its input data.
If the data changes, your model’s performance can drop fast.
What to Monitor:
Missing or incomplete data
Schema mismatches
Seasonal or unexpected data distribution shifts
Key Metrics:
Data completeness % → How much usable data do you have
Schema mismatch count → Errors caused by inconsistent structures
Drift score (PSI/KL divergence) → Measures how much current data differs from historical patterns
Example in Practice:
A fraud detection model starts giving false positives during holiday seasons.
With Upsolve.ai, you get instant alerts about data drift and visual dashboards showing where the shifts happened.
2. Model Performance & Behaviour
Even the best AI models degrade over time if they’re not appropriately monitored.
Tracking accuracy, speed, and cost ensures your models stay reliable.
What to Monitor:
Prediction accuracy and reliability
Response speed and latency
Token usage and inference costs for generative AI models
Key Metrics:
Accuracy % → Measures prediction correctness
Latency (ms) → How fast your AI responds
Throughput (req/sec) → How many requests your model can handle
Token usage & inference cost → Important for optimizing expenses in LLMs
Example in Practice:
A generative AI chatbot starts responding slowly as prompts get longer.
Upsolve.ai spots latency spikes, identifies the cause, and notifies your engineering team instantly.
3. System & Infrastructure Health
Your AI’s performance depends heavily on the underlying infrastructure.
When resources are overused or scaling fails, models slow down or crash.
What to Monitor:
CPU & GPU utilization
Memory usage and storage saturation
System uptime and pipeline stability
Scaling events during peak demand
Key Metrics:
CPU/GPU utilization % → Detects compute bottlenecks
System uptime % → Measures service reliability
Memory usage → Tracks saturation levels
Failed jobs → Identifies operational issues.
Example in Practice:
A recommendation engine starts to slow down during peak traffic because its GPU memory is maxed out.
With Upsolve.ai, you get instant alerts, visibility into resource usage, and actionable recommendations to help you auto-scale your infrastructure.
4. Logs, Traces & Pipelines
AI pipelines are the backbone of real-time decision-making.
A single API failure can cascade into multiple outages if not detected early.
What to Monitor:
End-to-end request traces
Anomalies in logs
Failed inference calls
Key Metrics:
Error rates → Monitor model-serving failures
Average response times → Track performance delays
Trace depth → Identify where pipelines slow down.
Example in Practice:
A sudden spike in failed API calls disrupts your model-serving pipeline.
Upsolve.ai highlights the issue immediately, helping teams pinpoint the root cause and fix problems faster.
5. User Signals & Feedback
Your users are the ultimate quality control for your AI systems.
Tracking their engagement and feedback ensures that your models deliver accurate and trustworthy results.
What to Monitor:
User engagement patterns
Satisfaction levels
Anomaly flags and manual feedback
Key Metrics:
Engagement rates → Are users interacting with AI outputs?
Feedback ratios (👍/👎) → Measure model trustworthiness
Anomaly reports → Spot incorrect predictions early.
Example in Practice:
A medical AI assistant starts hallucinating results.
With Upsolve.ai, users can flag errors instantly, enabling teams to investigate issues and improve model accuracy in real time.
6. Explainability, Fairness & Compliance
What to Monitor:
Model explainability
Bias across demographic groups
Compliance with regulations like GDPR, SOC 2, and the EU AI Act
Key Metrics:
SHAP/LIME values → Understand prediction drivers
Fairness parity score → Detects discrimination in outputs.
Compliance checks → Verify adherence to legal standards
Example in Practice:
An HR AI model is audited for gender bias in candidate shortlisting.
Upsolve.ai generates explainability dashboards showing why each decision was made, keeping you audit-ready and compliant.
How to Implement AI Observability in Your Stack
Getting started with AI observability doesn’t have to be overwhelming.
The key is to layer it in gradually so your team gains visibility where it matters most.
1. Start with Internal Monitoring
Begin by tracking your data pipelines and model performance inside the backend.
Use MLflow to track model versions and experiments. For LLM-specific monitoring, explore LLM observability tools.
Add Prometheus for infrastructure metrics like latency and uptime.
Use Evidently AI to monitor data drift, missing values, and feature changes.
This gives your team the foundation to catch silent failures early.
2. Add Embedded Observability at the Product Layer
Backend monitoring is critical, but it only tells half the story.
Users also need to see, trust, and act on AI outputs. This is where customer-facing analytics and embedded observability come in.
This is where embedded observability comes in.
By surfacing metrics, dashboards, and explanations inside your product through embedded analytics, you close the gap between internal monitoring and end-user trust.
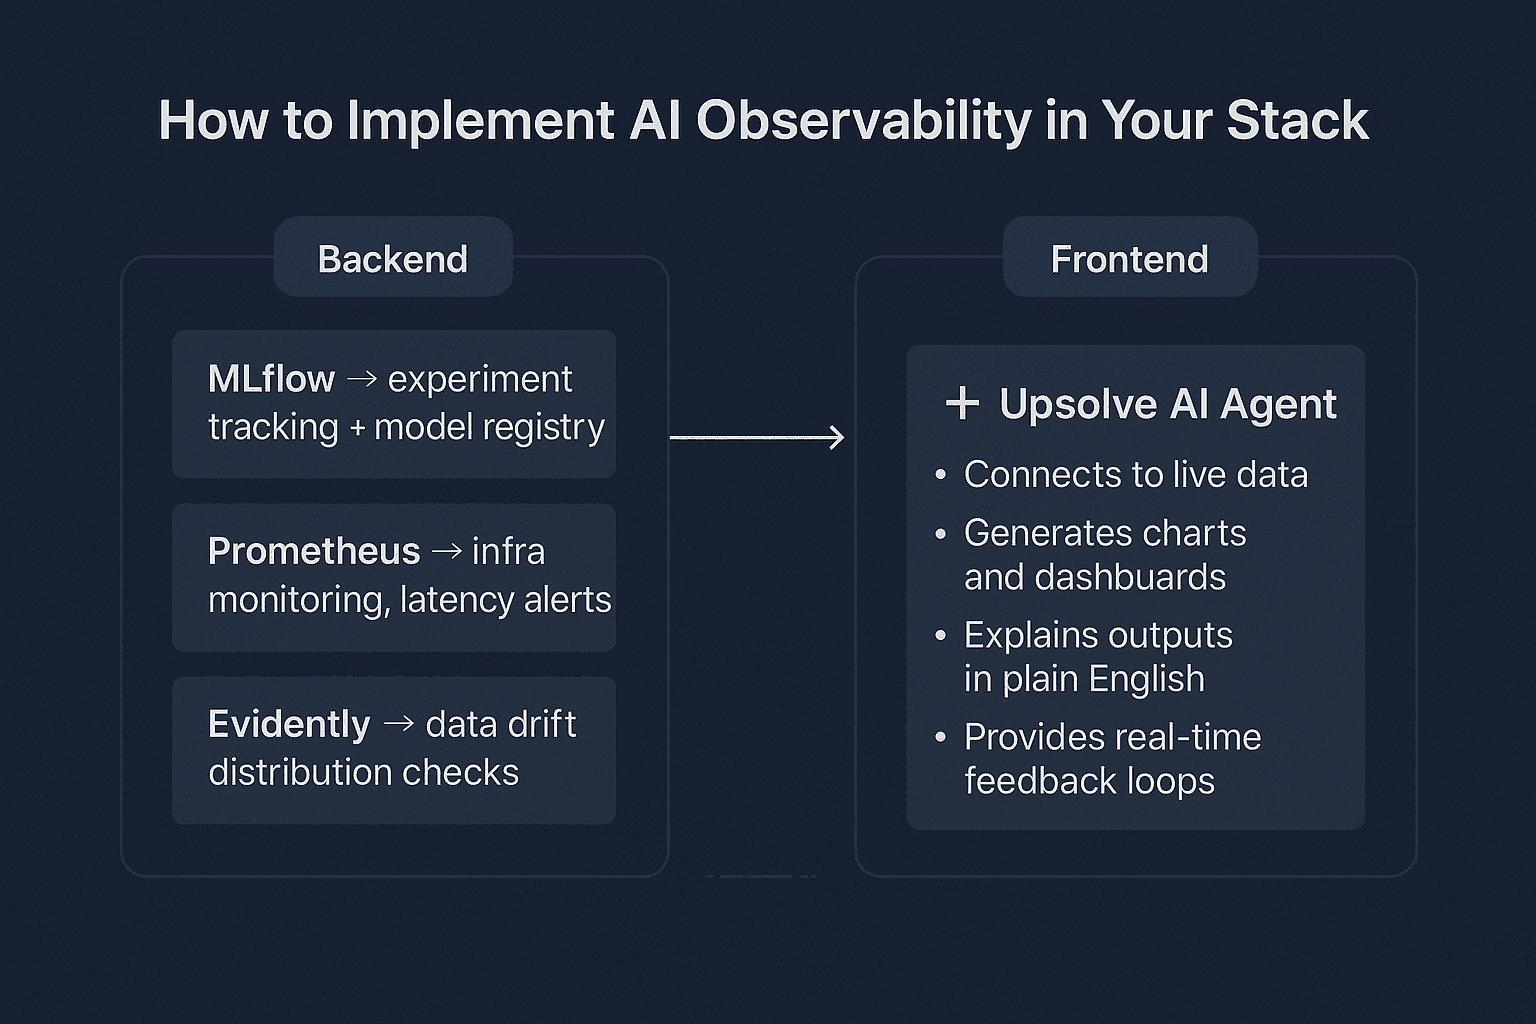
3. Example Architecture
A simple, modern AI observability stack might look like this:
Backend (internal visibility):
MLflow → experiment tracking + model registry
Prometheus → infra monitoring, latency alerts
Evidently → data drift, distribution checks
Frontend (user-facing visibility):
Upsolve AI Agent → embedded observability for users and teams
Connects to live data
Generates charts and dashboards
Explains outputs in plain English
Provides real-time feedback loops
Embedding Observability with Upsolve in 4 Steps
Upsolve makes it easy to bring observability directly into your product or workflows.
Step 1: Connect Your Data
Link your databases, APIs, and analytics tools through secure connectors.
Upsolve automatically discovers schema, freshness, and access rules.
Step 2: Define Semantic Layer & Golden Queries
Map raw tables into business-friendly terms.
Add golden queries (pre-vetted SQL) so agents always pull accurate insights.
Step 3: Deploy the Data Agent
Embed the agent inside:
Your SaaS product (React/iFrame embed)
Slack or support bots
Internal dashboards
This makes observability visible where your users already work.
Step 4: Monitor & Optimize
Upsolve continuously tracks:
Accuracy of responses
Data freshness
Usage patterns
You can review performance, fine-tune prompts, and close the feedback loop without rebuilding your stack.
The result: A full-stack observability loop from backend pipelines to user-facing analytics—that ensures your AI stays accurate, explainable, and trusted over time.
Challenges Teams Face Without Observability
When teams skip observability, problems pile up fast:
Poor user trust in predictions
If users can’t see why an AI made a decision, they lose confidence. Trust takes months to build but seconds to lose.Black-box models are impossible to debug
When errors happen, teams end up guessing. Without observability, it’s like trying to fix a car with the hood welded shut.Fragmented tools between data, ML, and product teams
Each team runs its own dashboards and logs. But without a single source of truth, nobody sees the full picture—and issues slip through the cracks.Compliance and audit gaps
Regulators expect explainability, fairness, and traceability. Without observability, you’re always on the defensive when audits arise.Over-reliance on dashboards instead of real-time insights
Static charts tell you what happened yesterday. Observability agents tell you what’s happening right now, so you can act before users notice.
AI Observability vs MLOps vs AIOps – What’s the Difference?
These terms often get mixed up, but they serve different purposes:
AI Observability → Helps you see what’s happening across data, models, infra, and users. It’s about visibility and trust.
MLOps → Focuses on managing the ML lifecycle—from training and CI/CD to deployment and retraining. It’s the DevOps layer for machine learning.
AIOps → Uses AI to automate IT operations, like detecting anomalies in server logs or auto-scaling cloud resources.
Think of them like this:
MLOps makes sure you can build, ship, and retrain models.
AI Observability makes sure you can trust and debug those models in the real world.
AIOps ensures that your underlying IT systems run smoothly, often utilizing AI itself.
When to integrate them:
Start with MLOps to handle the basics of building and deploying models.
Add AI Observability once models go live so you can monitor fairness, drift, and user trust.
Layer in AIOps if you’re running large-scale, complex infra that needs automation for efficiency.
Together, they form a complete loop: build → observe → automate.
Conclusion
AI systems don’t fail quietly.
They fail in public through hallucinations, bias, downtime, or hidden costs that eat margins.
That’s why AI observability is no longer optional. It’s the difference between:
Catching drift before it impacts customers
Explaining outputs when regulators come knocking
Scaling models without runaway GPU costs
Building trust with users who rely on your AI daily
Traditional monitoring tells you something broke.
Observability tells you why, and gives you the evidence to fix it fast.
At Upsolve.ai, we’ve built observability into the stack itself.
Instead of one generic dashboard, we give persona-based visibility:
Ops teams see infra health.
Product teams see usage and drift.
Compliance teams see explainability and audit logs.
Business leaders see customer-facing insights.
That’s how AI moves from “black box” to accountable, transparent, and reliable systems.
For teams specifically monitoring AI agents, we've also compiled a guide to AI agent observability platforms.
👉 If you’re running production AI and need observability that scales with you, book a demo with Upsolve.ai and see how fast you can get it live.
FAQs About AI Observability
1. What is AI observability in simple terms?
AI observability refers to the continuous monitoring, analysis, and understanding of your AI systems, enabling you to identify issues, enhance performance, and ensure reliability.
2. How is AI observability different from regular monitoring?
Regular monitoring checks basic metrics like uptime or errors.
AI observability goes deeper, combining data quality, model performance, infrastructure, pipelines, and user feedback to give a 360° view of your AI ecosystem.
3. What are the top metrics every AI team should track?
Model performance → Accuracy, precision, recall, F1 score
Data health → Drift scores, schema mismatches, completeness %
System health → Latency, uptime, CPU/GPU usage
LLM-specific metrics → Token usage, hallucination rates, inference costs
4. How can Upsolve.ai help with AI observability challenges?
Combines data, model, and infra insights into one dashboard
Uses Ask Dash for natural language analytics
Monitors LLMs, generative AI models, and pipelines effortlessly
Integrates smoothly with existing tools using OpenTelemetry
5. Can AI observability improve model governance and compliance?
Absolutely. By monitoring bias, fairness, explainability, and regulatory checks, AI observability ensures your models are ethical, transparent, and audit-ready.
Upsolve.ai makes this process seamless with automated compliance reporting.

Try Upsolve for Embedded Dashboards & AI Insights
Embed dashboards and AI insights directly into your product, with no heavy engineering required.
Fast setup
Built for SaaS products
30‑day free trial


